Hillsboro Airbnb Market Analysis 2026: Short Term Rental Data & Vacation Rental Statistics in West Virginia, United States
Is Airbnb profitable in Hillsboro in 2026? Explore comprehensive Airbnb analytics for Hillsboro, West Virginia, United States to uncover income potential. This 2026 STR market report for Hillsboro, based on AirROI data from February 2025 to January 2026, reveals key trends in the niche market of 27 active listings.
Whether you're considering an Airbnb investment in Hillsboro, optimizing your existing vacation rental, or exploring rental arbitrage opportunities, understanding the Hillsboro Airbnb data is crucial. Leveraging the low regulation environment is key to maximizing your short term rental income potential. Let's dive into the specifics.
Key Hillsboro Airbnb Performance Metrics Overview
Monthly Airbnb Revenue Variations & Income Potential in Hillsboro (2026)
Understanding the monthly revenue variations for Airbnb listings in Hillsboro is key to maximizing your short term rental income potential. Seasonality significantly impacts earnings. Our analysis, based on data from the past 12 months, shows that the peak revenue month for STRs in Hillsboro is typically June, while March often presents the lowest earnings, highlighting opportunities for strategic pricing adjustments during shoulder and low seasons. Explore the typical Airbnb income in Hillsboro across different performance tiers:
- Best-in-class properties (Top 10%) achieve $4,364+ monthly, often utilizing dynamic pricing and superior guest experiences.
- Strong performing properties (Top 25%) earn $2,363 or more, indicating effective management and desirable locations/amenities.
- Typical properties (Median) generate around $1,149 per month, representing the average market performance.
- Entry-level properties (Bottom 25%) see earnings around $545, often with potential for optimization.
Average Monthly Airbnb Earnings Trend in Hillsboro
Hillsboro Airbnb Occupancy Rate Trends (2026)
Maximize your bookings by understanding the Hillsboro STR occupancy trends. Seasonal demand shifts significantly influence how often properties are booked. Typically, Junesees the highest demand (peak season occupancy), while April experiences the lowest (low season). Effective strategies, like adjusting minimum stays or offering promotions, can boost occupancy during slower periods. Here's how different property tiers perform in Hillsboro:
- Best-in-class properties (Top 10%) achieve 67%+ occupancy, indicating high desirability and potentially optimized availability.
- Strong performing properties (Top 25%) maintain 56% or higher occupancy, suggesting good market fit and guest satisfaction.
- Typical properties (Median) have an occupancy rate around 36%.
- Entry-level properties (Bottom 25%) average 23% occupancy, potentially facing higher vacancy.
Average Monthly Occupancy Rate Trend in Hillsboro
Average Daily Rate (ADR) Airbnb Trends in Hillsboro (2026)
Effective short term rental pricing strategy in Hillsboro involves understanding monthly ADR fluctuations. The Average Daily Rate (ADR) for Airbnb in Hillsboro typically peaks in September and dips lowest during April. Leveraging Airbnb dynamic pricing tools or strategies based on this seasonality can significantly boost revenue. Here's a look at the typical nightly rates achieved:
- Best-in-class properties (Top 10%) command rates of $287+ per night, often due to premium features or locations.
- Strong performing properties (Top 25%) achieve nightly rates of $180 or more.
- Typical properties (Median) charge around $91 per night.
- Entry-level properties (Bottom 25%) earn around $63 per night.
Average Daily Rate (ADR) Trend by Month in Hillsboro
Get Live Hillsboro Market Intelligence 👇

Explore Real-time Analytics
Airbnb Seasonality Analysis & Trends in Hillsboro (2026)
Peak Season (June, August, July)
- Revenue averages $3,030 per month
- Occupancy rates average 52.1%
- Daily rates average $161
Shoulder Season
- Revenue averages $1,848 per month
- Occupancy maintains around 36.2%
- Daily rates hold near $168
Low Season (February, March, April)
- Revenue drops to average $1,174 per month
- Occupancy decreases to average 32.0%
- Daily rates adjust to average $152
Seasonality Insights for Hillsboro
- The Airbnb seasonality in Hillsboro shows highly seasonal trends requiring careful strategy. While the sections above show seasonal averages, it's also insightful to look at the extremes:
- During the high season, the absolute peak month showcases Hillsboro's highest earning potential, with monthly revenues capable of climbing to $3,374, occupancy reaching a high of 59.2%, and ADRs peaking at $175.
- Conversely, the slowest single month of the year, typically falling within the low season, marks the market's lowest point. In this month, revenue might dip to $1,139, occupancy could drop to 28.9%, and ADRs may adjust down to $151.
- Understanding both the seasonal averages and these monthly peaks and troughs in revenue, occupancy, and ADR is crucial for maximizing your Airbnb profit potential in Hillsboro.
Seasonal Strategies for Maximizing Profit
- Peak Season: Maximize revenue through premium pricing and potentially longer minimum stays. Ensure high availability.
- Low Season: Offer competitive pricing, special promotions (e.g., extended stay discounts), and flexible cancellation policies. Target off-season travelers like remote workers or budget-conscious guests.
- Shoulder Seasons: Implement dynamic pricing that balances peak and low rates. Target weekend travelers or specific events. Offer slightly more flexible terms than peak season.
- Regularly analyze your own performance against these Hillsboro seasonality benchmarks and adjust your pricing and availability strategy accordingly.
Best Areas for Airbnb Investment in Hillsboro (2026)
Exploring the top neighborhoods for short-term rentals in Hillsboro? This section highlights key areas, outlining why they are attractive for hosts and guests, along with notable local attractions. Consider these locations based on your target guest profile and investment strategy.
| Neighborhood / Area | Why Host Here? (Target Guests & Appeal) | Key Attractions & Landmarks |
|---|---|---|
| Hillsboro Historic District | Charming area featuring historic architecture and a small-town vibe. Perfect for guests looking for a quiet getaway in a quaint environment. | Hillsboro Historic Site, local shops, rustic eateries, nature trails, historical tours |
| Greenbrier River Trail | Beautiful trail along the Greenbrier River; popular among outdoor enthusiasts and cyclists. Ideal for nature lovers seeking recreational activities. | Greenbrier River, biking and hiking trails, picnic areas, wildlife viewing, fishing spots |
| Monongahela National Forest | A vast protected forest area ideal for nature trips and camping. Attracts visitors seeking outdoor adventures and scenic beauty. | hiking trails, scenic overlooks, wildlife, camping sites, freshwater fishing |
| Downtown Hillsboro | The central area offers local dining and shopping options, making it appealing to visitors wanting to experience local culture and cuisine. | local restaurants, craft shops, community events, art galleries, town square |
| Highland Scenic Highway | Scenic byway offering breathtaking views of the mountains and valleys. Perfect for road trippers and nature photographers looking for stunning vistas. | mountain views, jogging and cycling areas, campgrounds, picnic spots, scenic pull-offs |
| Watoga State Park | A large park with facilities for camping, hiking, and fishing. Attracts families and groups looking for an affordable outdoor retreat. | cabins and camping sites, fishing lakes, hiking trails, nature programs, wildlife observation |
| Tea Creek Campground | Secluded area perfect for camping enthusiasts, offering solitude and natural beauty. A great choice for travelers seeking quiet retreats in nature. | camping facilities, nature walks, wildlife spotting, hiking trails, fishing spots |
| Cherry River Waterfall | A picturesque waterfall location ideal for photography and nature appreciation. Appeals to visitors looking for scenic and tranquil spots. | waterfall views, hiking trails, nature photography, birdwatching, picnic areas |
Understanding Airbnb License Requirements & STR Laws in Hillsboro (2026)
While Hillsboro, West Virginia, United States currently shows low STR regulations, specific Airbnb license requirements might still exist or change. Always verify the latest short term rental regulations and Airbnb license requirements directly with local government authorities for Hillsboro to ensure full compliance before hosting.
(Source: AirROI data, 2026, finding no licensed listings among those analyzed)
Top Performing Airbnb Properties in Hillsboro (2026)
Benchmark your potential! Explore examples of top-performing Airbnb properties in Hillsborobased on Trailing Twelve Month (TTM) revenue. Analyze their characteristics, revenue, occupancy rate, and ADR to understand what drives success in this market.
Yew Mountain Center – Nature Sanctuary
Private Room • 6 bedrooms
Greenbrier River&Bike Trail ;Watoga Park,Fish,Hike
Entire Place • 4 bedrooms
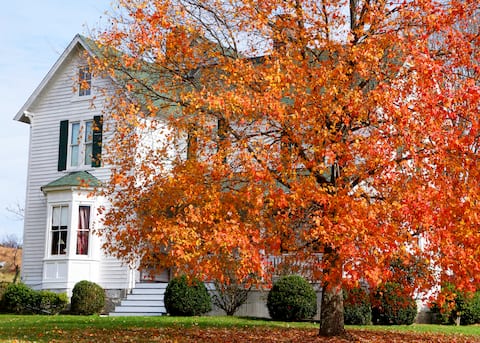
1890 Victorian Farmhouse
Entire Place • 3 bedrooms
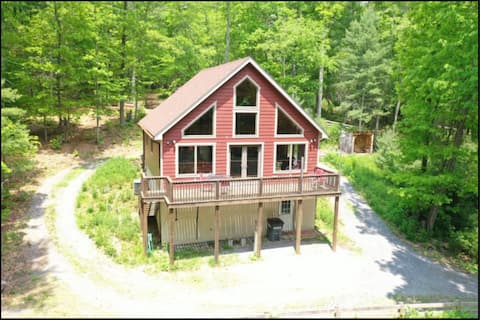
Hilltop Hideaway
Entire Place • 2 bedrooms

Cozy Farmhouse Perfect for Adventures & Relaxation
Entire Place • 4 bedrooms
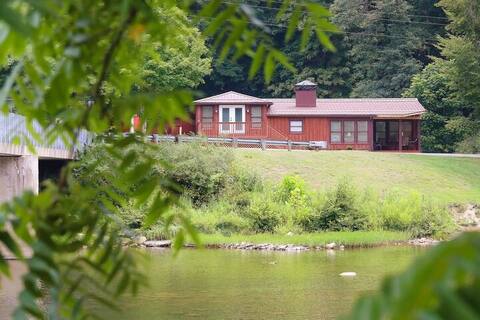
Entire house near the river!
Entire Place • 3 bedrooms
Note: Performance varies based on location, size, amenities, seasonality, and management quality. Data reflects the past 12 months.
Top Performing Airbnb Hosts in Hillsboro (2026)
Learn from the best! This table showcases top-performing Airbnb hosts in Hillsboro based on the number of properties managed and estimated total revenue over the past year. Analyze their scale and performance metrics.
| Host Name | Properties | Grossing Revenue | Stay Reviews | Avg Rating |
|---|---|---|---|---|
| Melanie | 11 | $209,004 | 406 | 4.91/5.0 |
| Nikki & Andrew | 1 | $74,695 | 82 | 4.90/5.0 |
| Marcie | 1 | $55,430 | 292 | 4.95/5.0 |
| Joshua | 1 | $37,974 | 163 | 4.94/5.0 |
| Debbie (And Nick) | 5 | $34,138 | 38 | 4.93/5.0 |
| Esther | 1 | $32,267 | 67 | 4.99/5.0 |
| Connor | 1 | $29,144 | 99 | 4.98/5.0 |
| Nicole | 2 | $18,302 | 212 | 4.84/5.0 |
| Robin | 1 | $17,040 | 47 | 4.96/5.0 |
| John | 1 | $11,605 | 21 | 5.00/5.0 |
Analyzing the strategies of top hosts, such as their property selection, pricing, and guest communication, can offer valuable lessons for optimizing your own Airbnb operations in Hillsboro.
Dive Deeper: Advanced Hillsboro STR Market Data (2026)
Ready to unlock more insights? AirROI provides access to advanced metrics and comprehensive Airbnb data for Hillsboro. Explore detailed analytics beyond this report to refine your investment strategy, optimize pricing, and maximize your vacation rental profits.
Explore Advanced MetricsHillsboro Short-Term Rental Market Composition (2026): Property & Room Types
Room Type Distribution
Property Type Distribution
Market Composition Insights for Hillsboro
- The Hillsboro Airbnb market composition is heavily skewed towards Entire Home/Apt listings, which make up 59.3% of the 27 active rentals. This indicates strong guest preference for privacy and space.
- However, a notable 40.7% share for Private Rooms suggests opportunities for budget-conscious travelers or hosts renting out spare rooms.
- Looking at the property type distribution in Hillsboro, Outdoor/Unique properties are the most common (51.9%), reflecting the local real estate landscape.
- Houses represent a significant 37% portion, catering likely to families or larger groups.
- Smaller segments like hotel/boutique (combined 3.7%) offer potential for unique stay experiences.
Hillsboro Airbnb Room Capacity Analysis (2026): Bedroom Distribution
Distribution of Listings by Number of Bedrooms
Room Capacity Insights for Hillsboro
- The dominant room capacity in Hillsboro is 1 bedroom listings, making up 33.3% of the market. This suggests a strong demand for properties suitable for couples or solo travelers.
- Together, 1 bedroom and 4 bedrooms properties represent 44.4% of the active Airbnb listings in Hillsboro, indicating a high concentration in these sizes.
- A significant 29.6% of listings offer 3+ bedrooms, catering to larger groups and families seeking more space in Hillsboro.
Hillsboro Vacation Rental Guest Capacity Trends (2026)
Distribution of Listings by Guest Capacity
Guest Capacity Insights for Hillsboro
- The most common guest capacity trend in Hillsboro vacation rentals is listings accommodating 8+ guests (22.2%). This suggests the primary traveler segment is likely larger groups.
- Properties designed for 8+ guests and 4 guests dominate the Hillsboro STR market, accounting for 40.7% of listings.
- 37.0% of properties accommodate 6+ guests, serving the market segment for larger families or group travel in Hillsboro.
- On average, properties in Hillsboro are equipped to host 4.3 guests.
Hillsboro Airbnb Booking Patterns (2026): Available vs. Booked Days
Available Days Distribution
Booked Days Distribution
Booking Pattern Insights for Hillsboro
- The most common availability pattern in Hillsboro falls within the 271-366 days range, representing 44.4% of listings. This suggests many properties have significant open periods on their calendars.
- Approximately 77.7% of listings show high availability (181+ days open annually), indicating potential for increased bookings or specific owner usage patterns.
- For booked days, the 31-90 days range is most frequent in Hillsboro (37%), reflecting common guest stay durations or potential owner blocking patterns.
- A notable 22.2% of properties secure long booking periods (181+ days booked per year), highlighting successful long-term rental strategies or significant owner usage.
Hillsboro Airbnb Minimum Stay Requirements Analysis
Distribution of Listings by Minimum Night Requirement
1 Night
14 listings
51.9% of total
2 Nights
5 listings
18.5% of total
3 Nights
1 listings
3.7% of total
30+ Nights
7 listings
25.9% of total
Key Insights
- The most prevalent minimum stay requirement in Hillsboro is 1 Night, adopted by 51.9% of listings. This highlights the market's preference for shorter, flexible bookings.
- A strong majority (70.4%) of the Hillsboro Airbnb data shows acceptance of very short stays (1-2 nights), indicating a dynamic, high-turnover market.
- A significant segment (25.9%) caters to monthly stays (30+ nights) in Hillsboro, pointing to opportunities in the extended-stay market.
Recommendations
- Align with the market by considering a 1 Night minimum stay, as 51.9% of Hillsboro hosts use this setting.
- Explore offering discounts for stays of 30+ nights to attract the 25.9% of the market seeking extended stays.
- Adjust minimum nights based on seasonality – potentially shorter during low season and longer during peak demand periods in Hillsboro.
Hillsboro Airbnb Cancellation Policy Trends Analysis (2026)
Limited
1 listings
3.7% of total
Flexible
10 listings
37% of total
Moderate
11 listings
40.7% of total
Firm
5 listings
18.5% of total
Cancellation Policy Insights for Hillsboro
- The prevailing Airbnb cancellation policy trend in Hillsboro is Moderate, used by 40.7% of listings.
- The market strongly favors guest-friendly terms, with 77.7% of listings offering Flexible or Moderate policies. This suggests guests in Hillsboro may expect booking flexibility.
Recommendations for Hosts
- Consider adopting a Moderate policy to align with the 40.7% market standard in Hillsboro.
- Regularly review your cancellation policy against competitors and market demand shifts in Hillsboro.
Hillsboro STR Booking Lead Time Analysis (2026)
Average Booking Lead Time by Month
Booking Lead Time Insights for Hillsboro
- The overall average booking lead time for vacation rentals in Hillsboro is 74 days.
- Guests book furthest in advance for stays during November (average 124 days), likely coinciding with peak travel demand or local events.
- The shortest booking windows occur for stays in March (average 15 days), indicating more last-minute travel plans during this time.
- Seasonally, Fall (92 days avg.) sees the longest lead times, while Winter (54 days avg.) has the shortest, reflecting typical travel planning cycles.
Recommendations for Hosts
- Use the overall average lead time (74 days) as a baseline for your pricing and availability strategy in Hillsboro.
- For November stays, consider implementing length-of-stay discounts or slightly higher rates for bookings made less than 124 days out to capitalize on advance planning.
- Target marketing efforts for the Fall season well in advance (at least 92 days) to capture early planners.
- Monitor your own booking lead times against these Hillsboro averages to identify opportunities for dynamic pricing adjustments.
Popular & Essential Airbnb Amenities in Hillsboro (2026)
Amenity Prevalence
Amenity Insights for Hillsboro
- Essential amenities in Hillsboro that guests expect include: Smoke alarm, Wifi, Free parking on premises, First aid kit. Lacking these (any) could significantly impact bookings.
- Popular amenities like Outdoor furniture, Fire extinguisher, Hot water are common but not universal. Offering these can provide a competitive edge.
Recommendations for Hosts
- Ensure your listing includes all essential amenities for Hillsboro: Smoke alarm, Wifi, Free parking on premises, First aid kit.
- Prioritize adding missing essentials: First aid kit.
- Consider adding popular differentiators like Outdoor furniture or Fire extinguisher to increase appeal.
- Highlight unique or less common amenities you offer (e.g., hot tub, dedicated workspace, EV charger) in your listing description and photos.
- Regularly check competitor amenities in Hillsboro to stay competitive.
Hillsboro Airbnb Guest Demographics & Profile Analysis (2026)
Guest Profile Summary for Hillsboro
- The typical guest profile for Airbnb in Hillsboro consists of primarily domestic travelers (94%), often arriving from nearby Charleston, typically belonging to the Post-2000s (Gen Z/Alpha) group (50%), primarily speaking English or Spanish.
- Domestic travelers account for 94.0% of guests.
- Key international markets include United States (94%) and DC (2.4%).
- Top languages spoken are English (66.7%) followed by Spanish (11.8%).
- A significant demographic segment is the Post-2000s (Gen Z/Alpha) group, representing 50% of guests.
Recommendations for Hosts
- Target domestic marketing efforts towards travelers from Charleston and Morgantown.
- Tailor amenities and listing descriptions to appeal to the dominant Post-2000s (Gen Z/Alpha) demographic (e.g., highlight fast WiFi, smart home features, local guides).
- Highlight unique local experiences or amenities relevant to the primary guest profile.
- Consider seasonal promotions aligned with peak travel times for key origin markets.
Nearby Short-Term Rental Market Comparison
How does the Hillsboro Airbnb market stack up against its neighbors? Compare key performance metrics like average monthly revenue, ADR, and occupancy rates in surrounding areas to understand the broader regional STR landscape.
| Market | Active Properties | Monthly Revenue | Daily Rate | Avg. Occupancy |
|---|---|---|---|---|
| Penhook | 18 | $5,675 | $678.75 | 37% |
| Rockbridge Baths | 12 | $4,144 | $298.35 | 45% |
| Blacksburg | 297 | $4,116 | $509.14 | 40% |
| Goodview | 31 | $3,953 | $401.90 | 44% |
| McHenry | 605 | $3,928 | $598.59 | 28% |
| Swanton | 250 | $3,870 | $639.77 | 30% |
| Victor | 21 | $3,854 | $450.02 | 33% |
| Garrett County | 11 | $3,848 | $705.84 | 24% |
| Hot Springs | 27 | $3,785 | $336.52 | 41% |
| Slaty Fork | 48 | $3,687 | $424.67 | 32% |