Charles Town Airbnb Market Analysis 2026: Short Term Rental Data & Vacation Rental Statistics in West Virginia, United States
Is Airbnb profitable in Charles Town in 2026? Explore comprehensive Airbnb analytics for Charles Town, West Virginia, United States to uncover income potential. This 2026 STR market report for Charles Town, based on AirROI data from February 2025 to January 2026, reveals key trends in the niche market of 45 active listings.
Whether you're considering an Airbnb investment in Charles Town, optimizing your existing vacation rental, or exploring rental arbitrage opportunities, understanding the Charles Town Airbnb data is crucial. Leveraging the low regulation environment is key to maximizing your short term rental income potential. Let's dive into the specifics.
Key Charles Town Airbnb Performance Metrics Overview
Monthly Airbnb Revenue Variations & Income Potential in Charles Town (2026)
Understanding the monthly revenue variations for Airbnb listings in Charles Town is key to maximizing your short term rental income potential. Seasonality significantly impacts earnings. Our analysis, based on data from the past 12 months, shows that the peak revenue month for STRs in Charles Town is typically August, while February often presents the lowest earnings, highlighting opportunities for strategic pricing adjustments during shoulder and low seasons. Explore the typical Airbnb income in Charles Town across different performance tiers:
- Best-in-class properties (Top 10%) achieve $8,153+ monthly, often utilizing dynamic pricing and superior guest experiences.
- Strong performing properties (Top 25%) earn $4,234 or more, indicating effective management and desirable locations/amenities.
- Typical properties (Median) generate around $1,842 per month, representing the average market performance.
- Entry-level properties (Bottom 25%) see earnings around $939, often with potential for optimization.
Average Monthly Airbnb Earnings Trend in Charles Town
Charles Town Airbnb Occupancy Rate Trends (2026)
Maximize your bookings by understanding the Charles Town STR occupancy trends. Seasonal demand shifts significantly influence how often properties are booked. Typically, Augustsees the highest demand (peak season occupancy), while February experiences the lowest (low season). Effective strategies, like adjusting minimum stays or offering promotions, can boost occupancy during slower periods. Here's how different property tiers perform in Charles Town:
- Best-in-class properties (Top 10%) achieve 72%+ occupancy, indicating high desirability and potentially optimized availability.
- Strong performing properties (Top 25%) maintain 51% or higher occupancy, suggesting good market fit and guest satisfaction.
- Typical properties (Median) have an occupancy rate around 36%.
- Entry-level properties (Bottom 25%) average 21% occupancy, potentially facing higher vacancy.
Average Monthly Occupancy Rate Trend in Charles Town
Average Daily Rate (ADR) Airbnb Trends in Charles Town (2026)
Effective short term rental pricing strategy in Charles Town involves understanding monthly ADR fluctuations. The Average Daily Rate (ADR) for Airbnb in Charles Town typically peaks in October and dips lowest during March. Leveraging Airbnb dynamic pricing tools or strategies based on this seasonality can significantly boost revenue. Here's a look at the typical nightly rates achieved:
- Best-in-class properties (Top 10%) command rates of $388+ per night, often due to premium features or locations.
- Strong performing properties (Top 25%) achieve nightly rates of $220 or more.
- Typical properties (Median) charge around $168 per night.
- Entry-level properties (Bottom 25%) earn around $107 per night.
Average Daily Rate (ADR) Trend by Month in Charles Town
Get Live Charles Town Market Intelligence 👇

Explore Real-time Analytics
Airbnb Seasonality Analysis & Trends in Charles Town (2026)
Peak Season (August, October, July)
- Revenue averages $4,660 per month
- Occupancy rates average 47.2%
- Daily rates average $238
Shoulder Season
- Revenue averages $3,407 per month
- Occupancy maintains around 37.0%
- Daily rates hold near $238
Low Season (February, March, April)
- Revenue drops to average $2,242 per month
- Occupancy decreases to average 33.0%
- Daily rates adjust to average $208
Seasonality Insights for Charles Town
- The Airbnb seasonality in Charles Town shows highly seasonal trends requiring careful strategy. While the sections above show seasonal averages, it's also insightful to look at the extremes:
- During the high season, the absolute peak month showcases Charles Town's highest earning potential, with monthly revenues capable of climbing to $4,911, occupancy reaching a high of 50.7%, and ADRs peaking at $250.
- Conversely, the slowest single month of the year, typically falling within the low season, marks the market's lowest point. In this month, revenue might dip to $1,762, occupancy could drop to 25.3%, and ADRs may adjust down to $205.
- Understanding both the seasonal averages and these monthly peaks and troughs in revenue, occupancy, and ADR is crucial for maximizing your Airbnb profit potential in Charles Town.
Seasonal Strategies for Maximizing Profit
- Peak Season: Maximize revenue through premium pricing and potentially longer minimum stays. Ensure high availability.
- Low Season: Offer competitive pricing, special promotions (e.g., extended stay discounts), and flexible cancellation policies. Target off-season travelers like remote workers or budget-conscious guests.
- Shoulder Seasons: Implement dynamic pricing that balances peak and low rates. Target weekend travelers or specific events. Offer slightly more flexible terms than peak season.
- Regularly analyze your own performance against these Charles Town seasonality benchmarks and adjust your pricing and availability strategy accordingly.
Best Areas for Airbnb Investment in Charles Town (2026)
Exploring the top neighborhoods for short-term rentals in Charles Town? This section highlights key areas, outlining why they are attractive for hosts and guests, along with notable local attractions. Consider these locations based on your target guest profile and investment strategy.
| Neighborhood / Area | Why Host Here? (Target Guests & Appeal) | Key Attractions & Landmarks |
|---|---|---|
| Historic Charles Town | Quaint historic district with charming architecture, local shops, and rich Civil War history. An appealing destination for history buffs and tourists seeking a unique experience. | Jefferson County Courthouse, Charles Town Ghost Tours, Old Opera House, West Virginia Lottery Place, Charles Town Races and Slots |
| Nearby Harpers Ferry | Popular for its stunning natural beauty and historic significance. Attracts outdoor enthusiasts and history lovers with opportunities for hiking, river activities, and Civil War history. | Harpers Ferry National Historical Park, Appalachian Trail, John Brown's Fort, Shenandoah River, Jefferson Rock |
| Berkeley Springs | Known for its historic mineral hot springs and artsy vibe. This nearby town attracts those looking for relaxation and spa retreats, making it a great spot for Airbnb hosting. | Berkeley Springs State Park, Glass Museum, Local Art Galleries, Hiking in Cacapon State Park, Spa services and mineral baths |
| Shepherdstown | Charming college town with a vibrant arts scene and historic downtown. Offers unique shops and eateries, appealing to visitors seeking a cultural experience. | Shepherd University, Cannon Hill, Shepherdstown Museum, Potomac River access, Historic downtown shops |
| Winchester, VA | A larger town just over the state line with a rich history, shopping, and dining options. It’s a popular choice for visitors exploring nearby West Virginia attractions. | Old Town Winchester, Shenandoah Valley Discovery Museum, Handley Regional Library, George Washington's Office Museum, Apple Blossom Mall |
| Shenandoah Valley | Renowned for its beautiful landscapes and wineries. Excellent for visitors who enjoy nature and want to explore local vineyards and farms. | Shenandoah National Park, Local wineries, Hiking trails, Scenic drives, Outdoor festivals |
| Front Royal, VA | Gateway to Shenandoah National Park, offering outdoor recreation. Attracts tourists looking to explore the national park and surrounding nature. | Front Royal Outdoors, Skyline Drive, Warren County Museum, Local restaurants, River tubing activities |
| West Virginia Wine Country | Increases in interest due to local wineries and vineyards. Perfect for wine enthusiasts and those seeking a scenic getaway. | Local wineries, Wine festivals, Scenic drives through the countryside, Gourmet dining experiences, Outdoor events |
Understanding Airbnb License Requirements & STR Laws in Charles Town (2026)
While Charles Town, West Virginia, United States currently shows low STR regulations, specific Airbnb license requirements might still exist or change. Always verify the latest short term rental regulations and Airbnb license requirements directly with local government authorities for Charles Town to ensure full compliance before hosting.
(Source: AirROI data, 2026, finding no licensed listings among those analyzed)
Top Performing Airbnb Properties in Charles Town (2026)
Benchmark your potential! Explore examples of top-performing Airbnb properties in Charles Townbased on Trailing Twelve Month (TTM) revenue. Analyze their characteristics, revenue, occupancy rate, and ADR to understand what drives success in this market.
Almost Heaven spacious retreat 15000sf hot tub
Entire Place • 16 bedrooms
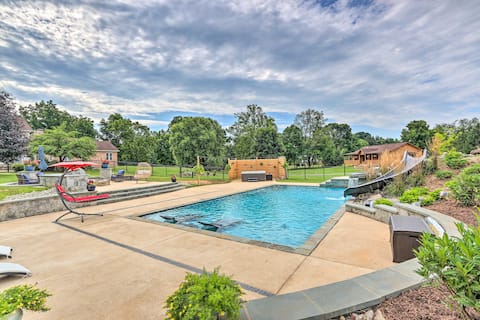
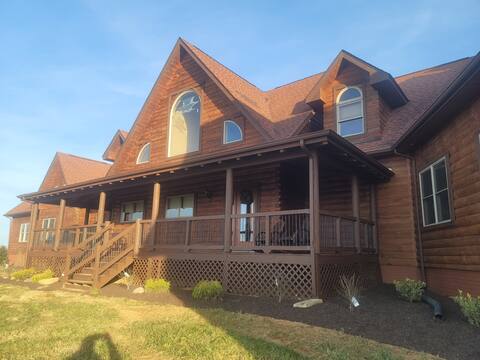
Charles Town Home w/ Private Pool & Hot Tub
Entire Place • 5 bedrooms

Stunning View, Riverfront Privacy, 18-Acre Estate!
Entire Place • 5 bedrooms

Riverside Royale near Harpers Ferry Hot Tub Sauna
Entire Place • 6 bedrooms

Terra Alta - Incredible River Views and Hot Tub!
Entire Place • 4 bedrooms

Vintage Riverfront Log Cabin “Emma” w/hot tub
Entire Place • 1 bedroom
Note: Performance varies based on location, size, amenities, seasonality, and management quality. Data reflects the past 12 months.
Top Performing Airbnb Hosts in Charles Town (2026)
Learn from the best! This table showcases top-performing Airbnb hosts in Charles Town based on the number of properties managed and estimated total revenue over the past year. Analyze their scale and performance metrics.
| Host Name | Properties | Grossing Revenue | Stay Reviews | Avg Rating |
|---|---|---|---|---|
| Evolve | 3 | $269,390 | 120 | 4.90/5.0 |
| Paul | 1 | $218,608 | 60 | 5.00/5.0 |
| Karen And Norm | 1 | $121,498 | 25 | 5.00/5.0 |
| Anna | 1 | $76,415 | 19 | 5.00/5.0 |
| Mountain Mama Vacation Homes | 1 | $71,186 | 287 | 4.82/5.0 |
| Abolitionist Ale Works | 5 | $63,665 | 955 | 4.63/5.0 |
| Dan Nelson | 1 | $60,118 | 246 | 4.98/5.0 |
| By Design Property Management | 4 | $58,220 | 365 | 4.74/5.0 |
| Liz | 2 | $58,084 | 162 | 4.95/5.0 |
| Becky | 1 | $57,314 | 41 | 4.98/5.0 |
Analyzing the strategies of top hosts, such as their property selection, pricing, and guest communication, can offer valuable lessons for optimizing your own Airbnb operations in Charles Town.
Dive Deeper: Advanced Charles Town STR Market Data (2026)
Ready to unlock more insights? AirROI provides access to advanced metrics and comprehensive Airbnb data for Charles Town. Explore detailed analytics beyond this report to refine your investment strategy, optimize pricing, and maximize your vacation rental profits.
Explore Advanced MetricsCharles Town Short-Term Rental Market Composition (2026): Property & Room Types
Room Type Distribution
Property Type Distribution
Market Composition Insights for Charles Town
- The Charles Town Airbnb market composition is heavily skewed towards Entire Home/Apt listings, which make up 80% of the 45 active rentals. This indicates strong guest preference for privacy and space.
- Looking at the property type distribution in Charles Town, House properties are the most common (48.9%), reflecting the local real estate landscape.
- Houses represent a significant 48.9% portion, catering likely to families or larger groups.
- The presence of 11.1% Hotel/Boutique listings indicates integration with traditional hospitality.
- Smaller segments like others (combined 2.2%) offer potential for unique stay experiences.
Charles Town Airbnb Room Capacity Analysis (2026): Bedroom Distribution
Distribution of Listings by Number of Bedrooms
Room Capacity Insights for Charles Town
- The dominant room capacity in Charles Town is 2 bedrooms listings, making up 33.3% of the market. This suggests a strong demand for properties suitable for couples or solo travelers.
- Together, 2 bedrooms and 1 bedroom properties represent 64.4% of the active Airbnb listings in Charles Town, indicating a high concentration in these sizes.
- A significant 28.9% of listings offer 3+ bedrooms, catering to larger groups and families seeking more space in Charles Town.
Charles Town Vacation Rental Guest Capacity Trends (2026)
Distribution of Listings by Guest Capacity
Guest Capacity Insights for Charles Town
- The most common guest capacity trend in Charles Town vacation rentals is listings accommodating 4 guests (26.7%). This suggests the primary traveler segment is likely small families or groups.
- Properties designed for 4 guests and 8+ guests dominate the Charles Town STR market, accounting for 46.7% of listings.
- 31.1% of properties accommodate 6+ guests, serving the market segment for larger families or group travel in Charles Town.
- On average, properties in Charles Town are equipped to host 4.3 guests.
Charles Town Airbnb Booking Patterns (2026): Available vs. Booked Days
Available Days Distribution
Booked Days Distribution
Booking Pattern Insights for Charles Town
- The most common availability pattern in Charles Town falls within the 271-366 days range, representing 44.4% of listings. This suggests many properties have significant open periods on their calendars.
- Approximately 86.6% of listings show high availability (181+ days open annually), indicating potential for increased bookings or specific owner usage patterns.
- For booked days, the 31-90 days range is most frequent in Charles Town (37.8%), reflecting common guest stay durations or potential owner blocking patterns.
- A notable 20.0% of properties secure long booking periods (181+ days booked per year), highlighting successful long-term rental strategies or significant owner usage.
Charles Town Airbnb Minimum Stay Requirements Analysis
Distribution of Listings by Minimum Night Requirement
1 Night
13 listings
28.9% of total
2 Nights
15 listings
33.3% of total
4-6 Nights
1 listings
2.2% of total
7-29 Nights
4 listings
8.9% of total
30+ Nights
12 listings
26.7% of total
Key Insights
- The most prevalent minimum stay requirement in Charles Town is 2 Nights, adopted by 33.3% of listings. This highlights the market's preference for shorter, flexible bookings.
- A strong majority (62.2%) of the Charles Town Airbnb data shows acceptance of very short stays (1-2 nights), indicating a dynamic, high-turnover market.
- A significant segment (26.7%) caters to monthly stays (30+ nights) in Charles Town, pointing to opportunities in the extended-stay market.
Recommendations
- Align with the market by considering a 2 Nights minimum stay, as 33.3% of Charles Town hosts use this setting.
- If feasible, allowing 1-night stays, especially midweek or during low season, could capture last-minute bookings, as only 28.9% currently do.
- Explore offering discounts for stays of 30+ nights to attract the 26.7% of the market seeking extended stays.
- Adjust minimum nights based on seasonality – potentially shorter during low season and longer during peak demand periods in Charles Town.
Charles Town Airbnb Cancellation Policy Trends Analysis (2026)
Limited
1 listings
2.2% of total
Flexible
8 listings
17.8% of total
Moderate
19 listings
42.2% of total
Firm
12 listings
26.7% of total
Strict
5 listings
11.1% of total
Cancellation Policy Insights for Charles Town
- The prevailing Airbnb cancellation policy trend in Charles Town is Moderate, used by 42.2% of listings.
- There's a relatively balanced mix between guest-friendly (60.0%) and stricter (37.8%) policies, offering choices for different guest needs.
Recommendations for Hosts
- Consider adopting a Moderate policy to align with the 42.2% market standard in Charles Town.
- Using a Strict policy might deter some guests, as only 11.1% of listings use it. Evaluate if potential revenue protection outweighs possible lower booking rates.
- Regularly review your cancellation policy against competitors and market demand shifts in Charles Town.
Charles Town STR Booking Lead Time Analysis (2026)
Average Booking Lead Time by Month
Booking Lead Time Insights for Charles Town
- The overall average booking lead time for vacation rentals in Charles Town is 38 days.
- Guests book furthest in advance for stays during August (average 54 days), likely coinciding with peak travel demand or local events.
- The shortest booking windows occur for stays in January (average 24 days), indicating more last-minute travel plans during this time.
- Seasonally, Summer (51 days avg.) sees the longest lead times, while Winter (36 days avg.) has the shortest, reflecting typical travel planning cycles.
Recommendations for Hosts
- Use the overall average lead time (38 days) as a baseline for your pricing and availability strategy in Charles Town.
- For August stays, consider implementing length-of-stay discounts or slightly higher rates for bookings made less than 54 days out to capitalize on advance planning.
- Target marketing efforts for the Summer season well in advance (at least 51 days) to capture early planners.
- Monitor your own booking lead times against these Charles Town averages to identify opportunities for dynamic pricing adjustments.
Popular & Essential Airbnb Amenities in Charles Town (2026)
Amenity Prevalence
Amenity Insights for Charles Town
- Essential amenities in Charles Town that guests expect include: Wifi, Heating, Air conditioning, Smoke alarm, Hot water, Bed linens, Essentials. Lacking these (any) could significantly impact bookings.
- Popular amenities like Hangers, Dishes and silverware, Refrigerator are common but not universal. Offering these can provide a competitive edge.
Recommendations for Hosts
- Ensure your listing includes all essential amenities for Charles Town: Wifi, Heating, Air conditioning, Smoke alarm, Hot water, Bed linens, Essentials.
- Prioritize adding missing essentials: Air conditioning, Smoke alarm, Hot water, Bed linens, Essentials.
- Consider adding popular differentiators like Hangers or Dishes and silverware to increase appeal.
- Highlight unique or less common amenities you offer (e.g., hot tub, dedicated workspace, EV charger) in your listing description and photos.
- Regularly check competitor amenities in Charles Town to stay competitive.
Charles Town Airbnb Guest Demographics & Profile Analysis (2026)
Guest Profile Summary for Charles Town
- The typical guest profile for Airbnb in Charles Town consists of primarily domestic travelers (92%), often arriving from nearby Washington, typically belonging to the Post-2000s (Gen Z/Alpha) group (50%), primarily speaking English or Spanish.
- Domestic travelers account for 92.3% of guests.
- Key international markets include United States (92.3%) and DC (5.1%).
- Top languages spoken are English (70.9%) followed by Spanish (13.1%).
- A significant demographic segment is the Post-2000s (Gen Z/Alpha) group, representing 50% of guests.
Recommendations for Hosts
- Target domestic marketing efforts towards travelers from Washington and Pittsburgh.
- Tailor amenities and listing descriptions to appeal to the dominant Post-2000s (Gen Z/Alpha) demographic (e.g., highlight fast WiFi, smart home features, local guides).
- Highlight unique local experiences or amenities relevant to the primary guest profile.
- Consider seasonal promotions aligned with peak travel times for key origin markets.
Nearby Short-Term Rental Market Comparison
How does the Charles Town Airbnb market stack up against its neighbors? Compare key performance metrics like average monthly revenue, ADR, and occupancy rates in surrounding areas to understand the broader regional STR landscape.
| Market | Active Properties | Monthly Revenue | Daily Rate | Avg. Occupancy |
|---|---|---|---|---|
| Polk Township | 15 | $6,974 | $520.26 | 38% |
| Lemont | 21 | $6,940 | $873.93 | 37% |
| College Township | 83 | $6,551 | $848.63 | 36% |
| Centreville | 17 | $6,298 | $565.66 | 45% |
| McGaheysville | 83 | $6,156 | $431.72 | 45% |
| State College | 192 | $6,081 | $712.29 | 40% |
| Mayo | 13 | $5,915 | $447.58 | 51% |
| Shannondale | 45 | $5,808 | $337.30 | 54% |
| Hellam Township | 24 | $5,496 | $386.69 | 45% |
| Stevensville | 80 | $5,412 | $556.79 | 41% |