Sultan Airbnb Market Analysis 2025: Short Term Rental Data & Vacation Rental Statistics in Washington, United States
Is Airbnb profitable in Sultan in 2025? Explore comprehensive Airbnb analytics for Sultan, Washington, United States to uncover income potential. This 2025 STR market report for Sultan, based on AirROI data from April 2024 to March 2025, reveals key trends in the niche market of 17 active listings.
Whether you're considering an Airbnb investment in Sultan, optimizing your existing vacation rental, or exploring rental arbitrage opportunities, understanding the Sultan Airbnb data is crucial. Leveraging the low regulation environment is key to maximizing your short term rental income potential. Let's dive into the specifics.
Key Sultan Airbnb Performance Metrics Overview
Monthly Airbnb Revenue Variations & Income Potential in Sultan (2025)
Understanding the monthly revenue variations for Airbnb listings in Sultan is key to maximizing your short term rental income potential. Seasonality significantly impacts earnings. Our analysis, based on data from the past 12 months, shows that the peak revenue month for STRs in Sultan is typically June, while March often presents the lowest earnings, highlighting opportunities for strategic pricing adjustments during shoulder and low seasons. Explore the typical Airbnb income in Sultan across different performance tiers:
- Best-in-class properties (Top 10%) achieve $9,153+ monthly, often utilizing dynamic pricing and superior guest experiences.
- Strong performing properties (Top 25%) earn $7,224 or more, indicating effective management and desirable locations/amenities.
- Typical properties (Median) generate around $3,982 per month, representing the average market performance.
- Entry-level properties (Bottom 25%) see earnings around $2,222, often with potential for optimization.
Average Monthly Airbnb Earnings Trend in Sultan
Sultan Airbnb Occupancy Rate Trends (2025)
Maximize your bookings by understanding the Sultan STR occupancy trends. Seasonal demand shifts significantly influence how often properties are booked. Typically, Septembersees the highest demand (peak season occupancy), while January experiences the lowest (low season). Effective strategies, like adjusting minimum stays or offering promotions, can boost occupancy during slower periods. Here's how different property tiers perform in Sultan:
- Best-in-class properties (Top 10%) achieve 87%+ occupancy, indicating high desirability and potentially optimized availability.
- Strong performing properties (Top 25%) maintain 76% or higher occupancy, suggesting good market fit and guest satisfaction.
- Typical properties (Median) have an occupancy rate around 50%.
- Entry-level properties (Bottom 25%) average 26% occupancy, potentially facing higher vacancy.
Average Monthly Occupancy Rate Trend in Sultan
Average Daily Rate (ADR) Airbnb Trends in Sultan (2025)
Effective short term rental pricing strategy in Sultan involves understanding monthly ADR fluctuations. The Average Daily Rate (ADR) for Airbnb in Sultan typically peaks in August and dips lowest during March. Leveraging Airbnb dynamic pricing tools or strategies based on this seasonality can significantly boost revenue. Here's a look at the typical nightly rates achieved:
- Best-in-class properties (Top 10%) command rates of $411+ per night, often due to premium features or locations.
- Strong performing properties (Top 25%) achieve nightly rates of $324 or more.
- Typical properties (Median) charge around $212 per night.
- Entry-level properties (Bottom 25%) earn around $167 per night.
Average Daily Rate (ADR) Trend by Month in Sultan
Get Live Sultan Market Intelligence 👇

Explore Real-time Analytics
Airbnb Seasonality Analysis & Trends in Sultan (2025)
Peak Season (June, May, April)
- Revenue averages $6,524 per month
- Occupancy rates average 59.7%
- Daily rates average $251
Shoulder Season
- Revenue averages $4,675 per month
- Occupancy maintains around 54.3%
- Daily rates hold near $254
Low Season (February, March, October)
- Revenue drops to average $3,346 per month
- Occupancy decreases to average 41.7%
- Daily rates adjust to average $243
Seasonality Insights for Sultan
- The Airbnb seasonality in Sultan shows highly seasonal trends requiring careful strategy. While the sections above show seasonal averages, it's also insightful to look at the extremes:
- During the high season, the absolute peak month showcases Sultan's highest earning potential, with monthly revenues capable of climbing to $6,908, occupancy reaching a high of 65.5%, and ADRs peaking at $263.
- Conversely, the slowest single month of the year, typically falling within the low season, marks the market's lowest point. In this month, revenue might dip to $3,117, occupancy could drop to 39.9%, and ADRs may adjust down to $237.
- Understanding both the seasonal averages and these monthly peaks and troughs in revenue, occupancy, and ADR is crucial for maximizing your Airbnb profit potential in Sultan.
Seasonal Strategies for Maximizing Profit
- Peak Season: Maximize revenue through premium pricing and potentially longer minimum stays. Ensure high availability.
- Low Season: Offer competitive pricing, special promotions (e.g., extended stay discounts), and flexible cancellation policies. Target off-season travelers like remote workers or budget-conscious guests.
- Shoulder Seasons: Implement dynamic pricing that balances peak and low rates. Target weekend travelers or specific events. Offer slightly more flexible terms than peak season.
- Regularly analyze your own performance against these Sultan seasonality benchmarks and adjust your pricing and availability strategy accordingly.
Best Areas for Airbnb Investment in Sultan (2025)
Exploring the top neighborhoods for short-term rentals in Sultan? This section highlights key areas, outlining why they are attractive for hosts and guests, along with notable local attractions. Consider these locations based on your target guest profile and investment strategy.
| Neighborhood / Area | Why Host Here? (Target Guests & Appeal) | Key Attractions & Landmarks |
|---|---|---|
| Snoqualmie Pass | A beautiful spot for year-round outdoor activities including skiing in the winter and hiking in the summer. Popular with tourists looking for nature and adventure. | Snoqualmie Ski Resort, Mount Si Trailhead, Twin Falls State Park, Rattlesnake Ridge, Snoqualmie Falls |
| Lake Tapps | A scenic lake area popular for water recreation and outdoor events. Ideal for families and groups looking to relax by the water during summer months. | Lake Tapps Park, Boating and fishing on Lake Tapps, Waterfront restaurants, Picnic areas, Kayaking |
| Tacoma | A vibrant city with a rich cultural scene, including museums and waterfront attractions. Great location for urban explorers looking for local experiences. | Museum of Glass, Point Defiance Park, LeMay - America’s Car Museum, Tacoma Art Museum, Woodland Park Zoo |
| Bonney Lake | Family-friendly area with access to parks and natural beauty, ideal for those looking for a quieter getaway. | Bonney Lake Park, Lake Bonney, Pine Lake Park, Pine Lake Trail, Nearby golf courses |
| Steilacoom | Historic waterfront town with charming streets and close proximity to the Puget Sound, offering a quaint escape near major attractions. | Steilacoom Historical Museum, Chambers Creek Regional Park, Washington State Ferries, Puget Sound views, Farmer's Market |
| Puyallup | Known for its agricultural heritage and community events, this area hosts the Washington State Fair and offers a family-friendly atmosphere. | Puyallup Fairgrounds, Pioneer Park, Lake Puyallup, Wild Waves Theme Park, Puyallup River |
| Enumclaw | Gateway to Mount Rainier National Park, making it a fantastic location for nature lovers and outdoor enthusiasts year-round. | Mount Rainier National Park, Enumclaw Expo Center, White River, local breweries, hiking trails |
| Sumner | A charming city in the Puyallup Valley with a friendly atmosphere and beautiful parks, appealing for visitors looking for a local community feel. | Sumner Historical Society, Lakeside Park, Pine Park, local dining and shops, Sumner Daffodil Parade |
Understanding Airbnb License Requirements & STR Laws in Sultan (2025)
While Sultan, Washington, United States currently shows low STR regulations, specific Airbnb license requirements might still exist or change. Always verify the latest short term rental regulations and Airbnb license requirements directly with local government authorities for Sultan to ensure full compliance before hosting.
(Source: AirROI data, 2025, finding no licensed listings among those analyzed)
Top Performing Airbnb Properties in Sultan (2025)
Benchmark your potential! Explore examples of top-performing Airbnb properties in Sultanbased on Trailing Twelve Month (TTM) revenue. Analyze their characteristics, revenue, occupancy rate, and ADR to understand what drives success in this market.

Sky Valley GeoDomes | Huge Views + Hot Tub
Entire Place • 1 bedroom

Rustic-Modern Cabin | Big Views + Barrel Sauna
Entire Place • 2 bedrooms
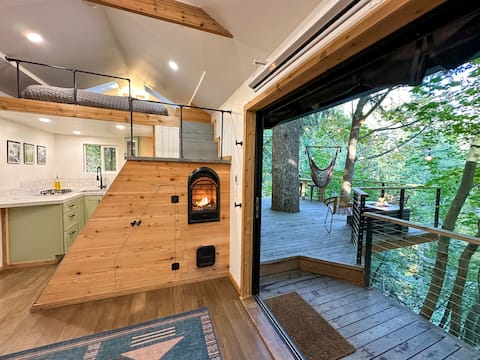
Bear Creek Treehouse | Hot Tub + Private Creek
Entire Place • 1 bedroom
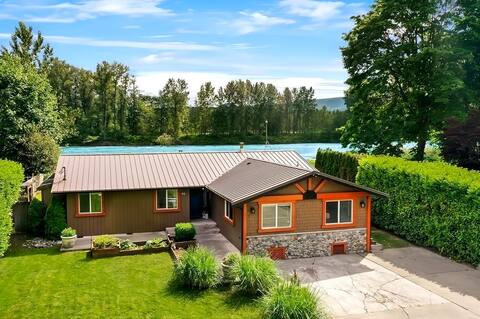
Riverfront Oasis on WA's Skykomish River
Entire Place • 3 bedrooms

A cozy riverside cabin in the mountains
Entire Place • 2 bedrooms

Tony's Riverside Oasis
Entire Place • 2 bedrooms
Note: Performance varies based on location, size, amenities, seasonality, and management quality. Data reflects the past 12 months.
Top Performing Airbnb Hosts in Sultan (2025)
Learn from the best! This table showcases top-performing Airbnb hosts in Sultan based on the number of properties managed and estimated total revenue over the past year. Analyze their scale and performance metrics.
| Host Name | Properties | Grossing Revenue | Stay Reviews | Avg Rating |
|---|---|---|---|---|
| Jonathan | 3 | $309,588 | 646 | 4.93/5.0 |
| Sarah | 1 | $61,227 | 99 | 4.83/5.0 |
| Chelsea | 1 | $58,158 | 53 | 5.00/5.0 |
| Tony | 1 | $52,346 | 45 | 5.00/5.0 |
| Erin | 1 | $50,564 | 34 | 4.94/5.0 |
| Evolve | 1 | $50,165 | 11 | 4.64/5.0 |
| Vacasa Western Washington | 1 | $37,289 | 89 | 4.22/5.0 |
| Host #446538637 | 1 | $36,756 | 3 | 4.67/5.0 |
| Jennifer | 1 | $35,698 | 185 | 4.97/5.0 |
| Host #104834083 | 1 | $30,596 | 86 | 4.83/5.0 |
Analyzing the strategies of top hosts, such as their property selection, pricing, and guest communication, can offer valuable lessons for optimizing your own Airbnb operations in Sultan.
Dive Deeper: Advanced Sultan STR Market Data (2025)
Ready to unlock more insights? AirROI provides access to advanced metrics and comprehensive Airbnb data for Sultan. Explore detailed analytics beyond this report to refine your investment strategy, optimize pricing, and maximize your vacation rental profits.
Explore Advanced MetricsSultan Short-Term Rental Market Composition (2025): Property & Room Types
Room Type Distribution
Property Type Distribution
Market Composition Insights for Sultan
- The Sultan Airbnb market composition is heavily skewed towards Entire Home/Apt listings, which make up 100% of the 17 active rentals. This indicates strong guest preference for privacy and space.
- Looking at the property type distribution in Sultan, House properties are the most common (47.1%), reflecting the local real estate landscape.
- Houses represent a significant 47.1% portion, catering likely to families or larger groups.
- The presence of 5.9% Hotel/Boutique listings indicates integration with traditional hospitality.
Sultan Airbnb Room Capacity Analysis (2025): Bedroom Distribution
Distribution of Listings by Number of Bedrooms
Room Capacity Insights for Sultan
- The dominant room capacity in Sultan is 2 bedrooms listings, making up 35.3% of the market. This suggests a strong demand for properties suitable for couples or solo travelers.
- Together, 2 bedrooms and 3 bedrooms properties represent 64.7% of the active Airbnb listings in Sultan, indicating a high concentration in these sizes.
- A significant 41.2% of listings offer 3+ bedrooms, catering to larger groups and families seeking more space in Sultan.
Sultan Vacation Rental Guest Capacity Trends (2025)
Distribution of Listings by Guest Capacity
Guest Capacity Insights for Sultan
- The most common guest capacity trend in Sultan vacation rentals is listings accommodating 4 guests (35.3%). This suggests the primary traveler segment is likely small families or groups.
- Properties designed for 4 guests and 8+ guests dominate the Sultan STR market, accounting for 58.8% of listings.
- 52.9% of properties accommodate 6+ guests, serving the market segment for larger families or group travel in Sultan.
- On average, properties in Sultan are equipped to host 5.4 guests.
Sultan Airbnb Booking Patterns (2025): Available vs. Booked Days
Available Days Distribution
Booked Days Distribution
Booking Pattern Insights for Sultan
- The most common availability pattern in Sultan falls within the 181-270 days range, representing 29.4% of listings. This suggests many properties have significant open periods on their calendars.
- Approximately 52.9% of listings show high availability (181+ days open annually), indicating potential for increased bookings or specific owner usage patterns.
- For booked days, the 91-180 days range is most frequent in Sultan (29.4%), reflecting common guest stay durations or potential owner blocking patterns.
- A notable 47.0% of properties secure long booking periods (181+ days booked per year), highlighting successful long-term rental strategies or significant owner usage.
Sultan Airbnb Minimum Stay Requirements Analysis
Distribution of Listings by Minimum Night Requirement
1 Night
1 listings
7.1% of total
2 Nights
8 listings
57.1% of total
4-6 Nights
1 listings
7.1% of total
30+ Nights
4 listings
28.6% of total
Key Insights
- The most prevalent minimum stay requirement in Sultan is 2 Nights, adopted by 57.1% of listings. This highlights the market's preference for shorter, flexible bookings.
- A strong majority (64.2%) of the Sultan Airbnb data shows acceptance of very short stays (1-2 nights), indicating a dynamic, high-turnover market.
- A significant segment (28.6%) caters to monthly stays (30+ nights) in Sultan, pointing to opportunities in the extended-stay market.
Recommendations
- Align with the market by considering a 2 Nights minimum stay, as 57.1% of Sultan hosts use this setting.
- If feasible, allowing 1-night stays, especially midweek or during low season, could capture last-minute bookings, as only 7.1% currently do.
- A 2-night minimum appears standard (57.1%). Consider this for weekends or peak periods.
- Explore offering discounts for stays of 30+ nights to attract the 28.6% of the market seeking extended stays.
- Adjust minimum nights based on seasonality – potentially shorter during low season and longer during peak demand periods in Sultan.
Sultan Airbnb Cancellation Policy Trends Analysis (2025)
Super Strict 30 Days
1 listings
7.1% of total
Flexible
2 listings
14.3% of total
Moderate
3 listings
21.4% of total
Firm
6 listings
42.9% of total
Strict
2 listings
14.3% of total
Cancellation Policy Insights for Sultan
- The prevailing Airbnb cancellation policy trend in Sultan is Firm, used by 42.9% of listings.
- A majority (57.2%) of hosts in Sultan utilize Firm or Strict policies, indicating a market where hosts prioritize booking security.
Recommendations for Hosts
- Consider adopting a Firm policy to align with the 42.9% market standard in Sultan.
- Using a Strict policy might deter some guests, as only 14.3% of listings use it. Evaluate if potential revenue protection outweighs possible lower booking rates.
- Regularly review your cancellation policy against competitors and market demand shifts in Sultan.
Sultan STR Booking Lead Time Analysis (2025)
Average Booking Lead Time by Month
Booking Lead Time Insights for Sultan
- The overall average booking lead time for vacation rentals in Sultan is 49 days.
- Guests book furthest in advance for stays during July (average 84 days), likely coinciding with peak travel demand or local events.
- The shortest booking windows occur for stays in March (average 25 days), indicating more last-minute travel plans during this time.
- Seasonally, Summer (74 days avg.) sees the longest lead times, while Winter (38 days avg.) has the shortest, reflecting typical travel planning cycles.
Recommendations for Hosts
- Use the overall average lead time (49 days) as a baseline for your pricing and availability strategy in Sultan.
- For July stays, consider implementing length-of-stay discounts or slightly higher rates for bookings made less than 84 days out to capitalize on advance planning.
- Target marketing efforts for the Summer season well in advance (at least 74 days) to capture early planners.
- Monitor your own booking lead times against these Sultan averages to identify opportunities for dynamic pricing adjustments.
Popular & Essential Airbnb Amenities in Sultan (2025)
Amenity Prevalence
No amenities with partial availability (less than 100%) were found to display in the chart. All essential amenities might be present in all listings. Check insights below.
Amenity Insights for Sultan
- Essential amenities in Sultan that guests expect include: Wifi, Dishes and silverware, Refrigerator, Hot water, Free parking on premises, Kitchen, Coffee maker, Heating, Smoke alarm, TV. Lacking these (any) could significantly impact bookings.
Recommendations for Hosts
- Ensure your listing includes all essential amenities for Sultan: Wifi, Dishes and silverware, Refrigerator, Hot water, Free parking on premises, Kitchen, Coffee maker, Heating, Smoke alarm, TV.
- Highlight unique or less common amenities you offer (e.g., hot tub, dedicated workspace, EV charger) in your listing description and photos.
- Regularly check competitor amenities in Sultan to stay competitive.
Sultan Airbnb Guest Demographics & Profile Analysis (2025)
Guest Profile Summary for Sultan
- The typical guest profile for Airbnb in Sultan consists of primarily domestic travelers (96%), often arriving from nearby Seattle, typically belonging to the Post-2000s (Gen Z/Alpha) group (50%), primarily speaking English or Spanish.
- Domestic travelers account for 96.3% of guests.
- Key international markets include United States (96.3%) and Canada (2%).
- Top languages spoken are English (72.8%) followed by Spanish (11.4%).
- A significant demographic segment is the Post-2000s (Gen Z/Alpha) group, representing 50% of guests.
Recommendations for Hosts
- Target domestic marketing efforts towards travelers from Seattle and Portland.
- Tailor amenities and listing descriptions to appeal to the dominant Post-2000s (Gen Z/Alpha) demographic (e.g., highlight fast WiFi, smart home features, local guides).
- Highlight unique local experiences or amenities relevant to the primary guest profile.
- Consider seasonal promotions aligned with peak travel times for key origin markets.
Nearby Short-Term Rental Market Comparison
How does the Sultan Airbnb market stack up against its neighbors? Compare key performance metrics like average monthly revenue, ADR, and occupancy rates in surrounding areas to understand the broader regional STR landscape.
| Market | Active Properties | Monthly Revenue | Daily Rate | Avg. Occupancy |
|---|---|---|---|---|
| Canyon Creek | 10 | $6,420 | $303.37 | 59% |
| Erlands Point-Kitsap Lake | 11 | $6,325 | $353.76 | 56% |
| Peshastin | 30 | $5,636 | $385.34 | 48% |
| Cle Elum | 411 | $5,632 | $540.36 | 36% |
| Plain | 47 | $5,614 | $359.35 | 50% |
| Orondo | 25 | $5,479 | $419.40 | 45% |
| Kittitas County | 12 | $5,182 | $914.40 | 30% |
| Lake Goodwin | 11 | $4,949 | $371.43 | 44% |
| Woods Creek | 10 | $4,871 | $352.24 | 40% |
| North Bend | 51 | $4,813 | $316.86 | 62% |