Williamsburg Airbnb Market Analysis 2026: Short Term Rental Data & Vacation Rental Statistics in Virginia, United States
Is Airbnb profitable in Williamsburg in 2026? Explore comprehensive Airbnb analytics for Williamsburg, Virginia, United States to uncover income potential. This 2026 STR market report for Williamsburg, based on AirROI data from February 2025 to January 2026, reveals key trends in the bustling market of 1,162 active listings.
Whether you're considering an Airbnb investment in Williamsburg, optimizing your existing vacation rental, or exploring rental arbitrage opportunities, understanding the Williamsburg Airbnb data is crucial. Leveraging the low regulation environment is key to maximizing your short term rental income potential. Let's dive into the specifics.
Key Williamsburg Airbnb Performance Metrics Overview
Monthly Airbnb Revenue Variations & Income Potential in Williamsburg (2026)
Understanding the monthly revenue variations for Airbnb listings in Williamsburg is key to maximizing your short term rental income potential. Seasonality significantly impacts earnings. Our analysis, based on data from the past 12 months, shows that the peak revenue month for STRs in Williamsburg is typically July, while January often presents the lowest earnings, highlighting opportunities for strategic pricing adjustments during shoulder and low seasons. Explore the typical Airbnb income in Williamsburg across different performance tiers:
- Best-in-class properties (Top 10%) achieve $4,486+ monthly, often utilizing dynamic pricing and superior guest experiences.
- Strong performing properties (Top 25%) earn $2,755 or more, indicating effective management and desirable locations/amenities.
- Typical properties (Median) generate around $1,405 per month, representing the average market performance.
- Entry-level properties (Bottom 25%) see earnings around $643, often with potential for optimization.
Average Monthly Airbnb Earnings Trend in Williamsburg
Williamsburg Airbnb Occupancy Rate Trends (2026)
Maximize your bookings by understanding the Williamsburg STR occupancy trends. Seasonal demand shifts significantly influence how often properties are booked. Typically, Julysees the highest demand (peak season occupancy), while January experiences the lowest (low season). Effective strategies, like adjusting minimum stays or offering promotions, can boost occupancy during slower periods. Here's how different property tiers perform in Williamsburg:
- Best-in-class properties (Top 10%) achieve 64%+ occupancy, indicating high desirability and potentially optimized availability.
- Strong performing properties (Top 25%) maintain 42% or higher occupancy, suggesting good market fit and guest satisfaction.
- Typical properties (Median) have an occupancy rate around 22%.
- Entry-level properties (Bottom 25%) average 11% occupancy, potentially facing higher vacancy.
Average Monthly Occupancy Rate Trend in Williamsburg
Average Daily Rate (ADR) Airbnb Trends in Williamsburg (2026)
Effective short term rental pricing strategy in Williamsburg involves understanding monthly ADR fluctuations. The Average Daily Rate (ADR) for Airbnb in Williamsburg typically peaks in July and dips lowest during February. Leveraging Airbnb dynamic pricing tools or strategies based on this seasonality can significantly boost revenue. Here's a look at the typical nightly rates achieved:
- Best-in-class properties (Top 10%) command rates of $353+ per night, often due to premium features or locations.
- Strong performing properties (Top 25%) achieve nightly rates of $252 or more.
- Typical properties (Median) charge around $187 per night.
- Entry-level properties (Bottom 25%) earn around $143 per night.
Average Daily Rate (ADR) Trend by Month in Williamsburg
Get Live Williamsburg Market Intelligence 👇

Explore Real-time Analytics
Airbnb Seasonality Analysis & Trends in Williamsburg (2026)
Peak Season (July, August, June)
- Revenue averages $2,726 per month
- Occupancy rates average 35.6%
- Daily rates average $232
Shoulder Season
- Revenue averages $1,988 per month
- Occupancy maintains around 29.4%
- Daily rates hold near $216
Low Season (January, February, November)
- Revenue drops to average $1,392 per month
- Occupancy decreases to average 21.8%
- Daily rates adjust to average $209
Seasonality Insights for Williamsburg
- The Airbnb seasonality in Williamsburg shows highly seasonal trends requiring careful strategy. While the sections above show seasonal averages, it's also insightful to look at the extremes:
- During the high season, the absolute peak month showcases Williamsburg's highest earning potential, with monthly revenues capable of climbing to $2,960, occupancy reaching a high of 37.2%, and ADRs peaking at $236.
- Conversely, the slowest single month of the year, typically falling within the low season, marks the market's lowest point. In this month, revenue might dip to $1,214, occupancy could drop to 18.8%, and ADRs may adjust down to $190.
- Understanding both the seasonal averages and these monthly peaks and troughs in revenue, occupancy, and ADR is crucial for maximizing your Airbnb profit potential in Williamsburg.
Seasonal Strategies for Maximizing Profit
- Peak Season: Maximize revenue through premium pricing and potentially longer minimum stays. Ensure high availability.
- Low Season: Offer competitive pricing, special promotions (e.g., extended stay discounts), and flexible cancellation policies. Target off-season travelers like remote workers or budget-conscious guests.
- Shoulder Seasons: Implement dynamic pricing that balances peak and low rates. Target weekend travelers or specific events. Offer slightly more flexible terms than peak season.
- Regularly analyze your own performance against these Williamsburg seasonality benchmarks and adjust your pricing and availability strategy accordingly.
Best Areas for Airbnb Investment in Williamsburg (2026)
Exploring the top neighborhoods for short-term rentals in Williamsburg? This section highlights key areas, outlining why they are attractive for hosts and guests, along with notable local attractions. Consider these locations based on your target guest profile and investment strategy.
| Neighborhood / Area | Why Host Here? (Target Guests & Appeal) | Key Attractions & Landmarks |
|---|---|---|
| Historic District | Rich in colonial history with charming architecture and proximity to historical sites. This area attracts tourists visiting Jamestown and Colonial Williamsburg. | Colonial Williamsburg, Bruton Parish Church, Governor's Palace, Abigail Adams House, DeWitt Wallace Decorative Arts Museum |
| Lake Matoaka | A scenic area with access to a beautiful lake and outdoor activities. Popular among families and nature lovers seeking a peaceful retreat. | Lake Matoaka, William & Mary Campus, Matoaka Natural Area, Outdoor Recreation Trails, Bird Watching |
| New Town | A modern development that offers shopping, dining, and entertainment options. Attractive to families and vacationers looking for convenience and amenities. | New Town Williamsburg, Shopping Centers, Restaurants, Movie Theaters, Parks |
| High Street | A burgeoning area filled with restaurants, cafes, and shops that appeal to a younger demographic eager to explore local culture and cuisine. | Brickhouse Tavern, Cheese Shop, The College of William & Mary, Local Art Galleries, Food and Wine Events |
| York River State Park | Ideal for nature enthusiasts and outdoor lovers, this park offers hiking, birdwatching, and unparalleled views of the York River. | York River, Hiking Trails, Wildlife Viewing, Kayaking Opportunities, Picnic Areas |
| Jamestown | Home to the historic Jamestown Settlement, this area attracts history buffs and school groups. Ideal for rentals focused on education and family experiences. | Jamestown Settlement, Historic Jamestowne, Archaeological Sites, Virginia State Parks, Outdoor Exhibits |
| James City County | A residential area close to Williamsburg, perfect for families seeking a quiet atmosphere while still being near attractions. Good for long-term rentals. | Colonial Parkway, Natural Bridge, Local Parks, Family-Friendly Activities, Community Events |
| Busch Gardens | One of the top tourist destinations in the area, appealing to families and thrill-seekers in the peak tourist season. | Busch Gardens Williamsburg, Water Country USA, Amusement Rides, Live Entertainment, Seasonal Events |
Understanding Airbnb License Requirements & STR Laws in Williamsburg (2026)
While Williamsburg, Virginia, United States currently shows low STR regulations, specific Airbnb license requirements might still exist or change. Always verify the latest short term rental regulations and Airbnb license requirements directly with local government authorities for Williamsburg to ensure full compliance before hosting.
(Source: AirROI data, 2026, finding no licensed listings among those analyzed)
Top Performing Airbnb Properties in Williamsburg (2026)
Benchmark your potential! Explore examples of top-performing Airbnb properties in Williamsburgbased on Trailing Twelve Month (TTM) revenue. Analyze their characteristics, revenue, occupancy rate, and ADR to understand what drives success in this market.
6BR Ultimate Family Getaway!
Entire Place • 6 bedrooms
History Art and Nature-110 Acres of Ancient Forest
Entire Place • 5 bedrooms
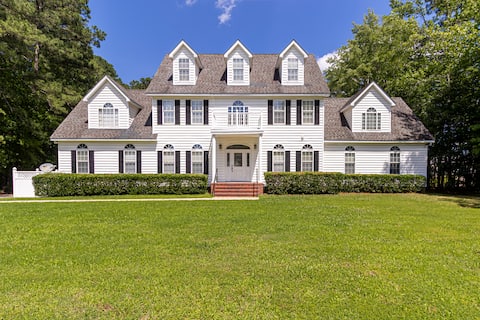
Spacious Home - 5 bedrooms & 3 full bathrooms.
Entire Place • 5 bedrooms

Cozy Elegance•sleeps 12•3 full baths•8 beds
Entire Place • 5 bedrooms

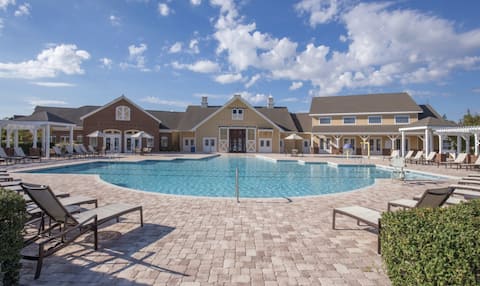
6BDR Williamsburg, VA Resort
Entire Place • 6 bedrooms
Wyndham Governor's Green, 3 BR Deluxe
Entire Place • 3 bedrooms
Note: Performance varies based on location, size, amenities, seasonality, and management quality. Data reflects the past 12 months.
Top Performing Airbnb Hosts in Williamsburg (2026)
Learn from the best! This table showcases top-performing Airbnb hosts in Williamsburg based on the number of properties managed and estimated total revenue over the past year. Analyze their scale and performance metrics.
| Host Name | Properties | Grossing Revenue | Stay Reviews | Avg Rating |
|---|---|---|---|---|
| Emma | 76 | $1,369,202 | 793 | 4.74/5.0 |
| Christian | 35 | $1,003,310 | 653 | 4.82/5.0 |
| David | 85 | $702,212 | 901 | 4.79/5.0 |
| Michael | 20 | $666,234 | 280 | 4.93/5.0 |
| Suite Match | 11 | $656,084 | 225 | 4.87/5.0 |
| Lugina | 11 | $642,712 | 133 | 4.95/5.0 |
| Brooke | 61 | $585,898 | 751 | 4.79/5.0 |
| Jeffrey | 31 | $560,532 | 330 | 4.82/5.0 |
| Anna | 42 | $527,827 | 330 | 4.77/5.0 |
| Debra Ann | 21 | $515,925 | 262 | 4.74/5.0 |
Analyzing the strategies of top hosts, such as their property selection, pricing, and guest communication, can offer valuable lessons for optimizing your own Airbnb operations in Williamsburg.
Dive Deeper: Advanced Williamsburg STR Market Data (2026)
Ready to unlock more insights? AirROI provides access to advanced metrics and comprehensive Airbnb data for Williamsburg. Explore detailed analytics beyond this report to refine your investment strategy, optimize pricing, and maximize your vacation rental profits.
Explore Advanced MetricsWilliamsburg Short-Term Rental Market Composition (2026): Property & Room Types
Room Type Distribution
Property Type Distribution
Market Composition Insights for Williamsburg
- The Williamsburg Airbnb market composition is heavily skewed towards Entire Home/Apt listings, which make up 77.5% of the 1,162 active rentals. This indicates strong guest preference for privacy and space.
- Looking at the property type distribution in Williamsburg, Apartment/Condo properties are the most common (67.3%), reflecting the local real estate landscape.
- The presence of 21.4% Hotel/Boutique listings indicates integration with traditional hospitality.
- Smaller segments like outdoor/unique, others (combined 1.7%) offer potential for unique stay experiences.
Williamsburg Airbnb Room Capacity Analysis (2026): Bedroom Distribution
Distribution of Listings by Number of Bedrooms
Room Capacity Insights for Williamsburg
- The dominant room capacity in Williamsburg is 2 bedrooms listings, making up 43.2% of the market. This suggests a strong demand for properties suitable for couples or solo travelers.
- Together, 2 bedrooms and 1 bedroom properties represent 65.2% of the active Airbnb listings in Williamsburg, indicating a high concentration in these sizes.
- A significant 29.0% of listings offer 3+ bedrooms, catering to larger groups and families seeking more space in Williamsburg.
Williamsburg Vacation Rental Guest Capacity Trends (2026)
Distribution of Listings by Guest Capacity
Guest Capacity Insights for Williamsburg
- The most common guest capacity trend in Williamsburg vacation rentals is listings accommodating 8+ guests (37.3%). This suggests the primary traveler segment is likely larger groups.
- Properties designed for 8+ guests and 6 guests dominate the Williamsburg STR market, accounting for 69.7% of listings.
- 70.0% of properties accommodate 6+ guests, serving the market segment for larger families or group travel in Williamsburg.
- On average, properties in Williamsburg are equipped to host 5.9 guests.
Williamsburg Airbnb Booking Patterns (2026): Available vs. Booked Days
Available Days Distribution
Booked Days Distribution
Booking Pattern Insights for Williamsburg
- The most common availability pattern in Williamsburg falls within the 271-366 days range, representing 74.5% of listings. This suggests many properties have significant open periods on their calendars.
- Approximately 93.9% of listings show high availability (181+ days open annually), indicating potential for increased bookings or specific owner usage patterns.
- For booked days, the 31-90 days range is most frequent in Williamsburg (42.5%), reflecting common guest stay durations or potential owner blocking patterns.
- A notable 6.4% of properties secure long booking periods (181+ days booked per year), highlighting successful long-term rental strategies or significant owner usage.
Williamsburg Airbnb Minimum Stay Requirements Analysis
Distribution of Listings by Minimum Night Requirement
1 Night
83 listings
7.1% of total
2 Nights
670 listings
57.7% of total
3 Nights
82 listings
7.1% of total
4-6 Nights
37 listings
3.2% of total
7-29 Nights
34 listings
2.9% of total
30+ Nights
256 listings
22% of total
Key Insights
- The most prevalent minimum stay requirement in Williamsburg is 2 Nights, adopted by 57.7% of listings. This highlights the market's preference for shorter, flexible bookings.
- A strong majority (64.8%) of the Williamsburg Airbnb data shows acceptance of very short stays (1-2 nights), indicating a dynamic, high-turnover market.
- A significant segment (22%) caters to monthly stays (30+ nights) in Williamsburg, pointing to opportunities in the extended-stay market.
Recommendations
- Align with the market by considering a 2 Nights minimum stay, as 57.7% of Williamsburg hosts use this setting.
- If feasible, allowing 1-night stays, especially midweek or during low season, could capture last-minute bookings, as only 7.1% currently do.
- A 2-night minimum appears standard (57.7%). Consider this for weekends or peak periods.
- Explore offering discounts for stays of 30+ nights to attract the 22% of the market seeking extended stays.
- Adjust minimum nights based on seasonality – potentially shorter during low season and longer during peak demand periods in Williamsburg.
Williamsburg Airbnb Cancellation Policy Trends Analysis (2026)
Super Strict 30 Days
43 listings
3.7% of total
Super Strict 60 Days
4 listings
0.3% of total
Flexible
22 listings
1.9% of total
Moderate
178 listings
15.5% of total
Firm
234 listings
20.3% of total
Strict
669 listings
58.2% of total
Cancellation Policy Insights for Williamsburg
- The prevailing Airbnb cancellation policy trend in Williamsburg is Strict, used by 58.2% of listings.
- A majority (78.5%) of hosts in Williamsburg utilize Firm or Strict policies, indicating a market where hosts prioritize booking security.
Recommendations for Hosts
- Consider adopting a Strict policy to align with the 58.2% market standard in Williamsburg.
- With 58.2% using Strict terms, this is a viable option in Williamsburg, particularly for high-value properties or during peak demand periods.
- Regularly review your cancellation policy against competitors and market demand shifts in Williamsburg.
Williamsburg STR Booking Lead Time Analysis (2026)
Average Booking Lead Time by Month
Booking Lead Time Insights for Williamsburg
- The overall average booking lead time for vacation rentals in Williamsburg is 32 days.
- Guests book furthest in advance for stays during May (average 55 days), likely coinciding with peak travel demand or local events.
- The shortest booking windows occur for stays in March (average 21 days), indicating more last-minute travel plans during this time.
- Seasonally, Spring (37 days avg.) sees the longest lead times, while Summer (28 days avg.) has the shortest, reflecting typical travel planning cycles.
Recommendations for Hosts
- Use the overall average lead time (32 days) as a baseline for your pricing and availability strategy in Williamsburg.
- For May stays, consider implementing length-of-stay discounts or slightly higher rates for bookings made less than 55 days out to capitalize on advance planning.
- Target marketing efforts for the Spring season well in advance (at least 37 days) to capture early planners.
- Monitor your own booking lead times against these Williamsburg averages to identify opportunities for dynamic pricing adjustments.
Popular & Essential Airbnb Amenities in Williamsburg (2026)
Amenity Prevalence
Amenity Insights for Williamsburg
- Essential amenities in Williamsburg that guests expect include: Wifi, Air conditioning, TV, Heating, Smoke alarm, Free parking on premises. Lacking these (any) could significantly impact bookings.
- Popular amenities like Hair dryer, Washer, Kitchen are common but not universal. Offering these can provide a competitive edge.
Recommendations for Hosts
- Ensure your listing includes all essential amenities for Williamsburg: Wifi, Air conditioning, TV, Heating, Smoke alarm, Free parking on premises.
- Prioritize adding missing essentials: Wifi, Air conditioning, TV, Heating, Smoke alarm, Free parking on premises.
- Consider adding popular differentiators like Hair dryer or Washer to increase appeal.
- Highlight unique or less common amenities you offer (e.g., hot tub, dedicated workspace, EV charger) in your listing description and photos.
- Regularly check competitor amenities in Williamsburg to stay competitive.
Williamsburg Airbnb Guest Demographics & Profile Analysis (2026)
Guest Profile Summary for Williamsburg
- The typical guest profile for Airbnb in Williamsburg consists of primarily domestic travelers (96%), often arriving from nearby Washington, typically belonging to the Post-2000s (Gen Z/Alpha) group (50%), primarily speaking English or Spanish.
- Domestic travelers account for 95.5% of guests.
- Key international markets include United States (95.5%) and DC (2.6%).
- Top languages spoken are English (76.7%) followed by Spanish (9.9%).
- A significant demographic segment is the Post-2000s (Gen Z/Alpha) group, representing 50% of guests.
Recommendations for Hosts
- Target domestic marketing efforts towards travelers from Washington and Raleigh.
- Tailor amenities and listing descriptions to appeal to the dominant Post-2000s (Gen Z/Alpha) demographic (e.g., highlight fast WiFi, smart home features, local guides).
- Highlight unique local experiences or amenities relevant to the primary guest profile.
- Consider seasonal promotions aligned with peak travel times for key origin markets.
Nearby Short-Term Rental Market Comparison
How does the Williamsburg Airbnb market stack up against its neighbors? Compare key performance metrics like average monthly revenue, ADR, and occupancy rates in surrounding areas to understand the broader regional STR landscape.
| Market | Active Properties | Monthly Revenue | Daily Rate | Avg. Occupancy |
|---|---|---|---|---|
| Mayo | 13 | $5,915 | $447.58 | 51% |
| Stevensville | 80 | $5,412 | $556.79 | 41% |
| Weems | 11 | $5,077 | $417.22 | 47% |
| Arundel on the Bay | 29 | $5,043 | $486.96 | 40% |
| Easton | 45 | $4,985 | $654.52 | 39% |
| Mineral | 231 | $4,800 | $474.55 | 36% |
| Middleburg | 39 | $4,681 | $485.11 | 41% |
| Queenstown | 24 | $4,637 | $625.95 | 37% |
| Pimmit Hills | 12 | $4,634 | $271.85 | 52% |
| Chester | 19 | $4,557 | $492.34 | 43% |