Wachapreague Airbnb Market Analysis 2026: Short Term Rental Data & Vacation Rental Statistics in Virginia, United States
Is Airbnb profitable in Wachapreague in 2026? Explore comprehensive Airbnb analytics for Wachapreague, Virginia, United States to uncover income potential. This 2026 STR market report for Wachapreague, based on AirROI data from February 2025 to January 2026, reveals key trends in the niche market of 22 active listings.
Whether you're considering an Airbnb investment in Wachapreague, optimizing your existing vacation rental, or exploring rental arbitrage opportunities, understanding the Wachapreague Airbnb data is crucial. Leveraging the low regulation environment is key to maximizing your short term rental income potential. Let's dive into the specifics.
Key Wachapreague Airbnb Performance Metrics Overview
Monthly Airbnb Revenue Variations & Income Potential in Wachapreague (2026)
Understanding the monthly revenue variations for Airbnb listings in Wachapreague is key to maximizing your short term rental income potential. Seasonality significantly impacts earnings. Our analysis, based on data from the past 12 months, shows that the peak revenue month for STRs in Wachapreague is typically January, while November often presents the lowest earnings, highlighting opportunities for strategic pricing adjustments during shoulder and low seasons. Explore the typical Airbnb income in Wachapreague across different performance tiers:
- Best-in-class properties (Top 10%) achieve $3,783+ monthly, often utilizing dynamic pricing and superior guest experiences.
- Strong performing properties (Top 25%) earn $1,931 or more, indicating effective management and desirable locations/amenities.
- Typical properties (Median) generate around $993 per month, representing the average market performance.
- Entry-level properties (Bottom 25%) see earnings around $541, often with potential for optimization.
Average Monthly Airbnb Earnings Trend in Wachapreague
Wachapreague Airbnb Occupancy Rate Trends (2026)
Maximize your bookings by understanding the Wachapreague STR occupancy trends. Seasonal demand shifts significantly influence how often properties are booked. Typically, Julysees the highest demand (peak season occupancy), while November experiences the lowest (low season). Effective strategies, like adjusting minimum stays or offering promotions, can boost occupancy during slower periods. Here's how different property tiers perform in Wachapreague:
- Best-in-class properties (Top 10%) achieve 42%+ occupancy, indicating high desirability and potentially optimized availability.
- Strong performing properties (Top 25%) maintain 29% or higher occupancy, suggesting good market fit and guest satisfaction.
- Typical properties (Median) have an occupancy rate around 17%.
- Entry-level properties (Bottom 25%) average 10% occupancy, potentially facing higher vacancy.
Average Monthly Occupancy Rate Trend in Wachapreague
Average Daily Rate (ADR) Airbnb Trends in Wachapreague (2026)
Effective short term rental pricing strategy in Wachapreague involves understanding monthly ADR fluctuations. The Average Daily Rate (ADR) for Airbnb in Wachapreague typically peaks in July and dips lowest during January. Leveraging Airbnb dynamic pricing tools or strategies based on this seasonality can significantly boost revenue. Here's a look at the typical nightly rates achieved:
- Best-in-class properties (Top 10%) command rates of $296+ per night, often due to premium features or locations.
- Strong performing properties (Top 25%) achieve nightly rates of $206 or more.
- Typical properties (Median) charge around $165 per night.
- Entry-level properties (Bottom 25%) earn around $153 per night.
Average Daily Rate (ADR) Trend by Month in Wachapreague
Get Live Wachapreague Market Intelligence 👇

Explore Real-time Analytics
Airbnb Seasonality Analysis & Trends in Wachapreague (2026)
Peak Season (January, May, July)
- Revenue averages $2,124 per month
- Occupancy rates average 25.9%
- Daily rates average $215
Shoulder Season
- Revenue averages $1,603 per month
- Occupancy maintains around 20.9%
- Daily rates hold near $217
Low Season (March, November, December)
- Revenue drops to average $875 per month
- Occupancy decreases to average 15.3%
- Daily rates adjust to average $191
Seasonality Insights for Wachapreague
- The Airbnb seasonality in Wachapreague shows highly seasonal trends requiring careful strategy. While the sections above show seasonal averages, it's also insightful to look at the extremes:
- During the high season, the absolute peak month showcases Wachapreague's highest earning potential, with monthly revenues capable of climbing to $2,250, occupancy reaching a high of 28.1%, and ADRs peaking at $240.
- Conversely, the slowest single month of the year, typically falling within the low season, marks the market's lowest point. In this month, revenue might dip to $675, occupancy could drop to 12.1%, and ADRs may adjust down to $177.
- Understanding both the seasonal averages and these monthly peaks and troughs in revenue, occupancy, and ADR is crucial for maximizing your Airbnb profit potential in Wachapreague.
Seasonal Strategies for Maximizing Profit
- Peak Season: Maximize revenue through premium pricing and potentially longer minimum stays. Ensure high availability.
- Low Season: Offer competitive pricing, special promotions (e.g., extended stay discounts), and flexible cancellation policies. Target off-season travelers like remote workers or budget-conscious guests.
- Shoulder Seasons: Implement dynamic pricing that balances peak and low rates. Target weekend travelers or specific events. Offer slightly more flexible terms than peak season.
- Regularly analyze your own performance against these Wachapreague seasonality benchmarks and adjust your pricing and availability strategy accordingly.
Best Areas for Airbnb Investment in Wachapreague (2026)
Exploring the top neighborhoods for short-term rentals in Wachapreague? This section highlights key areas, outlining why they are attractive for hosts and guests, along with notable local attractions. Consider these locations based on your target guest profile and investment strategy.
| Neighborhood / Area | Why Host Here? (Target Guests & Appeal) | Key Attractions & Landmarks |
|---|---|---|
| Chincoteague Island | Nearby popular resort town known for its beautiful beaches and wildlife, particularly the wild ponies. A favorite for families and nature lovers looking for a tranquil escape. | Chincoteague National Wildlife Refuge, Assateague Island National Seashore, Chincoteague Pony Centre, Chincoteague Island Watermen's Museum, Misty of Chincoteague Book |
| Eastern Shore of Virginia National Wildlife Refuge | A serene natural setting ideal for outdoors enthusiasts. Visitors can experience hiking, bird watching, and beautiful views of the Chesapeake Bay. | Nature trails, Birdwatching opportunities, Scenic vistas, Visitor center |
| Onancock | Charming historic town with a vibrant arts scene and waterfront activities. Popular for those looking for a quaint getaway with local culture. | North Street Playhouse, Onancock Wharf, Historic downtown, Local galleries and shops |
| Cape Charles | A beautiful coastal town with sandy beaches and a historic main street. Attracts those looking for a laid-back beach vibe. | Cape Charles Beach, Cape Charles Historic District, Cape Charles Museum, Kiptopeke State Park |
| Pungoteague | A rural community with access to outdoor activities and a step back in time with its rich agriculture. Perfect for travelers looking to relax and explore nature. | Local farms and markets, Fishing spots, Historic sites |
| Accomack County | Rich in history and natural beauty, known for its agricultural heritage and access to the Eastern Shore. Ideal for guests interested in local history and culture. | Historic sites, Local farms, Scenic parks |
| Machipongo | Small town feel with access to nature reserves and beaches. Great for people looking for a peaceful retreat. | Machipongo Clam Shack, Wildlife reserves, Hiking trails |
| Nassawadox | Quiet town with a rich history, perfect for guests looking for a rural escape with local charm and beautiful landscapes. | Historic landmarks, Local dining options, Scenic views |
Understanding Airbnb License Requirements & STR Laws in Wachapreague (2026)
While Wachapreague, Virginia, United States currently shows low STR regulations, specific Airbnb license requirements might still exist or change. Always verify the latest short term rental regulations and Airbnb license requirements directly with local government authorities for Wachapreague to ensure full compliance before hosting.
(Source: AirROI data, 2026, finding no licensed listings among those analyzed)
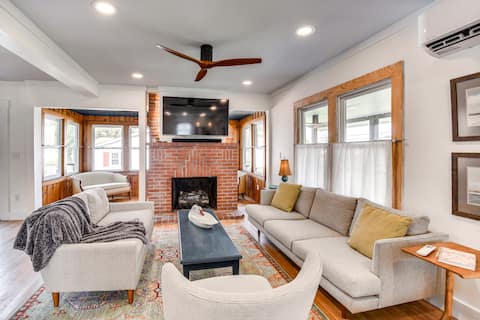
Top Performing Airbnb Properties in Wachapreague (2026)
Benchmark your potential! Explore examples of top-performing Airbnb properties in Wachapreaguebased on Trailing Twelve Month (TTM) revenue. Analyze their characteristics, revenue, occupancy rate, and ADR to understand what drives success in this market.

5 Bedroom, 5 Bathroom House
Entire Place • 5 bedrooms
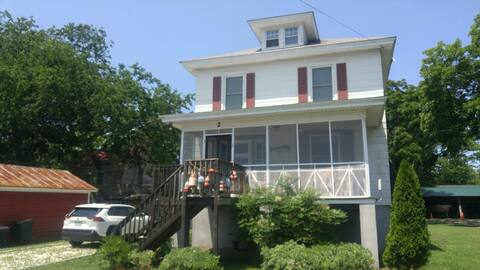
Virginia Retreat w/ Porch & Grill, Near Beaches!
Entire Place • 3 bedrooms
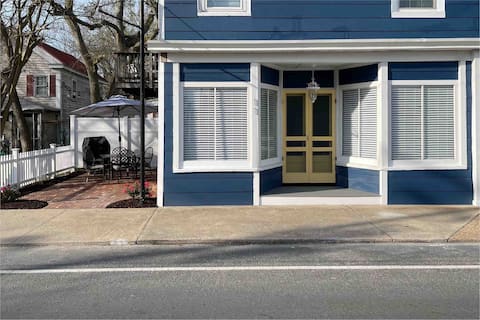
4BR -Seaside Village Wachapreague Eastern Shore VA
Entire Place • 4 bedrooms

“Little City by The Sea”
Entire Place • 2 bedrooms
Apt in Wachapreague | Seaside Village | Guest Fav
Entire Place • 1 bedroom

West End House
Entire Place • 4 bedrooms
Note: Performance varies based on location, size, amenities, seasonality, and management quality. Data reflects the past 12 months.
Top Performing Airbnb Hosts in Wachapreague (2026)
Learn from the best! This table showcases top-performing Airbnb hosts in Wachapreague based on the number of properties managed and estimated total revenue over the past year. Analyze their scale and performance metrics.
| Host Name | Properties | Grossing Revenue | Stay Reviews | Avg Rating |
|---|---|---|---|---|
| Nikki | 16 | $145,451 | 158 | 4.77/5.0 |
| Evolve | 1 | $32,667 | 27 | 4.93/5.0 |
| Brian | 1 | $22,567 | 123 | 4.87/5.0 |
| Glenn & Susan | 1 | $19,265 | 190 | 4.96/5.0 |
| Allen | 1 | $18,865 | 74 | 4.95/5.0 |
| Robert | 1 | $6,311 | 137 | 4.97/5.0 |
| Brian | 1 | $2,526 | 11 | 5.00/5.0 |
Analyzing the strategies of top hosts, such as their property selection, pricing, and guest communication, can offer valuable lessons for optimizing your own Airbnb operations in Wachapreague.
Dive Deeper: Advanced Wachapreague STR Market Data (2026)
Ready to unlock more insights? AirROI provides access to advanced metrics and comprehensive Airbnb data for Wachapreague. Explore detailed analytics beyond this report to refine your investment strategy, optimize pricing, and maximize your vacation rental profits.
Explore Advanced MetricsWachapreague Short-Term Rental Market Composition (2026): Property & Room Types
Room Type Distribution
Property Type Distribution
Market Composition Insights for Wachapreague
- The Wachapreague Airbnb market composition is heavily skewed towards Private Room listings, which make up 59.1% of the 22 active rentals. This indicates strong guest preference for privacy and space.
- Looking at the property type distribution in Wachapreague, Hotel/Boutique properties are the most common (54.5%), reflecting the local real estate landscape.
- Houses represent a significant 22.7% portion, catering likely to families or larger groups.
- The presence of 54.5% Hotel/Boutique listings indicates integration with traditional hospitality.
Wachapreague Airbnb Room Capacity Analysis (2026): Bedroom Distribution
Distribution of Listings by Number of Bedrooms
Room Capacity Insights for Wachapreague
- The dominant room capacity in Wachapreague is 1 bedroom listings, making up 50% of the market. This suggests a strong demand for properties suitable for couples or solo travelers.
- Together, 1 bedroom and 2 bedrooms properties represent 68.2% of the active Airbnb listings in Wachapreague, indicating a high concentration in these sizes.
- A significant 27.2% of listings offer 3+ bedrooms, catering to larger groups and families seeking more space in Wachapreague.
Wachapreague Vacation Rental Guest Capacity Trends (2026)
Distribution of Listings by Guest Capacity
Guest Capacity Insights for Wachapreague
- The most common guest capacity trend in Wachapreague vacation rentals is listings accommodating 2 guests (50%). This suggests the primary traveler segment is likely couples or solo travelers.
- Properties designed for 2 guests and 4 guests dominate the Wachapreague STR market, accounting for 63.6% of listings.
- A significant 50.0% of listings cater specifically to 1-2 guests, highlighting strong demand from couples and solo travelers in Wachapreague.
- 27.2% of properties accommodate 6+ guests, serving the market segment for larger families or group travel in Wachapreague.
- On average, properties in Wachapreague are equipped to host 3.5 guests.
Wachapreague Airbnb Booking Patterns (2026): Available vs. Booked Days
Available Days Distribution
Booked Days Distribution
Booking Pattern Insights for Wachapreague
- The most common availability pattern in Wachapreague falls within the 271-366 days range, representing 81.8% of listings. This suggests many properties have significant open periods on their calendars.
- Approximately 100.0% of listings show high availability (181+ days open annually), indicating potential for increased bookings or specific owner usage patterns.
- For booked days, the 31-90 days range is most frequent in Wachapreague (45.5%), reflecting common guest stay durations or potential owner blocking patterns.
Wachapreague Airbnb Minimum Stay Requirements Analysis
Distribution of Listings by Minimum Night Requirement
1 Night
9 listings
40.9% of total
2 Nights
10 listings
45.5% of total
3 Nights
3 listings
13.6% of total
Key Insights
- The most prevalent minimum stay requirement in Wachapreague is 2 Nights, adopted by 45.5% of listings. This highlights the market's preference for shorter, flexible bookings.
- A strong majority (86.4%) of the Wachapreague Airbnb data shows acceptance of very short stays (1-2 nights), indicating a dynamic, high-turnover market.
Recommendations
- Align with the market by considering a 2 Nights minimum stay, as 45.5% of Wachapreague hosts use this setting.
- Adjust minimum nights based on seasonality – potentially shorter during low season and longer during peak demand periods in Wachapreague.
Wachapreague Airbnb Cancellation Policy Trends Analysis (2026)
Moderate
15 listings
68.2% of total
Firm
6 listings
27.3% of total
Strict
1 listings
4.5% of total
Cancellation Policy Insights for Wachapreague
- The prevailing Airbnb cancellation policy trend in Wachapreague is Moderate, used by 68.2% of listings.
- There's a relatively balanced mix between guest-friendly (68.2%) and stricter (31.8%) policies, offering choices for different guest needs.
- Strict cancellation policies are quite rare (4.5%), potentially making listings with this policy less competitive unless justified by high demand or property type.
Recommendations for Hosts
- Consider adopting a Moderate policy to align with the 68.2% market standard in Wachapreague.
- Using a Strict policy might deter some guests, as only 4.5% of listings use it. Evaluate if potential revenue protection outweighs possible lower booking rates.
- Regularly review your cancellation policy against competitors and market demand shifts in Wachapreague.
Wachapreague STR Booking Lead Time Analysis (2026)
Average Booking Lead Time by Month
Booking Lead Time Insights for Wachapreague
- The overall average booking lead time for vacation rentals in Wachapreague is 89 days.
- Guests book furthest in advance for stays during April (average 156 days), likely coinciding with peak travel demand or local events.
- The shortest booking windows occur for stays in March (average 10 days), indicating more last-minute travel plans during this time.
- Seasonally, Fall (101 days avg.) sees the longest lead times, while Winter (31 days avg.) has the shortest, reflecting typical travel planning cycles.
Recommendations for Hosts
- Use the overall average lead time (89 days) as a baseline for your pricing and availability strategy in Wachapreague.
- For April stays, consider implementing length-of-stay discounts or slightly higher rates for bookings made less than 156 days out to capitalize on advance planning.
- During March, focus on last-minute booking availability and promotions, as guests book with very short notice (10 days avg.).
- Target marketing efforts for the Fall season well in advance (at least 101 days) to capture early planners.
- Monitor your own booking lead times against these Wachapreague averages to identify opportunities for dynamic pricing adjustments.
Popular & Essential Airbnb Amenities in Wachapreague (2026)
Amenity Prevalence
No amenities with partial availability (less than 100%) were found to display in the chart. All essential amenities might be present in all listings. Check insights below.
Amenity Insights for Wachapreague
- Essential amenities in Wachapreague that guests expect include: Cooking basics, Essentials, Shampoo, TV, Air conditioning, Heating, Wifi, Free parking on premises, Smoke alarm, Hangers. Lacking these (any) could significantly impact bookings.
Recommendations for Hosts
- Ensure your listing includes all essential amenities for Wachapreague: Cooking basics, Essentials, Shampoo, TV, Air conditioning, Heating, Wifi, Free parking on premises, Smoke alarm, Hangers.
- Highlight unique or less common amenities you offer (e.g., hot tub, dedicated workspace, EV charger) in your listing description and photos.
- Regularly check competitor amenities in Wachapreague to stay competitive.
Wachapreague Airbnb Guest Demographics & Profile Analysis (2026)
Guest Profile Summary for Wachapreague
- The typical guest profile for Airbnb in Wachapreague consists of primarily domestic travelers (98%), often arriving from nearby Downingtown, typically belonging to the Post-2000s (Gen Z/Alpha) group (50%), primarily speaking English or Hindi.
- Domestic travelers account for 97.6% of guests.
- Key international markets include United States (97.6%) and Canada (2.4%).
- Top languages spoken are English (72.7%) followed by Hindi (4.5%).
- A significant demographic segment is the Post-2000s (Gen Z/Alpha) group, representing 50% of guests.
Recommendations for Hosts
- Target domestic marketing efforts towards travelers from Downingtown and Virginia Beach.
- Tailor amenities and listing descriptions to appeal to the dominant Post-2000s (Gen Z/Alpha) demographic (e.g., highlight fast WiFi, smart home features, local guides).
- Highlight unique local experiences or amenities relevant to the primary guest profile.
- Consider seasonal promotions aligned with peak travel times for key origin markets.
Nearby Short-Term Rental Market Comparison
How does the Wachapreague Airbnb market stack up against its neighbors? Compare key performance metrics like average monthly revenue, ADR, and occupancy rates in surrounding areas to understand the broader regional STR landscape.
| Market | Active Properties | Monthly Revenue | Daily Rate | Avg. Occupancy |
|---|---|---|---|---|
| Mayo | 13 | $5,915 | $447.58 | 51% |
| Cape May Point | 23 | $5,479 | $542.19 | 46% |
| Stevensville | 80 | $5,412 | $556.79 | 41% |
| Weems | 11 | $5,077 | $417.22 | 47% |
| Arundel on the Bay | 29 | $5,043 | $486.96 | 40% |
| Cape May | 334 | $5,029 | $553.79 | 42% |
| Easton | 45 | $4,985 | $654.52 | 39% |
| West Cape May | 100 | $4,700 | $480.79 | 46% |
| Queenstown | 24 | $4,637 | $625.95 | 37% |
| Chester | 19 | $4,557 | $492.34 | 43% |