Virginia Beach Airbnb Market Analysis 2026: Short Term Rental Data & Vacation Rental Statistics in Virginia, United States
Is Airbnb profitable in Virginia Beach in 2026? Explore comprehensive Airbnb analytics for Virginia Beach, Virginia, United States to uncover income potential. This 2026 STR market report for Virginia Beach, based on AirROI data from February 2025 to January 2026, reveals key trends in the bustling market of 1,342 active listings.
Whether you're considering an Airbnb investment in Virginia Beach, optimizing your existing vacation rental, or exploring rental arbitrage opportunities, understanding the Virginia Beach Airbnb data is crucial. Leveraging the low regulation environment is key to maximizing your short term rental income potential. Let's dive into the specifics.
Key Virginia Beach Airbnb Performance Metrics Overview
Monthly Airbnb Revenue Variations & Income Potential in Virginia Beach (2026)
Understanding the monthly revenue variations for Airbnb listings in Virginia Beach is key to maximizing your short term rental income potential. Seasonality significantly impacts earnings. Our analysis, based on data from the past 12 months, shows that the peak revenue month for STRs in Virginia Beach is typically July, while February often presents the lowest earnings, highlighting opportunities for strategic pricing adjustments during shoulder and low seasons. Explore the typical Airbnb income in Virginia Beach across different performance tiers:
- Best-in-class properties (Top 10%) achieve $9,619+ monthly, often utilizing dynamic pricing and superior guest experiences.
- Strong performing properties (Top 25%) earn $6,132 or more, indicating effective management and desirable locations/amenities.
- Typical properties (Median) generate around $3,299 per month, representing the average market performance.
- Entry-level properties (Bottom 25%) see earnings around $1,594, often with potential for optimization.
Average Monthly Airbnb Earnings Trend in Virginia Beach
Virginia Beach Airbnb Occupancy Rate Trends (2026)
Maximize your bookings by understanding the Virginia Beach STR occupancy trends. Seasonal demand shifts significantly influence how often properties are booked. Typically, Julysees the highest demand (peak season occupancy), while January experiences the lowest (low season). Effective strategies, like adjusting minimum stays or offering promotions, can boost occupancy during slower periods. Here's how different property tiers perform in Virginia Beach:
- Best-in-class properties (Top 10%) achieve 79%+ occupancy, indicating high desirability and potentially optimized availability.
- Strong performing properties (Top 25%) maintain 62% or higher occupancy, suggesting good market fit and guest satisfaction.
- Typical properties (Median) have an occupancy rate around 41%.
- Entry-level properties (Bottom 25%) average 21% occupancy, potentially facing higher vacancy.
Average Monthly Occupancy Rate Trend in Virginia Beach
Average Daily Rate (ADR) Airbnb Trends in Virginia Beach (2026)
Effective short term rental pricing strategy in Virginia Beach involves understanding monthly ADR fluctuations. The Average Daily Rate (ADR) for Airbnb in Virginia Beach typically peaks in July and dips lowest during February. Leveraging Airbnb dynamic pricing tools or strategies based on this seasonality can significantly boost revenue. Here's a look at the typical nightly rates achieved:
- Best-in-class properties (Top 10%) command rates of $649+ per night, often due to premium features or locations.
- Strong performing properties (Top 25%) achieve nightly rates of $425 or more.
- Typical properties (Median) charge around $263 per night.
- Entry-level properties (Bottom 25%) earn around $166 per night.
Average Daily Rate (ADR) Trend by Month in Virginia Beach
Get Live Virginia Beach Market Intelligence 👇

Explore Real-time Analytics
Airbnb Seasonality Analysis & Trends in Virginia Beach (2026)
Peak Season (July, August, June)
- Revenue averages $7,698 per month
- Occupancy rates average 58.8%
- Daily rates average $380
Shoulder Season
- Revenue averages $3,865 per month
- Occupancy maintains around 38.7%
- Daily rates hold near $332
Low Season (January, February, March)
- Revenue drops to average $2,718 per month
- Occupancy decreases to average 35.1%
- Daily rates adjust to average $304
Seasonality Insights for Virginia Beach
- The Airbnb seasonality in Virginia Beach shows highly seasonal trends requiring careful strategy. While the sections above show seasonal averages, it's also insightful to look at the extremes:
- During the high season, the absolute peak month showcases Virginia Beach's highest earning potential, with monthly revenues capable of climbing to $8,539, occupancy reaching a high of 62.6%, and ADRs peaking at $386.
- Conversely, the slowest single month of the year, typically falling within the low season, marks the market's lowest point. In this month, revenue might dip to $2,478, occupancy could drop to 27.4%, and ADRs may adjust down to $284.
- Understanding both the seasonal averages and these monthly peaks and troughs in revenue, occupancy, and ADR is crucial for maximizing your Airbnb profit potential in Virginia Beach.
Seasonal Strategies for Maximizing Profit
- Peak Season: Maximize revenue through premium pricing and potentially longer minimum stays. Ensure high availability.
- Low Season: Offer competitive pricing, special promotions (e.g., extended stay discounts), and flexible cancellation policies. Target off-season travelers like remote workers or budget-conscious guests.
- Shoulder Seasons: Implement dynamic pricing that balances peak and low rates. Target weekend travelers or specific events. Offer slightly more flexible terms than peak season.
- Regularly analyze your own performance against these Virginia Beach seasonality benchmarks and adjust your pricing and availability strategy accordingly.
Best Areas for Airbnb Investment in Virginia Beach (2026)
Exploring the top neighborhoods for short-term rentals in Virginia Beach? This section highlights key areas, outlining why they are attractive for hosts and guests, along with notable local attractions. Consider these locations based on your target guest profile and investment strategy.
| Neighborhood / Area | Why Host Here? (Target Guests & Appeal) | Key Attractions & Landmarks |
|---|---|---|
| Oceanfront | The Oceanfront is a bustling location with a vibrant boardwalk and beautiful sandy beaches, making it an ideal spot for tourists looking to stay close to the water and enjoy beach activities. | Virginia Beach Boardwalk, Neptune Statue, Virginia Aquarium & Marine Science Center, Ocean Breeze Waterpark, Cape Henry Lighthouse |
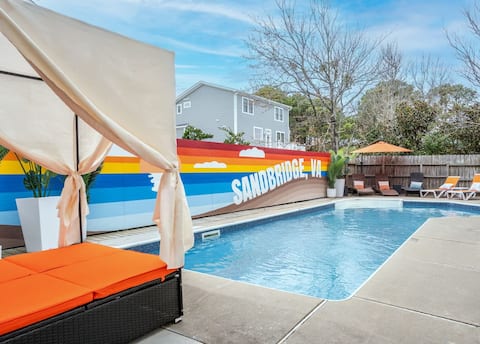
| Sandbridge Beach | A more tranquil beach experience, Sandbridge Beach offers a family-friendly atmosphere with beautiful homes and nature reserves, appealing to visitors looking for a peaceful getaway. | Back Bay National Wildlife Refuge, Sandbridge Dunes, Little Island Park, The Norwegian Lady Statue |
| Virginia Beach Town Center | The Town Center is a shopping and business hub with numerous restaurants, shops, and entertainment options. It attracts both tourists and business travelers looking for convenience. | Pembroke Mall, Town Center Park, The Art Institute of Virginia Beach, Cinemark 18 |
| Knotts Island | A rural area just outside Virginia Beach, it offers a unique experience with scenic views and proximity to wildlife refuges, ideal for those looking for a retreat in nature. | Currituck National Wildlife Refuge, North River Wetlands Preserve, Historic Knotts Island |
| Chic's Beach | Chic's Beach is a laid-back beach community known for its stunning sunsets and quieter atmosphere. It attracts families and young couples looking for a relaxed beach vacation. | Chic's Beach Park, local seafood restaurants, kayaking on the bay, Marine Science Center |
| First Landing State Park | A historical site with abundant natural beauty, this area is perfect for nature lovers and families looking to explore hiking trails and participate in outdoor activities. | First Landing State Park Trails, False Cape State Park, Cypress Swamp |
| Historic Cape Henry | Home to the historic lighthouses and beautiful coastal scenery, this area attracts history buffs and those interested in maritime heritage. | Cape Henry Lighthouses, Fort Story, Public Beach Access |
| Pungo | Nestled in the rural countryside, Pungo offers visitors a taste of the agricultural lifestyle with farms, markets, and scenic views, appealing to those looking for a different side of Virginia Beach. | Pungo Strawberry Festival, Back Bay National Wildlife Refuge, Farms and markets |
Understanding Airbnb License Requirements & STR Laws in Virginia Beach (2026)
While Virginia Beach, Virginia, United States currently shows low STR regulations, specific Airbnb license requirements might still exist or change. Always verify the latest short term rental regulations and Airbnb license requirements directly with local government authorities for Virginia Beach to ensure full compliance before hosting.
(Source: AirROI data, 2026, based on 1% licensed listings)
Top Performing Airbnb Properties in Virginia Beach (2026)
Benchmark your potential! Explore examples of top-performing Airbnb properties in Virginia Beachbased on Trailing Twelve Month (TTM) revenue. Analyze their characteristics, revenue, occupancy rate, and ADR to understand what drives success in this market.
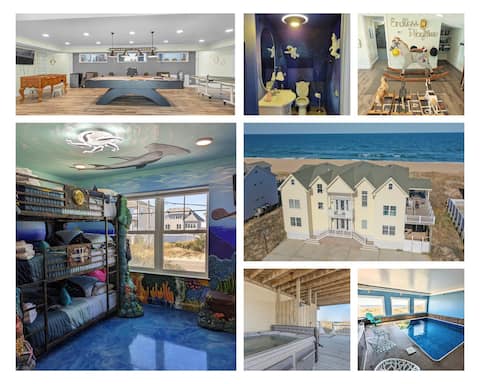
Oceanfront / 11 bds / 33 PPL / Indoor Pool
Entire Place • 11 bedrooms
Designer 7BR w/ Pool and Hot Tub. Pets welcome!
Entire Place • 7 bedrooms

Smack Attack: New Construction, North End, Pool
Entire Place • 7 bedrooms
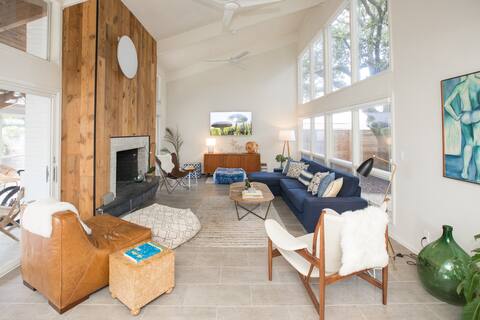
Modernist Oasis | 2 Luxury Homes & Private Pool
Entire Place • 6 bedrooms

Sojourn Ocean Dreams Sleeps 18+
Entire Place • 7 bedrooms

8br, Pool, Lzy Rvr, Pier, Pool, Hot Tub (Sandbridge)
Entire Place • 8 bedrooms
Note: Performance varies based on location, size, amenities, seasonality, and management quality. Data reflects the past 12 months.
Top Performing Airbnb Hosts in Virginia Beach (2026)
Learn from the best! This table showcases top-performing Airbnb hosts in Virginia Beach based on the number of properties managed and estimated total revenue over the past year. Analyze their scale and performance metrics.
| Host Name | Properties | Grossing Revenue | Stay Reviews | Avg Rating |
|---|---|---|---|---|
| Sandbridge Stays | 29 | $2,324,461 | 742 | 4.80/5.0 |
| Christine | 19 | $2,055,797 | 1293 | 4.65/5.0 |
| Dimitri | 40 | $1,818,584 | 1270 | 4.88/5.0 |
| Sojourn | 23 | $1,548,482 | 472 | 4.78/5.0 |
| Coastal Accommodations | 25 | $1,529,114 | 605 | 4.76/5.0 |
| Vacasa Virginia | 104 | $1,489,522 | 1411 | 4.42/5.0 |
| Stay Va Beach | 27 | $1,234,635 | 1183 | 4.72/5.0 |
| Ocean Sands Realty | 26 | $1,045,348 | 111 | 4.48/5.0 |
| Anchor Realty Group | 21 | $1,015,807 | 231 | 4.50/5.0 |
| Cathleen | 10 | $930,360 | 619 | 4.93/5.0 |
Analyzing the strategies of top hosts, such as their property selection, pricing, and guest communication, can offer valuable lessons for optimizing your own Airbnb operations in Virginia Beach.
Dive Deeper: Advanced Virginia Beach STR Market Data (2026)
Ready to unlock more insights? AirROI provides access to advanced metrics and comprehensive Airbnb data for Virginia Beach. Explore detailed analytics beyond this report to refine your investment strategy, optimize pricing, and maximize your vacation rental profits.
Explore Advanced MetricsVirginia Beach Short-Term Rental Market Composition (2026): Property & Room Types
Room Type Distribution
Property Type Distribution
Market Composition Insights for Virginia Beach
- The Virginia Beach Airbnb market composition is heavily skewed towards Entire Home/Apt listings, which make up 87% of the 1,342 active rentals. This indicates strong guest preference for privacy and space.
- Looking at the property type distribution in Virginia Beach, House properties are the most common (50.6%), reflecting the local real estate landscape.
- Houses represent a significant 50.6% portion, catering likely to families or larger groups.
- Smaller segments like hotel/boutique, others, outdoor/unique, unique stays (combined 9.4%) offer potential for unique stay experiences.
Virginia Beach Airbnb Room Capacity Analysis (2026): Bedroom Distribution
Distribution of Listings by Number of Bedrooms
Room Capacity Insights for Virginia Beach
- The dominant room capacity in Virginia Beach is 2 bedrooms listings, making up 28.8% of the market. This suggests a strong demand for properties suitable for couples or solo travelers.
- Together, 2 bedrooms and 1 bedroom properties represent 47.9% of the active Airbnb listings in Virginia Beach, indicating a high concentration in these sizes.
- A significant 40.1% of listings offer 3+ bedrooms, catering to larger groups and families seeking more space in Virginia Beach.
Virginia Beach Vacation Rental Guest Capacity Trends (2026)
Distribution of Listings by Guest Capacity
Guest Capacity Insights for Virginia Beach
- The most common guest capacity trend in Virginia Beach vacation rentals is listings accommodating 8+ guests (33.7%). This suggests the primary traveler segment is likely larger groups.
- Properties designed for 8+ guests and 6 guests dominate the Virginia Beach STR market, accounting for 53.1% of listings.
- 55.3% of properties accommodate 6+ guests, serving the market segment for larger families or group travel in Virginia Beach.
- On average, properties in Virginia Beach are equipped to host 5.3 guests.
Virginia Beach Airbnb Booking Patterns (2026): Available vs. Booked Days
Available Days Distribution
Booked Days Distribution
Booking Pattern Insights for Virginia Beach
- The most common availability pattern in Virginia Beach falls within the 271-366 days range, representing 48.1% of listings. This suggests many properties have significant open periods on their calendars.
- Approximately 82.5% of listings show high availability (181+ days open annually), indicating potential for increased bookings or specific owner usage patterns.
- For booked days, the 91-180 days range is most frequent in Virginia Beach (35.4%), reflecting common guest stay durations or potential owner blocking patterns.
- A notable 18.6% of properties secure long booking periods (181+ days booked per year), highlighting successful long-term rental strategies or significant owner usage.
Virginia Beach Airbnb Minimum Stay Requirements Analysis
Distribution of Listings by Minimum Night Requirement
1 Night
164 listings
12.2% of total
2 Nights
179 listings
13.4% of total
3 Nights
159 listings
11.9% of total
4-6 Nights
103 listings
7.7% of total
7-29 Nights
176 listings
13.1% of total
30+ Nights
558 listings
41.7% of total
Key Insights
- The most prevalent minimum stay requirement in Virginia Beach is 30+ Nights, adopted by 41.7% of listings. This highlights the market's preference for longer commitments.
- A significant segment (41.7%) caters to monthly stays (30+ nights) in Virginia Beach, pointing to opportunities in the extended-stay market.
Recommendations
- Align with the market by considering a 30+ Nights minimum stay, as 41.7% of Virginia Beach hosts use this setting.
- If feasible, allowing 1-night stays, especially midweek or during low season, could capture last-minute bookings, as only 12.2% currently do.
- Explore offering discounts for stays of 30+ nights to attract the 41.7% of the market seeking extended stays.
- Adjust minimum nights based on seasonality – potentially shorter during low season and longer during peak demand periods in Virginia Beach.
Virginia Beach Airbnb Cancellation Policy Trends Analysis (2026)
Refundable
2 listings
0.1% of total
Super Strict 60 Days
66 listings
4.9% of total
Non-refundable
1 listings
0.1% of total
Super Strict 30 Days
159 listings
11.9% of total
Limited
4 listings
0.3% of total
Flexible
128 listings
9.6% of total
Moderate
254 listings
19% of total
Firm
463 listings
34.7% of total
Strict
257 listings
19.3% of total
Cancellation Policy Insights for Virginia Beach
- The prevailing Airbnb cancellation policy trend in Virginia Beach is Firm, used by 34.7% of listings.
- A majority (54.0%) of hosts in Virginia Beach utilize Firm or Strict policies, indicating a market where hosts prioritize booking security.
Recommendations for Hosts
- Consider adopting a Firm policy to align with the 34.7% market standard in Virginia Beach.
- Regularly review your cancellation policy against competitors and market demand shifts in Virginia Beach.
Virginia Beach STR Booking Lead Time Analysis (2026)
Average Booking Lead Time by Month
Booking Lead Time Insights for Virginia Beach
- The overall average booking lead time for vacation rentals in Virginia Beach is 57 days.
- Guests book furthest in advance for stays during July (average 77 days), likely coinciding with peak travel demand or local events.
- The shortest booking windows occur for stays in February (average 27 days), indicating more last-minute travel plans during this time.
- Seasonally, Summer (72 days avg.) sees the longest lead times, while Winter (32 days avg.) has the shortest, reflecting typical travel planning cycles.
Recommendations for Hosts
- Use the overall average lead time (57 days) as a baseline for your pricing and availability strategy in Virginia Beach.
- For July stays, consider implementing length-of-stay discounts or slightly higher rates for bookings made less than 77 days out to capitalize on advance planning.
- Target marketing efforts for the Summer season well in advance (at least 72 days) to capture early planners.
- Monitor your own booking lead times against these Virginia Beach averages to identify opportunities for dynamic pricing adjustments.
Popular & Essential Airbnb Amenities in Virginia Beach (2026)
Amenity Prevalence
Amenity Insights for Virginia Beach
- Essential amenities in Virginia Beach that guests expect include: Air conditioning, TV, Wifi, Smoke alarm, Heating. Lacking these (any) could significantly impact bookings.
- Popular amenities like Free parking on premises, Kitchen, Hot water are common but not universal. Offering these can provide a competitive edge.
Recommendations for Hosts
- Ensure your listing includes all essential amenities for Virginia Beach: Air conditioning, TV, Wifi, Smoke alarm, Heating.
- Prioritize adding missing essentials: Air conditioning, TV, Wifi, Smoke alarm, Heating.
- Consider adding popular differentiators like Free parking on premises or Kitchen to increase appeal.
- Highlight unique or less common amenities you offer (e.g., hot tub, dedicated workspace, EV charger) in your listing description and photos.
- Regularly check competitor amenities in Virginia Beach to stay competitive.
Virginia Beach Airbnb Guest Demographics & Profile Analysis (2026)
Guest Profile Summary for Virginia Beach
- The typical guest profile for Airbnb in Virginia Beach consists of primarily domestic travelers (95%), often arriving from nearby Richmond, typically belonging to the Post-2000s (Gen Z/Alpha) group (50%), primarily speaking English or Spanish.
- Domestic travelers account for 95.1% of guests.
- Key international markets include United States (95.1%) and DC (2.9%).
- Top languages spoken are English (74.3%) followed by Spanish (11.2%).
- A significant demographic segment is the Post-2000s (Gen Z/Alpha) group, representing 50% of guests.
Recommendations for Hosts
- Target domestic marketing efforts towards travelers from Richmond and Washington.
- Tailor amenities and listing descriptions to appeal to the dominant Post-2000s (Gen Z/Alpha) demographic (e.g., highlight fast WiFi, smart home features, local guides).
- Highlight unique local experiences or amenities relevant to the primary guest profile.
- Consider seasonal promotions aligned with peak travel times for key origin markets.
Nearby Short-Term Rental Market Comparison
How does the Virginia Beach Airbnb market stack up against its neighbors? Compare key performance metrics like average monthly revenue, ADR, and occupancy rates in surrounding areas to understand the broader regional STR landscape.
| Market | Active Properties | Monthly Revenue | Daily Rate | Avg. Occupancy |
|---|---|---|---|---|
| Weems | 11 | $5,077 | $417.22 | 47% |
| Corolla | 825 | $4,510 | $516.43 | 40% |
| Salvo | 86 | $4,421 | $483.32 | 41% |
| Duck | 272 | $4,416 | $452.93 | 43% |
| Southern Shores | 176 | $4,215 | $449.48 | 45% |
| Nags Head | 835 | $4,193 | $436.54 | 42% |
| White Stone | 41 | $4,069 | $476.32 | 38% |
| Rodanthe | 150 | $4,053 | $422.32 | 39% |
| Cobbs Creek | 12 | $4,015 | $315.26 | 46% |
| Lanexa | 15 | $3,643 | $284.48 | 45% |