Urbanna Airbnb Market Analysis 2025: Short Term Rental Data & Vacation Rental Statistics in Virginia, United States
Is Airbnb profitable in Urbanna in 2025? Explore comprehensive Airbnb analytics for Urbanna, Virginia, United States to uncover income potential. This 2025 STR market report for Urbanna, based on AirROI data from November 2024 to October 2025, reveals key trends in the niche market of 18 active listings.
Whether you're considering an Airbnb investment in Urbanna, optimizing your existing vacation rental, or exploring rental arbitrage opportunities, understanding the Urbanna Airbnb data is crucial. Leveraging the low regulation environment is key to maximizing your short term rental income potential. Let's dive into the specifics.
Key Urbanna Airbnb Performance Metrics Overview
Monthly Airbnb Revenue Variations & Income Potential in Urbanna (2025)
Understanding the monthly revenue variations for Airbnb listings in Urbanna is key to maximizing your short term rental income potential. Seasonality significantly impacts earnings. Our analysis, based on data from the past 12 months, shows that the peak revenue month for STRs in Urbanna is typically August, while February often presents the lowest earnings, highlighting opportunities for strategic pricing adjustments during shoulder and low seasons. Explore the typical Airbnb income in Urbanna across different performance tiers:
- Best-in-class properties (Top 10%) achieve $8,072+ monthly, often utilizing dynamic pricing and superior guest experiences.
- Strong performing properties (Top 25%) earn $4,791 or more, indicating effective management and desirable locations/amenities.
- Typical properties (Median) generate around $3,305 per month, representing the average market performance.
- Entry-level properties (Bottom 25%) see earnings around $1,912, often with potential for optimization.
Average Monthly Airbnb Earnings Trend in Urbanna
Urbanna Airbnb Occupancy Rate Trends (2025)
Maximize your bookings by understanding the Urbanna STR occupancy trends. Seasonal demand shifts significantly influence how often properties are booked. Typically, Augustsees the highest demand (peak season occupancy), while March experiences the lowest (low season). Effective strategies, like adjusting minimum stays or offering promotions, can boost occupancy during slower periods. Here's how different property tiers perform in Urbanna:
- Best-in-class properties (Top 10%) achieve 83%+ occupancy, indicating high desirability and potentially optimized availability.
- Strong performing properties (Top 25%) maintain 74% or higher occupancy, suggesting good market fit and guest satisfaction.
- Typical properties (Median) have an occupancy rate around 55%.
- Entry-level properties (Bottom 25%) average 34% occupancy, potentially facing higher vacancy.
Average Monthly Occupancy Rate Trend in Urbanna
Average Daily Rate (ADR) Airbnb Trends in Urbanna (2025)
Effective short term rental pricing strategy in Urbanna involves understanding monthly ADR fluctuations. The Average Daily Rate (ADR) for Airbnb in Urbanna typically peaks in June and dips lowest during February. Leveraging Airbnb dynamic pricing tools or strategies based on this seasonality can significantly boost revenue. Here's a look at the typical nightly rates achieved:
- Best-in-class properties (Top 10%) command rates of $404+ per night, often due to premium features or locations.
- Strong performing properties (Top 25%) achieve nightly rates of $258 or more.
- Typical properties (Median) charge around $208 per night.
- Entry-level properties (Bottom 25%) earn around $176 per night.
Average Daily Rate (ADR) Trend by Month in Urbanna
Get Live Urbanna Market Intelligence 👇

Explore Real-time Analytics
Airbnb Seasonality Analysis & Trends in Urbanna (2025)
Peak Season (August, July, June)
- Revenue averages $5,967 per month
- Occupancy rates average 69.4%
- Daily rates average $264
Shoulder Season
- Revenue averages $3,922 per month
- Occupancy maintains around 52.4%
- Daily rates hold near $228
Low Season (January, February, March)
- Revenue drops to average $2,678 per month
- Occupancy decreases to average 38.6%
- Daily rates adjust to average $210
Seasonality Insights for Urbanna
- The Airbnb seasonality in Urbanna shows highly seasonal trends requiring careful strategy. While the sections above show seasonal averages, it's also insightful to look at the extremes:
- During the high season, the absolute peak month showcases Urbanna's highest earning potential, with monthly revenues capable of climbing to $6,290, occupancy reaching a high of 72.8%, and ADRs peaking at $273.
- Conversely, the slowest single month of the year, typically falling within the low season, marks the market's lowest point. In this month, revenue might dip to $2,334, occupancy could drop to 36.9%, and ADRs may adjust down to $207.
- Understanding both the seasonal averages and these monthly peaks and troughs in revenue, occupancy, and ADR is crucial for maximizing your Airbnb profit potential in Urbanna.
Seasonal Strategies for Maximizing Profit
- Peak Season: Maximize revenue through premium pricing and potentially longer minimum stays. Ensure high availability.
- Low Season: Offer competitive pricing, special promotions (e.g., extended stay discounts), and flexible cancellation policies. Target off-season travelers like remote workers or budget-conscious guests.
- Shoulder Seasons: Implement dynamic pricing that balances peak and low rates. Target weekend travelers or specific events. Offer slightly more flexible terms than peak season.
- Regularly analyze your own performance against these Urbanna seasonality benchmarks and adjust your pricing and availability strategy accordingly.
Best Areas for Airbnb Investment in Urbanna (2025)
Exploring the top neighborhoods for short-term rentals in Urbanna? This section highlights key areas, outlining why they are attractive for hosts and guests, along with notable local attractions. Consider these locations based on your target guest profile and investment strategy.
| Neighborhood / Area | Why Host Here? (Target Guests & Appeal) | Key Attractions & Landmarks |
|---|---|---|
| Urbanna Historic District | Charming area filled with historic homes and waterfront views. It's perfect for guests looking to experience the rich history and maritime culture of Urbanna. | Urbanna Museum & Historical Society, Urbanna Harbor, Urbanna Farmers Market, RivahFest, Historic Main Street |
| Urbanna Creek | Scenic waterfront area popular for boating and fishing. Ideal for visitors who enjoy outdoor activities and relaxing by the water. | Urbanna Creek, Deltaville Marina, Fishing spots, Boat rentals, Waterfront dining |
| Urbanna Park | A community park offering recreational activities and events. Great for families and visitors looking to enjoy outdoor space and local gatherings. | Urbanna Park, Picnic areas, Walking trails, Playground, Community events |
| Rappahannock River | Stunning river views and a relaxing atmosphere, perfect for guests who want to enjoy nature and water activities. | Rappahannock River, Kayaking, Fishing, Nature trails, Riverfront dining |
| Urbanna Music Festival Grounds | Host to the annual Urbanna Oyster Festival, this area attracts visitors during special events and festivals, ideal for local culture enthusiasts. | Urbanna Oyster Festival, Live music events, Local vendors, Cultural celebrations |
| Nearby Deltaville | A short drive from Urbanna, Deltaville offers additional attractions and dining options, making it a great extension for guests. | Deltaville Maritime Museum, Restaurants, Waterfront views, Fishing opportunities |
| Wine Trail | Urbanna is near several wineries, attracting wine lovers and those looking for a culinary experience in a beautiful landscape. | Local wineries, Wine tasting tours, Scenic drives, Farmers markets, Gastronomic events |
| Historic Plantation Homes | The surrounding area features several historic plantation homes that offer insight into Virginia's history and charm, appealing to history buffs. | Historic plantations, Guided tours, Nature walks, Cultural heritage sites |
Understanding Airbnb License Requirements & STR Laws in Urbanna (2025)
While Urbanna, Virginia, United States currently shows low STR regulations, specific Airbnb license requirements might still exist or change. Always verify the latest short term rental regulations and Airbnb license requirements directly with local government authorities for Urbanna to ensure full compliance before hosting.
(Source: AirROI data, 2025, finding no licensed listings among those analyzed)
Top Performing Airbnb Properties in Urbanna (2025)
Benchmark your potential! Explore examples of top-performing Airbnb properties in Urbannabased on Trailing Twelve Month (TTM) revenue. Analyze their characteristics, revenue, occupancy rate, and ADR to understand what drives success in this market.
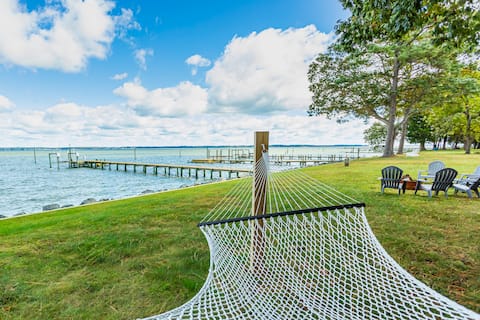
Beachfront Urbanna Home w/ Gas Grill & Deck!
Entire Place • 3 bedrooms
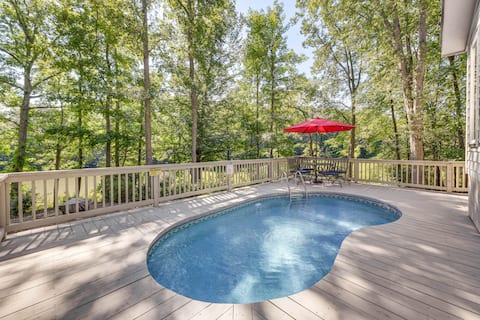
Newly Renovated Cottage on the Rappahannock!
Entire Place • 3 bedrooms
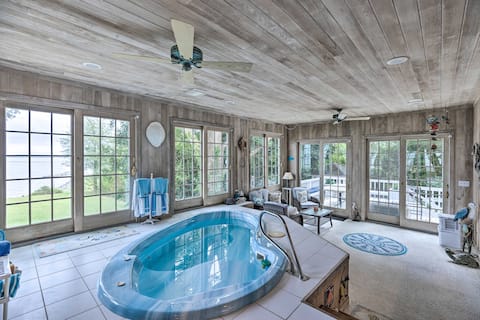
Waterfront Urbanna Home w/ Private Dock & Pool
Entire Place • 3 bedrooms
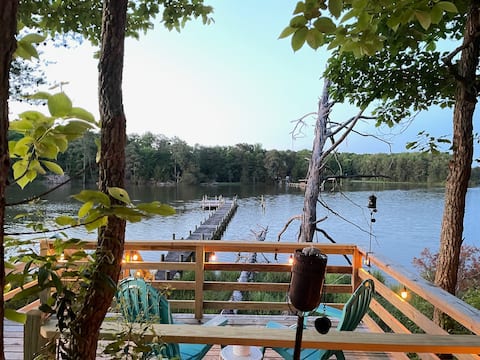
6 acres of privacy - water access/firepit/kayaks
Entire Place • 1 bedroom
Blue Pearl Cottage
Entire Place • 2 bedrooms

Town retreat with river view “Urban Pearl”
Entire Place • 3 bedrooms
Note: Performance varies based on location, size, amenities, seasonality, and management quality. Data reflects the past 12 months.
Top Performing Airbnb Hosts in Urbanna (2025)
Learn from the best! This table showcases top-performing Airbnb hosts in Urbanna based on the number of properties managed and estimated total revenue over the past year. Analyze their scale and performance metrics.
| Host Name | Properties | Grossing Revenue | Stay Reviews | Avg Rating |
|---|---|---|---|---|
| Evolve | 3 | $245,107 | 156 | 4.89/5.0 |
| Sarah | 1 | $77,399 | 17 | 4.94/5.0 |
| Kathryn | 1 | $53,653 | 85 | 4.95/5.0 |
| Ned & Holly | 2 | $51,054 | 278 | 4.91/5.0 |
| Ben And Ashley | 1 | $46,126 | 73 | 5.00/5.0 |
| Shawn | 1 | $42,513 | 45 | 4.96/5.0 |
| Lauren | 1 | $41,188 | 16 | 4.88/5.0 |
| Debra | 1 | $39,358 | 25 | 4.96/5.0 |
| Michael | 1 | $31,842 | 269 | 4.82/5.0 |
| Andrew | 2 | $26,264 | 144 | 4.96/5.0 |
Analyzing the strategies of top hosts, such as their property selection, pricing, and guest communication, can offer valuable lessons for optimizing your own Airbnb operations in Urbanna.
Dive Deeper: Advanced Urbanna STR Market Data (2025)
Ready to unlock more insights? AirROI provides access to advanced metrics and comprehensive Airbnb data for Urbanna. Explore detailed analytics beyond this report to refine your investment strategy, optimize pricing, and maximize your vacation rental profits.
Explore Advanced MetricsUrbanna Short-Term Rental Market Composition (2025): Property & Room Types
Room Type Distribution
Property Type Distribution
Market Composition Insights for Urbanna
- The Urbanna Airbnb market composition is heavily skewed towards Entire Home/Apt listings, which make up 94.4% of the 18 active rentals. This indicates strong guest preference for privacy and space.
- Looking at the property type distribution in Urbanna, House properties are the most common (72.2%), reflecting the local real estate landscape.
- Houses represent a significant 72.2% portion, catering likely to families or larger groups.
Urbanna Airbnb Room Capacity Analysis (2025): Bedroom Distribution
Distribution of Listings by Number of Bedrooms
Room Capacity Insights for Urbanna
- The dominant room capacity in Urbanna is 3 bedrooms listings, making up 55.6% of the market. This suggests a strong demand for properties suitable for families or small groups.
- Together, 3 bedrooms and 1 bedroom properties represent 77.8% of the active Airbnb listings in Urbanna, indicating a high concentration in these sizes.
- A significant 55.6% of listings offer 3+ bedrooms, catering to larger groups and families seeking more space in Urbanna.
Urbanna Vacation Rental Guest Capacity Trends (2025)
Distribution of Listings by Guest Capacity
Guest Capacity Insights for Urbanna
- The most common guest capacity trend in Urbanna vacation rentals is listings accommodating 6 guests (44.4%). This suggests the primary traveler segment is likely larger groups.
- Properties designed for 6 guests and 8+ guests dominate the Urbanna STR market, accounting for 61.1% of listings.
- 66.7% of properties accommodate 6+ guests, serving the market segment for larger families or group travel in Urbanna.
- On average, properties in Urbanna are equipped to host 5.4 guests.
Urbanna Airbnb Booking Patterns (2025): Available vs. Booked Days
Available Days Distribution
Booked Days Distribution
Booking Pattern Insights for Urbanna
- The most common availability pattern in Urbanna falls within the 91-180 days range, representing 38.9% of listings. This suggests many properties have significant open periods on their calendars.
- Approximately 50.0% of listings show high availability (181+ days open annually), indicating potential for increased bookings or specific owner usage patterns.
- For booked days, the 181-270 days range is most frequent in Urbanna (33.3%), reflecting common guest stay durations or potential owner blocking patterns.
- A notable 50.0% of properties secure long booking periods (181+ days booked per year), highlighting successful long-term rental strategies or significant owner usage.
Urbanna Airbnb Minimum Stay Requirements Analysis
Distribution of Listings by Minimum Night Requirement
1 Night
2 listings
11.1% of total
2 Nights
13 listings
72.2% of total
30+ Nights
3 listings
16.7% of total
Key Insights
- The most prevalent minimum stay requirement in Urbanna is 2 Nights, adopted by 72.2% of listings. This highlights the market's preference for shorter, flexible bookings.
- A strong majority (83.3%) of the Urbanna Airbnb data shows acceptance of very short stays (1-2 nights), indicating a dynamic, high-turnover market.
- A significant segment (16.7%) caters to monthly stays (30+ nights) in Urbanna, pointing to opportunities in the extended-stay market.
Recommendations
- Align with the market by considering a 2 Nights minimum stay, as 72.2% of Urbanna hosts use this setting.
- If feasible, allowing 1-night stays, especially midweek or during low season, could capture last-minute bookings, as only 11.1% currently do.
- A 2-night minimum appears standard (72.2%). Consider this for weekends or peak periods.
- Explore offering discounts for stays of 30+ nights to attract the 16.7% of the market seeking extended stays.
- Adjust minimum nights based on seasonality – potentially shorter during low season and longer during peak demand periods in Urbanna.
Urbanna Airbnb Cancellation Policy Trends Analysis (2025)
Flexible
4 listings
22.2% of total
Moderate
7 listings
38.9% of total
Firm
3 listings
16.7% of total
Strict
4 listings
22.2% of total
Cancellation Policy Insights for Urbanna
- The prevailing Airbnb cancellation policy trend in Urbanna is Moderate, used by 38.9% of listings.
- There's a relatively balanced mix between guest-friendly (61.1%) and stricter (38.9%) policies, offering choices for different guest needs.
Recommendations for Hosts
- Consider adopting a Moderate policy to align with the 38.9% market standard in Urbanna.
- Regularly review your cancellation policy against competitors and market demand shifts in Urbanna.
Urbanna STR Booking Lead Time Analysis (2025)
Average Booking Lead Time by Month
Booking Lead Time Insights for Urbanna
- The overall average booking lead time for vacation rentals in Urbanna is 72 days.
- Guests book furthest in advance for stays during July (average 93 days), likely coinciding with peak travel demand or local events.
- The shortest booking windows occur for stays in January (average 11 days), indicating more last-minute travel plans during this time.
- Seasonally, Summer (75 days avg.) sees the longest lead times, while Winter (17 days avg.) has the shortest, reflecting typical travel planning cycles.
Recommendations for Hosts
- Use the overall average lead time (72 days) as a baseline for your pricing and availability strategy in Urbanna.
- For July stays, consider implementing length-of-stay discounts or slightly higher rates for bookings made less than 93 days out to capitalize on advance planning.
- During January, focus on last-minute booking availability and promotions, as guests book with very short notice (11 days avg.).
- Target marketing efforts for the Summer season well in advance (at least 75 days) to capture early planners.
- Monitor your own booking lead times against these Urbanna averages to identify opportunities for dynamic pricing adjustments.
Popular & Essential Airbnb Amenities in Urbanna (2025)
Amenity Prevalence
Amenity Insights for Urbanna
- Essential amenities in Urbanna that guests expect include: Wifi, Kitchen, Free parking on premises, Smoke alarm, Heating, Coffee maker, Air conditioning. Lacking these (any) could significantly impact bookings.
- Popular amenities like Refrigerator, Fire extinguisher, Dishes and silverware are common but not universal. Offering these can provide a competitive edge.
Recommendations for Hosts
- Ensure your listing includes all essential amenities for Urbanna: Wifi, Kitchen, Free parking on premises, Smoke alarm, Heating, Coffee maker, Air conditioning.
- Consider adding popular differentiators like Refrigerator or Fire extinguisher to increase appeal.
- Highlight unique or less common amenities you offer (e.g., hot tub, dedicated workspace, EV charger) in your listing description and photos.
- Regularly check competitor amenities in Urbanna to stay competitive.
Urbanna Airbnb Guest Demographics & Profile Analysis (2025)
Guest Profile Summary for Urbanna
- The typical guest profile for Airbnb in Urbanna consists of primarily domestic travelers (93%), often arriving from nearby Richmond, typically belonging to the Post-2000s (Gen Z/Alpha) group (50%), primarily speaking English or Spanish.
- Domestic travelers account for 92.6% of guests.
- Key international markets include United States (92.6%) and DC (6.3%).
- Top languages spoken are English (82.9%) followed by Spanish (6.6%).
- A significant demographic segment is the Post-2000s (Gen Z/Alpha) group, representing 50% of guests.
Recommendations for Hosts
- Target domestic marketing efforts towards travelers from Richmond and Washington.
- Tailor amenities and listing descriptions to appeal to the dominant Post-2000s (Gen Z/Alpha) demographic (e.g., highlight fast WiFi, smart home features, local guides).
- Highlight unique local experiences or amenities relevant to the primary guest profile.
- Consider seasonal promotions aligned with peak travel times for key origin markets.
Nearby Short-Term Rental Market Comparison
How does the Urbanna Airbnb market stack up against its neighbors? Compare key performance metrics like average monthly revenue, ADR, and occupancy rates in surrounding areas to understand the broader regional STR landscape.
| Market | Active Properties | Monthly Revenue | Daily Rate | Avg. Occupancy |
|---|---|---|---|---|
| Mayo | 14 | $5,935 | $459.51 | 47% |
| Stevensville | 78 | $5,817 | $572.74 | 40% |
| Arundel on the Bay | 31 | $5,161 | $502.88 | 39% |
| Easton | 43 | $5,117 | $665.12 | 38% |
| Mineral | 201 | $5,065 | $473.03 | 35% |
| Bumpass | 100 | $5,015 | $559.63 | 32% |
| Chester | 17 | $4,906 | $513.17 | 41% |
| Weems | 12 | $4,816 | $412.28 | 46% |
| Queenstown | 22 | $4,741 | $619.26 | 34% |
| Littleton | 119 | $4,655 | $497.10 | 39% |