Stanley Airbnb Market Analysis 2026: Short Term Rental Data & Vacation Rental Statistics in Virginia, United States
Is Airbnb profitable in Stanley in 2026? Explore comprehensive Airbnb analytics for Stanley, Virginia, United States to uncover income potential. This 2026 STR market report for Stanley, based on AirROI data from February 2025 to January 2026, reveals key trends in the niche market of 103 active listings.
Whether you're considering an Airbnb investment in Stanley, optimizing your existing vacation rental, or exploring rental arbitrage opportunities, understanding the Stanley Airbnb data is crucial. Leveraging the low regulation environment is key to maximizing your short term rental income potential. Let's dive into the specifics.
Key Stanley Airbnb Performance Metrics Overview
Monthly Airbnb Revenue Variations & Income Potential in Stanley (2026)
Understanding the monthly revenue variations for Airbnb listings in Stanley is key to maximizing your short term rental income potential. Seasonality significantly impacts earnings. Our analysis, based on data from the past 12 months, shows that the peak revenue month for STRs in Stanley is typically October, while February often presents the lowest earnings, highlighting opportunities for strategic pricing adjustments during shoulder and low seasons. Explore the typical Airbnb income in Stanley across different performance tiers:
- Best-in-class properties (Top 10%) achieve $9,919+ monthly, often utilizing dynamic pricing and superior guest experiences.
- Strong performing properties (Top 25%) earn $6,631 or more, indicating effective management and desirable locations/amenities.
- Typical properties (Median) generate around $3,892 per month, representing the average market performance.
- Entry-level properties (Bottom 25%) see earnings around $2,141, often with potential for optimization.
Average Monthly Airbnb Earnings Trend in Stanley
Stanley Airbnb Occupancy Rate Trends (2026)
Maximize your bookings by understanding the Stanley STR occupancy trends. Seasonal demand shifts significantly influence how often properties are booked. Typically, Octobersees the highest demand (peak season occupancy), while January experiences the lowest (low season). Effective strategies, like adjusting minimum stays or offering promotions, can boost occupancy during slower periods. Here's how different property tiers perform in Stanley:
- Best-in-class properties (Top 10%) achieve 83%+ occupancy, indicating high desirability and potentially optimized availability.
- Strong performing properties (Top 25%) maintain 71% or higher occupancy, suggesting good market fit and guest satisfaction.
- Typical properties (Median) have an occupancy rate around 47%.
- Entry-level properties (Bottom 25%) average 25% occupancy, potentially facing higher vacancy.
Average Monthly Occupancy Rate Trend in Stanley
Average Daily Rate (ADR) Airbnb Trends in Stanley (2026)
Effective short term rental pricing strategy in Stanley involves understanding monthly ADR fluctuations. The Average Daily Rate (ADR) for Airbnb in Stanley typically peaks in October and dips lowest during February. Leveraging Airbnb dynamic pricing tools or strategies based on this seasonality can significantly boost revenue. Here's a look at the typical nightly rates achieved:
- Best-in-class properties (Top 10%) command rates of $541+ per night, often due to premium features or locations.
- Strong performing properties (Top 25%) achieve nightly rates of $361 or more.
- Typical properties (Median) charge around $270 per night.
- Entry-level properties (Bottom 25%) earn around $198 per night.
Average Daily Rate (ADR) Trend by Month in Stanley
Get Live Stanley Market Intelligence 👇

Explore Real-time Analytics
Airbnb Seasonality Analysis & Trends in Stanley (2026)
Peak Season (October, August, November)
- Revenue averages $6,297 per month
- Occupancy rates average 56.0%
- Daily rates average $344
Shoulder Season
- Revenue averages $5,045 per month
- Occupancy maintains around 47.9%
- Daily rates hold near $317
Low Season (January, February, March)
- Revenue drops to average $3,795 per month
- Occupancy decreases to average 41.4%
- Daily rates adjust to average $289
Seasonality Insights for Stanley
- The Airbnb seasonality in Stanley shows highly seasonal trends requiring careful strategy. While the sections above show seasonal averages, it's also insightful to look at the extremes:
- During the high season, the absolute peak month showcases Stanley's highest earning potential, with monthly revenues capable of climbing to $7,393, occupancy reaching a high of 62.5%, and ADRs peaking at $369.
- Conversely, the slowest single month of the year, typically falling within the low season, marks the market's lowest point. In this month, revenue might dip to $3,452, occupancy could drop to 37.1%, and ADRs may adjust down to $271.
- Understanding both the seasonal averages and these monthly peaks and troughs in revenue, occupancy, and ADR is crucial for maximizing your Airbnb profit potential in Stanley.
Seasonal Strategies for Maximizing Profit
- Peak Season: Maximize revenue through premium pricing and potentially longer minimum stays. Ensure high availability.
- Low Season: Offer competitive pricing, special promotions (e.g., extended stay discounts), and flexible cancellation policies. Target off-season travelers like remote workers or budget-conscious guests.
- Shoulder Seasons: Implement dynamic pricing that balances peak and low rates. Target weekend travelers or specific events. Offer slightly more flexible terms than peak season.
- Regularly analyze your own performance against these Stanley seasonality benchmarks and adjust your pricing and availability strategy accordingly.
Best Areas for Airbnb Investment in Stanley (2026)
Exploring the top neighborhoods for short-term rentals in Stanley? This section highlights key areas, outlining why they are attractive for hosts and guests, along with notable local attractions. Consider these locations based on your target guest profile and investment strategy.
| Neighborhood / Area | Why Host Here? (Target Guests & Appeal) | Key Attractions & Landmarks |
|---|---|---|
| Shenandoah National Park | A stunning national park known for its beautiful landscapes, hiking trails, and outdoor adventures. Ideal for tourists who love nature and want to explore the Blue Ridge Mountains. | Skyline Drive, Old Rag Mountain, Hawksbill Mountain, Dark Hollow Falls, Shenandoah River |
| Luray Caverns | Famous for its impressive limestone caverns and underground formations. A popular destination for families and adventure seekers. | Luray Caverns, Luray Valley Museum, The Car and Carriage Caravan Museum, natural bridge, cottage rentals |
| Downtown Luray | Charming historic district offering various shops, restaurants, and a picturesque small-town atmosphere. Great for visitors looking for local culture and dining. | Luray Singing Tower, Civil War Museum, local boutiques, cafes, the scenic riverwalk |
| Sperryville | A quaint village located near the entrance of Shenandoah National Park. Perfect for visitors looking for a peaceful retreat with local art and cuisine. | Copper Fox Distillery, Rappahannock River, local art galleries, farm-to-table restaurants, nature trails |
| Front Royal | Known as the 'Gateway to the Shenandoah' with its proximity to the national park. Great for visitors who want both outdoor adventures and town amenities. | Front Royal Historic District, Belle Boyd Cottage, Skyline Caverns, Riverton, local shops and restaurants |
| Winchester | A historic city with rich Civil War history and an array of activities and sites to explore. Sue for tourists looking for history and entertainment. | Museum of the Shenandoah Valley, Old Town Winchester, Shenandoah University, Abram's Delight, local wineries |
| Harpers Ferry | A historic town at the confluence of two rivers, known for its hiking, biking, and rich history. Popular among outdoor enthusiasts and history buffs. | Harpers Ferry National Historical Park, John Brown's Fort, Appalachian Trail, Potomac and Shenandoah Rivers, local art and history |
| Massanutten Resort | A four-season resort offering skiing, snowboarding, and family activities. A fantastic option for tourists seeking year-round recreation. | Ski Resort, Water Park, Golf Course, Mountain Biking, Spa Services |
Understanding Airbnb License Requirements & STR Laws in Stanley (2026)
While Stanley, Virginia, United States currently shows low STR regulations, specific Airbnb license requirements might still exist or change. Always verify the latest short term rental regulations and Airbnb license requirements directly with local government authorities for Stanley to ensure full compliance before hosting.
(Source: AirROI data, 2026, finding no licensed listings among those analyzed)
Top Performing Airbnb Properties in Stanley (2026)
Benchmark your potential! Explore examples of top-performing Airbnb properties in Stanleybased on Trailing Twelve Month (TTM) revenue. Analyze their characteristics, revenue, occupancy rate, and ADR to understand what drives success in this market.

Shenandoah Yurt: Hot Tub~Wood Stove~WiFi~EVcharger
Entire Place • 3 bedrooms
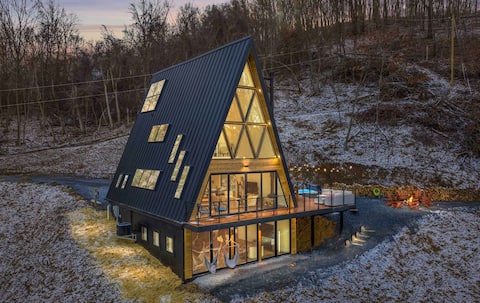
Ava A-Frame•Hot Tub•Theater•Hidden Stair•EV Charge
Entire Place • 4 bedrooms

New, 5BD/4BA | hot tub, arcade, pool table, views
Entire Place • 5 bedrooms
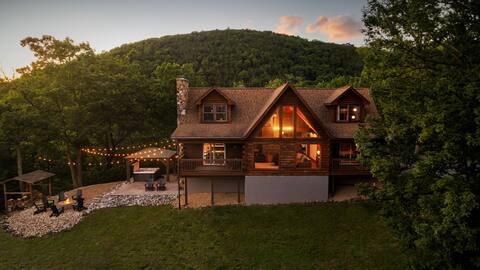
Bearloga:Hot Tub, Sauna, Stunning Views, 75 acres
Entire Place • 4 bedrooms

Peaceful 5-bedroom cabin - hot tub, views, office
Entire Place • 5 bedrooms

The Gramophone - Romantic Valley Retreat
Entire Place • 1 bedroom
Note: Performance varies based on location, size, amenities, seasonality, and management quality. Data reflects the past 12 months.
Top Performing Airbnb Hosts in Stanley (2026)
Learn from the best! This table showcases top-performing Airbnb hosts in Stanley based on the number of properties managed and estimated total revenue over the past year. Analyze their scale and performance metrics.
| Host Name | Properties | Grossing Revenue | Stay Reviews | Avg Rating |
|---|---|---|---|---|
| Robert | 3 | $425,528 | 1300 | 4.98/5.0 |
| Bobby | 4 | $388,533 | 693 | 4.93/5.0 |
| Julia | 3 | $337,211 | 520 | 4.96/5.0 |
| Jim And Lisa | 5 | $300,928 | 884 | 4.97/5.0 |
| Vitaliy | 1 | $283,479 | 241 | 4.95/5.0 |
| Ava Shenandoah | 1 | $261,344 | 132 | 4.98/5.0 |
| Jason | 9 | $230,921 | 235 | 4.89/5.0 |
| Jeremy | 4 | $222,649 | 77 | 4.53/5.0 |
| Sam | 1 | $140,745 | 117 | 4.97/5.0 |
| Roseline | 2 | $139,735 | 143 | 4.96/5.0 |
Analyzing the strategies of top hosts, such as their property selection, pricing, and guest communication, can offer valuable lessons for optimizing your own Airbnb operations in Stanley.
Dive Deeper: Advanced Stanley STR Market Data (2026)
Ready to unlock more insights? AirROI provides access to advanced metrics and comprehensive Airbnb data for Stanley. Explore detailed analytics beyond this report to refine your investment strategy, optimize pricing, and maximize your vacation rental profits.
Explore Advanced MetricsStanley Short-Term Rental Market Composition (2026): Property & Room Types
Room Type Distribution
Property Type Distribution
Market Composition Insights for Stanley
- The Stanley Airbnb market composition is heavily skewed towards Entire Home/Apt listings, which make up 99% of the 103 active rentals. This indicates strong guest preference for privacy and space.
- Looking at the property type distribution in Stanley, Outdoor/Unique properties are the most common (60.2%), reflecting the local real estate landscape.
- Houses represent a significant 31.1% portion, catering likely to families or larger groups.
- Smaller segments like unique stays, hotel/boutique, others, apartment/condo (combined 8.7%) offer potential for unique stay experiences.
Stanley Airbnb Room Capacity Analysis (2026): Bedroom Distribution
Distribution of Listings by Number of Bedrooms
Room Capacity Insights for Stanley
- The dominant room capacity in Stanley is 3 bedrooms listings, making up 31.1% of the market. This suggests a strong demand for properties suitable for families or small groups.
- Together, 3 bedrooms and 2 bedrooms properties represent 53.4% of the active Airbnb listings in Stanley, indicating a high concentration in these sizes.
- A significant 51.5% of listings offer 3+ bedrooms, catering to larger groups and families seeking more space in Stanley.
Stanley Vacation Rental Guest Capacity Trends (2026)
Distribution of Listings by Guest Capacity
Guest Capacity Insights for Stanley
- The most common guest capacity trend in Stanley vacation rentals is listings accommodating 8+ guests (31.1%). This suggests the primary traveler segment is likely larger groups.
- Properties designed for 8+ guests and 4 guests dominate the Stanley STR market, accounting for 56.3% of listings.
- 54.4% of properties accommodate 6+ guests, serving the market segment for larger families or group travel in Stanley.
- On average, properties in Stanley are equipped to host 5.5 guests.
Stanley Airbnb Booking Patterns (2026): Available vs. Booked Days
Available Days Distribution
Booked Days Distribution
Booking Pattern Insights for Stanley
- The most common availability pattern in Stanley falls within the 181-270 days range, representing 30.1% of listings. This suggests many properties have significant open periods on their calendars.
- Approximately 59.2% of listings show high availability (181+ days open annually), indicating potential for increased bookings or specific owner usage patterns.
- For booked days, the 91-180 days range is most frequent in Stanley (32%), reflecting common guest stay durations or potential owner blocking patterns.
- A notable 42.7% of properties secure long booking periods (181+ days booked per year), highlighting successful long-term rental strategies or significant owner usage.
Stanley Airbnb Minimum Stay Requirements Analysis
Distribution of Listings by Minimum Night Requirement
1 Night
15 listings
14.6% of total
2 Nights
50 listings
48.5% of total
3 Nights
2 listings
1.9% of total
30+ Nights
36 listings
35% of total
Key Insights
- The most prevalent minimum stay requirement in Stanley is 2 Nights, adopted by 48.5% of listings. This highlights the market's preference for shorter, flexible bookings.
- A strong majority (63.1%) of the Stanley Airbnb data shows acceptance of very short stays (1-2 nights), indicating a dynamic, high-turnover market.
- A significant segment (35%) caters to monthly stays (30+ nights) in Stanley, pointing to opportunities in the extended-stay market.
Recommendations
- Align with the market by considering a 2 Nights minimum stay, as 48.5% of Stanley hosts use this setting.
- If feasible, allowing 1-night stays, especially midweek or during low season, could capture last-minute bookings, as only 14.6% currently do.
- A 2-night minimum appears standard (48.5%). Consider this for weekends or peak periods.
- Explore offering discounts for stays of 30+ nights to attract the 35% of the market seeking extended stays.
- Adjust minimum nights based on seasonality – potentially shorter during low season and longer during peak demand periods in Stanley.
Stanley Airbnb Cancellation Policy Trends Analysis (2026)
Limited
7 listings
6.8% of total
Super Strict 30 Days
6 listings
5.8% of total
Flexible
16 listings
15.5% of total
Moderate
22 listings
21.4% of total
Firm
41 listings
39.8% of total
Strict
11 listings
10.7% of total
Cancellation Policy Insights for Stanley
- The prevailing Airbnb cancellation policy trend in Stanley is Firm, used by 39.8% of listings.
- A majority (50.5%) of hosts in Stanley utilize Firm or Strict policies, indicating a market where hosts prioritize booking security.
Recommendations for Hosts
- Consider adopting a Firm policy to align with the 39.8% market standard in Stanley.
- Using a Strict policy might deter some guests, as only 10.7% of listings use it. Evaluate if potential revenue protection outweighs possible lower booking rates.
- Regularly review your cancellation policy against competitors and market demand shifts in Stanley.
Stanley STR Booking Lead Time Analysis (2026)
Average Booking Lead Time by Month
Booking Lead Time Insights for Stanley
- The overall average booking lead time for vacation rentals in Stanley is 46 days.
- Guests book furthest in advance for stays during October (average 60 days), likely coinciding with peak travel demand or local events.
- The shortest booking windows occur for stays in February (average 31 days), indicating more last-minute travel plans during this time.
- Seasonally, Fall (54 days avg.) sees the longest lead times, while Winter (35 days avg.) has the shortest, reflecting typical travel planning cycles.
Recommendations for Hosts
- Use the overall average lead time (46 days) as a baseline for your pricing and availability strategy in Stanley.
- For October stays, consider implementing length-of-stay discounts or slightly higher rates for bookings made less than 60 days out to capitalize on advance planning.
- Target marketing efforts for the Fall season well in advance (at least 54 days) to capture early planners.
- Monitor your own booking lead times against these Stanley averages to identify opportunities for dynamic pricing adjustments.
Popular & Essential Airbnb Amenities in Stanley (2026)
Amenity Prevalence
Amenity Insights for Stanley
- Essential amenities in Stanley that guests expect include: TV, Air conditioning, Heating, Smoke alarm, Free parking on premises, Hot water, Wifi, Refrigerator, Fire extinguisher, Kitchen. Lacking these (any) could significantly impact bookings.
Recommendations for Hosts
- Ensure your listing includes all essential amenities for Stanley: TV, Air conditioning, Heating, Smoke alarm, Free parking on premises, Hot water, Wifi, Refrigerator, Fire extinguisher, Kitchen.
- Prioritize adding missing essentials: TV, Air conditioning, Heating, Smoke alarm, Free parking on premises, Hot water, Wifi, Refrigerator, Fire extinguisher, Kitchen.
- Highlight unique or less common amenities you offer (e.g., hot tub, dedicated workspace, EV charger) in your listing description and photos.
- Regularly check competitor amenities in Stanley to stay competitive.
Stanley Airbnb Guest Demographics & Profile Analysis (2026)
Guest Profile Summary for Stanley
- The typical guest profile for Airbnb in Stanley consists of primarily domestic travelers (90%), often arriving from nearby Washington, typically belonging to the Post-2000s (Gen Z/Alpha) group (50%), primarily speaking English or Spanish.
- Domestic travelers account for 89.8% of guests.
- Key international markets include United States (89.8%) and DC (7.4%).
- Top languages spoken are English (67.4%) followed by Spanish (12.7%).
- A significant demographic segment is the Post-2000s (Gen Z/Alpha) group, representing 50% of guests.
Recommendations for Hosts
- Target domestic marketing efforts towards travelers from Washington and Richmond.
- Tailor amenities and listing descriptions to appeal to the dominant Post-2000s (Gen Z/Alpha) demographic (e.g., highlight fast WiFi, smart home features, local guides).
- Highlight unique local experiences or amenities relevant to the primary guest profile.
- Consider seasonal promotions aligned with peak travel times for key origin markets.
Nearby Short-Term Rental Market Comparison
How does the Stanley Airbnb market stack up against its neighbors? Compare key performance metrics like average monthly revenue, ADR, and occupancy rates in surrounding areas to understand the broader regional STR landscape.
| Market | Active Properties | Monthly Revenue | Daily Rate | Avg. Occupancy |
|---|---|---|---|---|
| McGaheysville | 83 | $6,156 | $431.72 | 45% |
| Shannondale | 45 | $5,808 | $337.30 | 54% |
| Penhook | 18 | $5,675 | $678.75 | 37% |
| Bentonville | 23 | $5,372 | $420.82 | 51% |
| Nellysford | 62 | $5,276 | $426.33 | 39% |
| Bumpass | 120 | $4,851 | $553.01 | 33% |
| Mineral | 231 | $4,800 | $474.55 | 36% |
| Shenandoah | 104 | $4,778 | $354.44 | 47% |
| Middleburg | 39 | $4,681 | $485.11 | 41% |
| Skyland Estates | 14 | $4,649 | $280.30 | 55% |