Shenandoah Airbnb Market Analysis 2026: Short Term Rental Data & Vacation Rental Statistics in Virginia, United States
Is Airbnb profitable in Shenandoah in 2026? Explore comprehensive Airbnb analytics for Shenandoah, Virginia, United States to uncover income potential. This 2026 STR market report for Shenandoah, based on AirROI data from February 2025 to January 2026, reveals key trends in the niche market of 104 active listings.
Whether you're considering an Airbnb investment in Shenandoah, optimizing your existing vacation rental, or exploring rental arbitrage opportunities, understanding the Shenandoah Airbnb data is crucial. Leveraging the low regulation environment is key to maximizing your short term rental income potential. Let's dive into the specifics.
Key Shenandoah Airbnb Performance Metrics Overview
Monthly Airbnb Revenue Variations & Income Potential in Shenandoah (2026)
Understanding the monthly revenue variations for Airbnb listings in Shenandoah is key to maximizing your short term rental income potential. Seasonality significantly impacts earnings. Our analysis, based on data from the past 12 months, shows that the peak revenue month for STRs in Shenandoah is typically October, while February often presents the lowest earnings, highlighting opportunities for strategic pricing adjustments during shoulder and low seasons. Explore the typical Airbnb income in Shenandoah across different performance tiers:
- Best-in-class properties (Top 10%) achieve $10,372+ monthly, often utilizing dynamic pricing and superior guest experiences.
- Strong performing properties (Top 25%) earn $6,789 or more, indicating effective management and desirable locations/amenities.
- Typical properties (Median) generate around $3,993 per month, representing the average market performance.
- Entry-level properties (Bottom 25%) see earnings around $2,284, often with potential for optimization.
Average Monthly Airbnb Earnings Trend in Shenandoah
Shenandoah Airbnb Occupancy Rate Trends (2026)
Maximize your bookings by understanding the Shenandoah STR occupancy trends. Seasonal demand shifts significantly influence how often properties are booked. Typically, Julysees the highest demand (peak season occupancy), while February experiences the lowest (low season). Effective strategies, like adjusting minimum stays or offering promotions, can boost occupancy during slower periods. Here's how different property tiers perform in Shenandoah:
- Best-in-class properties (Top 10%) achieve 80%+ occupancy, indicating high desirability and potentially optimized availability.
- Strong performing properties (Top 25%) maintain 66% or higher occupancy, suggesting good market fit and guest satisfaction.
- Typical properties (Median) have an occupancy rate around 46%.
- Entry-level properties (Bottom 25%) average 30% occupancy, potentially facing higher vacancy.
Average Monthly Occupancy Rate Trend in Shenandoah
Average Daily Rate (ADR) Airbnb Trends in Shenandoah (2026)
Effective short term rental pricing strategy in Shenandoah involves understanding monthly ADR fluctuations. The Average Daily Rate (ADR) for Airbnb in Shenandoah typically peaks in October and dips lowest during March. Leveraging Airbnb dynamic pricing tools or strategies based on this seasonality can significantly boost revenue. Here's a look at the typical nightly rates achieved:
- Best-in-class properties (Top 10%) command rates of $530+ per night, often due to premium features or locations.
- Strong performing properties (Top 25%) achieve nightly rates of $378 or more.
- Typical properties (Median) charge around $289 per night.
- Entry-level properties (Bottom 25%) earn around $216 per night.
Average Daily Rate (ADR) Trend by Month in Shenandoah
Get Live Shenandoah Market Intelligence 👇

Explore Real-time Analytics
Airbnb Seasonality Analysis & Trends in Shenandoah (2026)
Peak Season (October, July, November)
- Revenue averages $7,069 per month
- Occupancy rates average 56.1%
- Daily rates average $386
Shoulder Season
- Revenue averages $5,331 per month
- Occupancy maintains around 48.3%
- Daily rates hold near $347
Low Season (January, February, March)
- Revenue drops to average $3,651 per month
- Occupancy decreases to average 40.1%
- Daily rates adjust to average $316
Seasonality Insights for Shenandoah
- The Airbnb seasonality in Shenandoah shows highly seasonal trends requiring careful strategy. While the sections above show seasonal averages, it's also insightful to look at the extremes:
- During the high season, the absolute peak month showcases Shenandoah's highest earning potential, with monthly revenues capable of climbing to $7,311, occupancy reaching a high of 58.7%, and ADRs peaking at $418.
- Conversely, the slowest single month of the year, typically falling within the low season, marks the market's lowest point. In this month, revenue might dip to $3,158, occupancy could drop to 38.5%, and ADRs may adjust down to $293.
- Understanding both the seasonal averages and these monthly peaks and troughs in revenue, occupancy, and ADR is crucial for maximizing your Airbnb profit potential in Shenandoah.
Seasonal Strategies for Maximizing Profit
- Peak Season: Maximize revenue through premium pricing and potentially longer minimum stays. Ensure high availability.
- Low Season: Offer competitive pricing, special promotions (e.g., extended stay discounts), and flexible cancellation policies. Target off-season travelers like remote workers or budget-conscious guests.
- Shoulder Seasons: Implement dynamic pricing that balances peak and low rates. Target weekend travelers or specific events. Offer slightly more flexible terms than peak season.
- Regularly analyze your own performance against these Shenandoah seasonality benchmarks and adjust your pricing and availability strategy accordingly.
Best Areas for Airbnb Investment in Shenandoah (2026)
Exploring the top neighborhoods for short-term rentals in Shenandoah? This section highlights key areas, outlining why they are attractive for hosts and guests, along with notable local attractions. Consider these locations based on your target guest profile and investment strategy.
| Neighborhood / Area | Why Host Here? (Target Guests & Appeal) | Key Attractions & Landmarks |
|---|---|---|
| Historic Downtown | Charming area with picturesque streets, historic buildings, and a vibrant local community. Ideal for tourists looking to experience the unique history and culture of the Shenandoah Valley. | Shenandoah Valley Museum, Woodward Historic House, local shops and restaurants, Luray Caverns, Outdoor activities around the valley |
| Luray | Well-known for the Luray Caverns and outdoor activities. Great location for families and adventure seekers looking for a fun getaway in nature. | Luray Caverns, Skyline Drive, George Washington National Forest, Luray Hops Farm, Lake Arrowhead |
| Big Meadows | A stunning area within Shenandoah National Park, Big Meadows is perfect for nature lovers and hikers. It attracts visitors looking to immerse themselves in the great outdoors. | Shenandoah National Park, Skyline Drive, Big Meadows Lodge, hiking trails, nature photography opportunities |
| Front Royal | Gateway to Skyline Drive and Shenandoah National Park, it draws many visitors for its scenic views and outdoor activities, making it a hot spot for Airbnb hosts. | Skyline Drive access, Virginia Safari Park, Blue Ridge Shadows Golf Club, Historic Main Street, Shenandoah River |
| Stanley | A small town with close proximity to natural attractions, it is becoming increasingly popular with those wanting a quiet retreat surrounded by nature. | Meadows of Dan, Hiking trails to Old Rag Mountain, local vineyards, Shenandoah River State Park |
| New Market | Rich in Civil War history, this charming town offers a unique blend of history and natural beauty, appealing to history buffs and outdoor enthusiasts alike. | New Market Battlefield State Historical Park, local wineries, Shenandoah Caverns, Historic downtown area |
| Woodstock | A quaint town located near the North Fork of the Shenandoah River, known for its friendly atmosphere and outdoor recreation options. | North Fork of the Shenandoah River, local breweries, Woodstock Museum, hiking trails in the area |
| Edinburg | This small town offers serene beauty and access to the Massanutten region, appealing to vacationers looking for a peaceful escape. | Massanutten Mountain, Edinburg Mill, local historic sites, outdoor recreational activities, hiking trails |
Understanding Airbnb License Requirements & STR Laws in Shenandoah (2026)
While Shenandoah, Virginia, United States currently shows low STR regulations, specific Airbnb license requirements might still exist or change. Always verify the latest short term rental regulations and Airbnb license requirements directly with local government authorities for Shenandoah to ensure full compliance before hosting.
(Source: AirROI data, 2026, based on 1% licensed listings)
Top Performing Airbnb Properties in Shenandoah (2026)
Benchmark your potential! Explore examples of top-performing Airbnb properties in Shenandoahbased on Trailing Twelve Month (TTM) revenue. Analyze their characteristics, revenue, occupancy rate, and ADR to understand what drives success in this market.
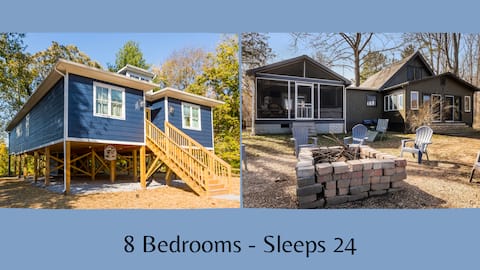
Epic River Getaway | 2 Luxe Chalets w/ Hot tubs
Entire Place • 8 bedrooms
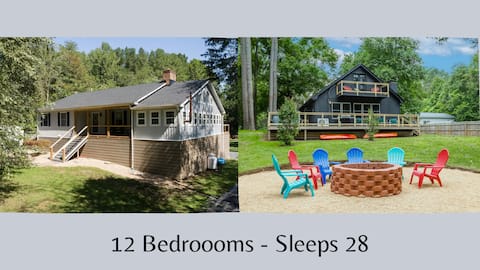
12 Bedroom Waterfront Cabins Pool Theater Game Rm
Entire Place • 12 bedrooms

Premier 5BR Cabin | Hot Tub, Game Room, 9 Beds
Entire Place • 5 bedrooms
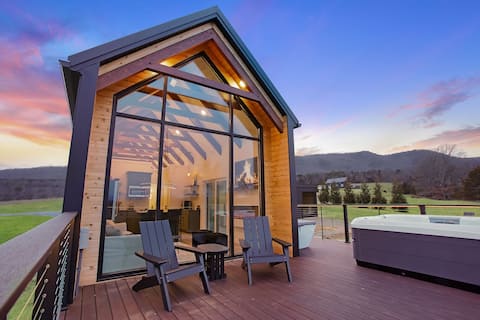
Blue Ridge Retreat 2 w/ Hot Tub/Sauna/Cold Plunge!
Entire Place • 1 bedroom
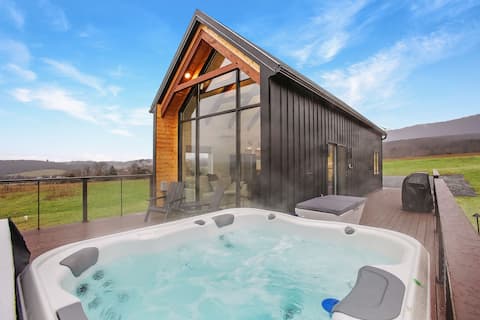
Blue Ridge Mini Lux Retreat 1 with Hot Tub & Sauna
Entire Place • 1 bedroom

Wildberry Ridge | Hot Tub, Sauna, River, Game Room
Entire Place • 3 bedrooms
Note: Performance varies based on location, size, amenities, seasonality, and management quality. Data reflects the past 12 months.
Top Performing Airbnb Hosts in Shenandoah (2026)
Learn from the best! This table showcases top-performing Airbnb hosts in Shenandoah based on the number of properties managed and estimated total revenue over the past year. Analyze their scale and performance metrics.
| Host Name | Properties | Grossing Revenue | Stay Reviews | Avg Rating |
|---|---|---|---|---|
| Brian And Sara | 6 | $811,308 | 225 | 4.53/5.0 |
| Cabins At Deer Run | 10 | $432,566 | 912 | 4.92/5.0 |
| Landon | 2 | $361,690 | 322 | 4.93/5.0 |
| Bobby | 4 | $323,042 | 794 | 4.86/5.0 |
| Winston & Katherine | 3 | $304,254 | 530 | 4.95/5.0 |
| Eugene @ Positive Stays | 1 | $215,432 | 87 | 4.94/5.0 |
| Andrea | 2 | $200,038 | 233 | 4.88/5.0 |
| Corey | 2 | $199,905 | 257 | 4.93/5.0 |
| Daniel | 1 | $164,986 | 87 | 4.97/5.0 |
| Jess And Casey | 1 | $142,365 | 117 | 4.89/5.0 |
Analyzing the strategies of top hosts, such as their property selection, pricing, and guest communication, can offer valuable lessons for optimizing your own Airbnb operations in Shenandoah.
Dive Deeper: Advanced Shenandoah STR Market Data (2026)
Ready to unlock more insights? AirROI provides access to advanced metrics and comprehensive Airbnb data for Shenandoah. Explore detailed analytics beyond this report to refine your investment strategy, optimize pricing, and maximize your vacation rental profits.
Explore Advanced MetricsShenandoah Short-Term Rental Market Composition (2026): Property & Room Types
Room Type Distribution
Property Type Distribution
Market Composition Insights for Shenandoah
- The Shenandoah Airbnb market composition is heavily skewed towards Entire Home/Apt listings, which make up 100% of the 104 active rentals. This indicates strong guest preference for privacy and space.
- Looking at the property type distribution in Shenandoah, Outdoor/Unique properties are the most common (53.8%), reflecting the local real estate landscape.
- Houses represent a significant 39.4% portion, catering likely to families or larger groups.
- Smaller segments like apartment/condo, hotel/boutique, unique stays (combined 6.8%) offer potential for unique stay experiences.
Shenandoah Airbnb Room Capacity Analysis (2026): Bedroom Distribution
Distribution of Listings by Number of Bedrooms
Room Capacity Insights for Shenandoah
- The dominant room capacity in Shenandoah is 3 bedrooms listings, making up 34.6% of the market. This suggests a strong demand for properties suitable for families or small groups.
- Together, 3 bedrooms and 2 bedrooms properties represent 56.7% of the active Airbnb listings in Shenandoah, indicating a high concentration in these sizes.
- A significant 62.5% of listings offer 3+ bedrooms, catering to larger groups and families seeking more space in Shenandoah.
Shenandoah Vacation Rental Guest Capacity Trends (2026)
Distribution of Listings by Guest Capacity
Guest Capacity Insights for Shenandoah
- The most common guest capacity trend in Shenandoah vacation rentals is listings accommodating 8+ guests (40.4%). This suggests the primary traveler segment is likely larger groups.
- Properties designed for 8+ guests and 6 guests dominate the Shenandoah STR market, accounting for 70.2% of listings.
- 76.0% of properties accommodate 6+ guests, serving the market segment for larger families or group travel in Shenandoah.
- On average, properties in Shenandoah are equipped to host 6.3 guests.
Shenandoah Airbnb Booking Patterns (2026): Available vs. Booked Days
Available Days Distribution
Booked Days Distribution
Booking Pattern Insights for Shenandoah
- The most common availability pattern in Shenandoah falls within the 181-270 days range, representing 49% of listings. This suggests many properties have significant open periods on their calendars.
- Approximately 69.2% of listings show high availability (181+ days open annually), indicating potential for increased bookings or specific owner usage patterns.
- For booked days, the 91-180 days range is most frequent in Shenandoah (48.1%), reflecting common guest stay durations or potential owner blocking patterns.
- A notable 32.7% of properties secure long booking periods (181+ days booked per year), highlighting successful long-term rental strategies or significant owner usage.
Shenandoah Airbnb Minimum Stay Requirements Analysis
Distribution of Listings by Minimum Night Requirement
1 Night
27 listings
26% of total
2 Nights
35 listings
33.7% of total
3 Nights
2 listings
1.9% of total
30+ Nights
40 listings
38.5% of total
Key Insights
- The most prevalent minimum stay requirement in Shenandoah is 30+ Nights, adopted by 38.5% of listings. This highlights the market's preference for longer commitments.
- A significant segment (38.5%) caters to monthly stays (30+ nights) in Shenandoah, pointing to opportunities in the extended-stay market.
Recommendations
- Align with the market by considering a 30+ Nights minimum stay, as 38.5% of Shenandoah hosts use this setting.
- If feasible, allowing 1-night stays, especially midweek or during low season, could capture last-minute bookings, as only 26% currently do.
- Explore offering discounts for stays of 30+ nights to attract the 38.5% of the market seeking extended stays.
- Adjust minimum nights based on seasonality – potentially shorter during low season and longer during peak demand periods in Shenandoah.
Shenandoah Airbnb Cancellation Policy Trends Analysis (2026)
Limited
6 listings
5.8% of total
Super Strict 60 Days
1 listings
1% of total
Super Strict 30 Days
1 listings
1% of total
Flexible
3 listings
2.9% of total
Moderate
33 listings
31.7% of total
Firm
42 listings
40.4% of total
Strict
18 listings
17.3% of total
Cancellation Policy Insights for Shenandoah
- The prevailing Airbnb cancellation policy trend in Shenandoah is Firm, used by 40.4% of listings.
- A majority (57.7%) of hosts in Shenandoah utilize Firm or Strict policies, indicating a market where hosts prioritize booking security.
Recommendations for Hosts
- Consider adopting a Firm policy to align with the 40.4% market standard in Shenandoah.
- Regularly review your cancellation policy against competitors and market demand shifts in Shenandoah.
Shenandoah STR Booking Lead Time Analysis (2026)
Average Booking Lead Time by Month
Booking Lead Time Insights for Shenandoah
- The overall average booking lead time for vacation rentals in Shenandoah is 45 days.
- Guests book furthest in advance for stays during May (average 67 days), likely coinciding with peak travel demand or local events.
- The shortest booking windows occur for stays in January (average 23 days), indicating more last-minute travel plans during this time.
- Seasonally, Summer (54 days avg.) sees the longest lead times, while Winter (31 days avg.) has the shortest, reflecting typical travel planning cycles.
Recommendations for Hosts
- Use the overall average lead time (45 days) as a baseline for your pricing and availability strategy in Shenandoah.
- For May stays, consider implementing length-of-stay discounts or slightly higher rates for bookings made less than 67 days out to capitalize on advance planning.
- Target marketing efforts for the Summer season well in advance (at least 54 days) to capture early planners.
- Monitor your own booking lead times against these Shenandoah averages to identify opportunities for dynamic pricing adjustments.
Popular & Essential Airbnb Amenities in Shenandoah (2026)
Amenity Prevalence
Amenity Insights for Shenandoah
- Essential amenities in Shenandoah that guests expect include: Free parking on premises, Smoke alarm, Wifi, Coffee maker, Fire extinguisher, Heating, TV, Microwave, Air conditioning, Kitchen. Lacking these (any) could significantly impact bookings.
Recommendations for Hosts
- Ensure your listing includes all essential amenities for Shenandoah: Free parking on premises, Smoke alarm, Wifi, Coffee maker, Fire extinguisher, Heating, TV, Microwave, Air conditioning, Kitchen.
- Prioritize adding missing essentials: Fire extinguisher, Heating, TV, Microwave, Air conditioning, Kitchen.
- Highlight unique or less common amenities you offer (e.g., hot tub, dedicated workspace, EV charger) in your listing description and photos.
- Regularly check competitor amenities in Shenandoah to stay competitive.
Shenandoah Airbnb Guest Demographics & Profile Analysis (2026)
Guest Profile Summary for Shenandoah
- The typical guest profile for Airbnb in Shenandoah consists of primarily domestic travelers (90%), often arriving from nearby Washington, typically belonging to the Post-2000s (Gen Z/Alpha) group (50%), primarily speaking English or Spanish.
- Domestic travelers account for 89.5% of guests.
- Key international markets include United States (89.5%) and DC (7%).
- Top languages spoken are English (69.3%) followed by Spanish (9.8%).
- A significant demographic segment is the Post-2000s (Gen Z/Alpha) group, representing 50% of guests.
Recommendations for Hosts
- Target domestic marketing efforts towards travelers from Washington and Richmond.
- Tailor amenities and listing descriptions to appeal to the dominant Post-2000s (Gen Z/Alpha) demographic (e.g., highlight fast WiFi, smart home features, local guides).
- Highlight unique local experiences or amenities relevant to the primary guest profile.
- Consider seasonal promotions aligned with peak travel times for key origin markets.
Nearby Short-Term Rental Market Comparison
How does the Shenandoah Airbnb market stack up against its neighbors? Compare key performance metrics like average monthly revenue, ADR, and occupancy rates in surrounding areas to understand the broader regional STR landscape.
| Market | Active Properties | Monthly Revenue | Daily Rate | Avg. Occupancy |
|---|---|---|---|---|
| McGaheysville | 83 | $6,156 | $431.72 | 45% |
| Shannondale | 45 | $5,808 | $337.30 | 54% |
| Penhook | 18 | $5,675 | $678.75 | 37% |
| Bentonville | 23 | $5,372 | $420.82 | 51% |
| Nellysford | 62 | $5,276 | $426.33 | 39% |
| Bumpass | 120 | $4,851 | $553.01 | 33% |
| Mineral | 231 | $4,800 | $474.55 | 36% |
| Middleburg | 39 | $4,681 | $485.11 | 41% |
| Skyland Estates | 14 | $4,649 | $280.30 | 55% |
| Castleton | 11 | $4,646 | $528.43 | 30% |