Richmond Airbnb Market Analysis 2026: Short Term Rental Data & Vacation Rental Statistics in Virginia, United States
Is Airbnb profitable in Richmond in 2026? Explore comprehensive Airbnb analytics for Richmond, Virginia, United States to uncover income potential. This 2026 STR market report for Richmond, based on AirROI data from February 2025 to January 2026, reveals key trends in the bustling market of 1,105 active listings.
Whether you're considering an Airbnb investment in Richmond, optimizing your existing vacation rental, or exploring rental arbitrage opportunities, understanding the Richmond Airbnb data is crucial. Leveraging the low regulation environment is key to maximizing your short term rental income potential. Let's dive into the specifics.
Key Richmond Airbnb Performance Metrics Overview
Monthly Airbnb Revenue Variations & Income Potential in Richmond (2026)
Understanding the monthly revenue variations for Airbnb listings in Richmond is key to maximizing your short term rental income potential. Seasonality significantly impacts earnings. Our analysis, based on data from the past 12 months, shows that the peak revenue month for STRs in Richmond is typically October, while February often presents the lowest earnings, highlighting opportunities for strategic pricing adjustments during shoulder and low seasons. Explore the typical Airbnb income in Richmond across different performance tiers:
- Best-in-class properties (Top 10%) achieve $5,633+ monthly, often utilizing dynamic pricing and superior guest experiences.
- Strong performing properties (Top 25%) earn $3,894 or more, indicating effective management and desirable locations/amenities.
- Typical properties (Median) generate around $2,542 per month, representing the average market performance.
- Entry-level properties (Bottom 25%) see earnings around $1,399, often with potential for optimization.
Average Monthly Airbnb Earnings Trend in Richmond
Richmond Airbnb Occupancy Rate Trends (2026)
Maximize your bookings by understanding the Richmond STR occupancy trends. Seasonal demand shifts significantly influence how often properties are booked. Typically, Marchsees the highest demand (peak season occupancy), while January experiences the lowest (low season). Effective strategies, like adjusting minimum stays or offering promotions, can boost occupancy during slower periods. Here's how different property tiers perform in Richmond:
- Best-in-class properties (Top 10%) achieve 85%+ occupancy, indicating high desirability and potentially optimized availability.
- Strong performing properties (Top 25%) maintain 72% or higher occupancy, suggesting good market fit and guest satisfaction.
- Typical properties (Median) have an occupancy rate around 52%.
- Entry-level properties (Bottom 25%) average 31% occupancy, potentially facing higher vacancy.
Average Monthly Occupancy Rate Trend in Richmond
Average Daily Rate (ADR) Airbnb Trends in Richmond (2026)
Effective short term rental pricing strategy in Richmond involves understanding monthly ADR fluctuations. The Average Daily Rate (ADR) for Airbnb in Richmond typically peaks in November and dips lowest during February. Leveraging Airbnb dynamic pricing tools or strategies based on this seasonality can significantly boost revenue. Here's a look at the typical nightly rates achieved:
- Best-in-class properties (Top 10%) command rates of $296+ per night, often due to premium features or locations.
- Strong performing properties (Top 25%) achieve nightly rates of $212 or more.
- Typical properties (Median) charge around $151 per night.
- Entry-level properties (Bottom 25%) earn around $101 per night.
Average Daily Rate (ADR) Trend by Month in Richmond
Get Live Richmond Market Intelligence 👇

Explore Real-time Analytics
Airbnb Seasonality Analysis & Trends in Richmond (2026)
Peak Season (October, July, November)
- Revenue averages $3,379 per month
- Occupancy rates average 53.1%
- Daily rates average $182
Shoulder Season
- Revenue averages $3,044 per month
- Occupancy maintains around 52.0%
- Daily rates hold near $173
Low Season (January, February, April)
- Revenue drops to average $2,516 per month
- Occupancy decreases to average 47.3%
- Daily rates adjust to average $165
Seasonality Insights for Richmond
- The Airbnb seasonality in Richmond shows moderate seasonality with distinct peak and low periods. While the sections above show seasonal averages, it's also insightful to look at the extremes:
- During the high season, the absolute peak month showcases Richmond's highest earning potential, with monthly revenues capable of climbing to $3,557, occupancy reaching a high of 56.6%, and ADRs peaking at $188.
- Conversely, the slowest single month of the year, typically falling within the low season, marks the market's lowest point. In this month, revenue might dip to $2,359, occupancy could drop to 41.2%, and ADRs may adjust down to $156.
- Understanding both the seasonal averages and these monthly peaks and troughs in revenue, occupancy, and ADR is crucial for maximizing your Airbnb profit potential in Richmond.
Seasonal Strategies for Maximizing Profit
- Peak Season: Maximize revenue through premium pricing and potentially longer minimum stays. Ensure high availability.
- Low Season: Offer competitive pricing, special promotions (e.g., extended stay discounts), and flexible cancellation policies. Target off-season travelers like remote workers or budget-conscious guests.
- Shoulder Seasons: Implement dynamic pricing that balances peak and low rates. Target weekend travelers or specific events. Offer slightly more flexible terms than peak season.
- Regularly analyze your own performance against these Richmond seasonality benchmarks and adjust your pricing and availability strategy accordingly.
Best Areas for Airbnb Investment in Richmond (2026)
Exploring the top neighborhoods for short-term rentals in Richmond? This section highlights key areas, outlining why they are attractive for hosts and guests, along with notable local attractions. Consider these locations based on your target guest profile and investment strategy.
| Neighborhood / Area | Why Host Here? (Target Guests & Appeal) | Key Attractions & Landmarks |
|---|---|---|
| Shockoe Bottom | Historic district with cobblestone streets, rich history, and vibrant nightlife. Attracts visitors interested in the civil war history and local dining. | Libby Hill Park, Richmond National Battlefield Park, The Edgar Allan Poe Museum, Canal Walk, Belles Isle |
| The Fan District | Charming neighborhood known for its beautiful historic architecture and artsy vibe. Popular with both tourists and locals, especially during festivals. | Monroe Park, Virginia Museum of Fine Arts, Byrd Theater, Scott's Addition Art Walk, Carytown |
| Church Hill | Quaint, historic neighborhood with stunning views of the city. Close to local restaurants and history, appealing to tourists who enjoy a local feel. | St. John's Church, Libby Hill Park, Edgar Allan Poe Museum, Church Hill Park, Local Coffee Shops |
| Scott's Addition | Up-and-coming area known for its craft breweries and young vibe. Attracts younger crowds looking for nightlife and unique dining experiences. | Richmond Beer Trail, The Richmond Distillery, The Science Museum of Virginia, Art galleries, Food Festivals |
| Downtown Richmond | Heart of the city, with easy access to businesses, shopping, and cultural experiences. Great for travelers looking for convenience and urban excitement. | Virginia State Capitol, The National Theatre, Richmond Convention Center, Canal Walk, Local restaurants |
| Carytown | Shops, restaurants, and theaters in a vibrant, walkable area. Very popular for tourists who enjoy shopping and dining in a unique atmosphere. | Carytown Watermelon Festival, The Byrd Theatre, Local boutiques, Carytown shops, Washington Park |
| Avenue of the Arts | Cultural hub with theaters and galleries, appealing to those searching for artistic experiences and events in Richmond. | Virginia Museum of Fine Arts, Cultural Arts Center, The Carpenter Theatre, Theatre IV, Local art galleries |
| Broad Street | A diverse area connecting many of Richmond's hot spots with a mix of culture and nightlife. Great for guests who want to experience the city's energy. | Art galleries, Restaurants, Richmond Farmers Market, Local nightlife, Historical landmarks |
Understanding Airbnb License Requirements & STR Laws in Richmond (2026)
While Richmond, Virginia, United States currently shows low STR regulations, specific Airbnb license requirements might still exist or change. Always verify the latest short term rental regulations and Airbnb license requirements directly with local government authorities for Richmond to ensure full compliance before hosting.
(Source: AirROI data, 2026, based on 7% licensed listings)
Top Performing Airbnb Properties in Richmond (2026)
Benchmark your potential! Explore examples of top-performing Airbnb properties in Richmondbased on Trailing Twelve Month (TTM) revenue. Analyze their characteristics, revenue, occupancy rate, and ADR to understand what drives success in this market.
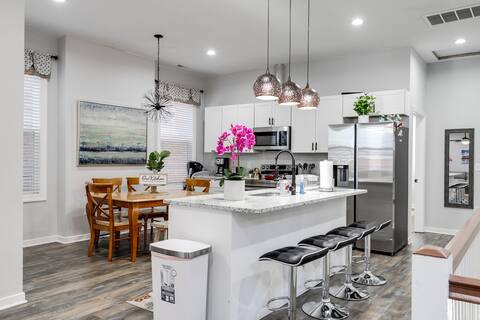
Big Fan Home/private parking /6 BR & 4 BA
Entire Place • 6 bedrooms
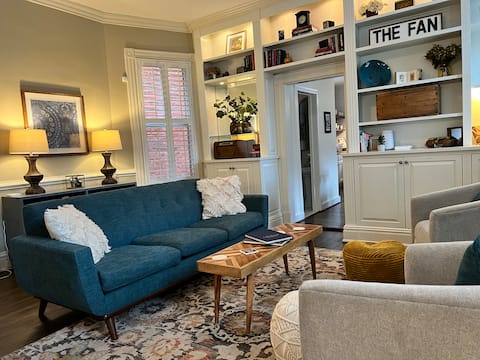
Spacious Carytown Home: 6BR, Free Parking!
Entire Place • 6 bedrooms

Cozy Family Friendly Home in Richmond
Entire Place • 4 bedrooms
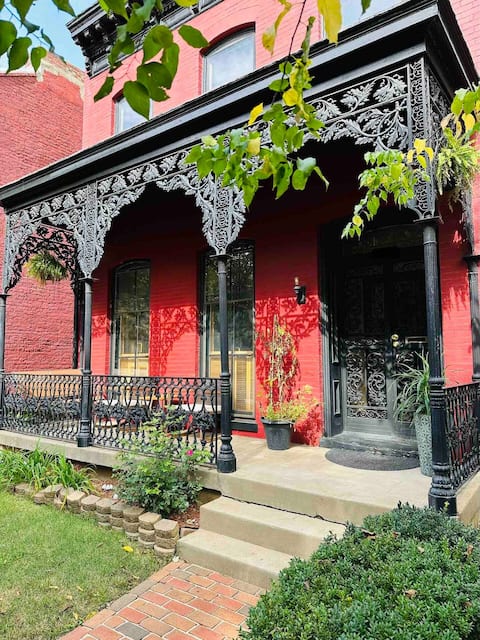
Historic Italianate Getaway
Entire Place • 5 bedrooms

Historic Blanton Getaway
Entire Place • 3 bedrooms
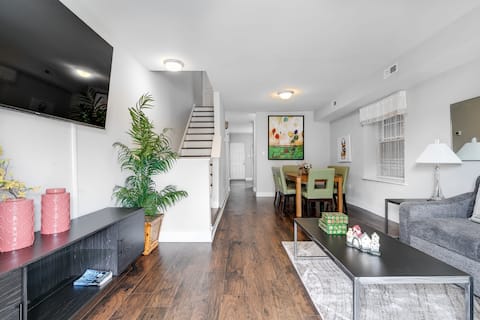
Spacious Urban Retreat in Charming Fan District
Entire Place • 4 bedrooms
Note: Performance varies based on location, size, amenities, seasonality, and management quality. Data reflects the past 12 months.
Top Performing Airbnb Hosts in Richmond (2026)
Learn from the best! This table showcases top-performing Airbnb hosts in Richmond based on the number of properties managed and estimated total revenue over the past year. Analyze their scale and performance metrics.
| Host Name | Properties | Grossing Revenue | Stay Reviews | Avg Rating |
|---|---|---|---|---|
| James | 40 | $1,523,198 | 2188 | 4.86/5.0 |
| Mei | 21 | $962,591 | 5222 | 4.88/5.0 |
| Mark | 25 | $719,317 | 8829 | 4.87/5.0 |
| Josh | 12 | $659,795 | 1253 | 4.90/5.0 |
| Anna | 15 | $633,184 | 667 | 4.96/5.0 |
| Eugene | 20 | $458,412 | 1836 | 4.85/5.0 |
| Carlos | 19 | $456,556 | 474 | 4.92/5.0 |
| Daniil | 14 | $374,169 | 1606 | 4.99/5.0 |
| Alex | 10 | $367,373 | 858 | 4.88/5.0 |
| Evolve | 10 | $349,701 | 251 | 4.72/5.0 |
Analyzing the strategies of top hosts, such as their property selection, pricing, and guest communication, can offer valuable lessons for optimizing your own Airbnb operations in Richmond.
Dive Deeper: Advanced Richmond STR Market Data (2026)
Ready to unlock more insights? AirROI provides access to advanced metrics and comprehensive Airbnb data for Richmond. Explore detailed analytics beyond this report to refine your investment strategy, optimize pricing, and maximize your vacation rental profits.
Explore Advanced MetricsRichmond Short-Term Rental Market Composition (2026): Property & Room Types
Room Type Distribution
Property Type Distribution
Market Composition Insights for Richmond
- The Richmond Airbnb market composition is heavily skewed towards Entire Home/Apt listings, which make up 86.2% of the 1,105 active rentals. This indicates strong guest preference for privacy and space.
- Looking at the property type distribution in Richmond, House properties are the most common (51.5%), reflecting the local real estate landscape.
- Houses represent a significant 51.5% portion, catering likely to families or larger groups.
- Smaller segments like hotel/boutique, others, outdoor/unique, unique stays (combined 7.2%) offer potential for unique stay experiences.
Richmond Airbnb Room Capacity Analysis (2026): Bedroom Distribution
Distribution of Listings by Number of Bedrooms
Room Capacity Insights for Richmond
- The dominant room capacity in Richmond is 1 bedroom listings, making up 33% of the market. This suggests a strong demand for properties suitable for couples or solo travelers.
- Together, 1 bedroom and 2 bedrooms properties represent 57.7% of the active Airbnb listings in Richmond, indicating a high concentration in these sizes.
- A significant 29.2% of listings offer 3+ bedrooms, catering to larger groups and families seeking more space in Richmond.
Richmond Vacation Rental Guest Capacity Trends (2026)
Distribution of Listings by Guest Capacity
Guest Capacity Insights for Richmond
- The most common guest capacity trend in Richmond vacation rentals is listings accommodating 4 guests (22%). This suggests the primary traveler segment is likely small families or groups.
- Properties designed for 4 guests and 2 guests dominate the Richmond STR market, accounting for 43.0% of listings.
- 32.5% of properties accommodate 6+ guests, serving the market segment for larger families or group travel in Richmond.
- On average, properties in Richmond are equipped to host 4.0 guests.
Richmond Airbnb Booking Patterns (2026): Available vs. Booked Days
Available Days Distribution
Booked Days Distribution
Booking Pattern Insights for Richmond
- The most common availability pattern in Richmond falls within the 181-270 days range, representing 33.8% of listings. This suggests many properties have significant open periods on their calendars.
- Approximately 62.8% of listings show high availability (181+ days open annually), indicating potential for increased bookings or specific owner usage patterns.
- For booked days, the 91-180 days range is most frequent in Richmond (33.5%), reflecting common guest stay durations or potential owner blocking patterns.
- A notable 38.7% of properties secure long booking periods (181+ days booked per year), highlighting successful long-term rental strategies or significant owner usage.
Richmond Airbnb Minimum Stay Requirements Analysis
Distribution of Listings by Minimum Night Requirement
1 Night
324 listings
29.3% of total
2 Nights
277 listings
25.1% of total
3 Nights
48 listings
4.3% of total
4-6 Nights
45 listings
4.1% of total
7-29 Nights
115 listings
10.4% of total
30+ Nights
296 listings
26.8% of total
Key Insights
- The most prevalent minimum stay requirement in Richmond is 1 Night, adopted by 29.3% of listings. This highlights the market's preference for shorter, flexible bookings.
- A significant segment (26.8%) caters to monthly stays (30+ nights) in Richmond, pointing to opportunities in the extended-stay market.
Recommendations
- Align with the market by considering a 1 Night minimum stay, as 29.3% of Richmond hosts use this setting.
- If feasible, allowing 1-night stays, especially midweek or during low season, could capture last-minute bookings, as only 29.3% currently do.
- Explore offering discounts for stays of 30+ nights to attract the 26.8% of the market seeking extended stays.
- Adjust minimum nights based on seasonality – potentially shorter during low season and longer during peak demand periods in Richmond.
Richmond Airbnb Cancellation Policy Trends Analysis (2026)
Super Strict 30 Days
14 listings
1.3% of total
Limited
31 listings
2.8% of total
Super Strict 60 Days
15 listings
1.4% of total
Flexible
242 listings
21.9% of total
Moderate
364 listings
33% of total
Firm
344 listings
31.2% of total
Strict
94 listings
8.5% of total
Cancellation Policy Insights for Richmond
- The prevailing Airbnb cancellation policy trend in Richmond is Moderate, used by 33% of listings.
- There's a relatively balanced mix between guest-friendly (54.9%) and stricter (39.7%) policies, offering choices for different guest needs.
- Strict cancellation policies are quite rare (8.5%), potentially making listings with this policy less competitive unless justified by high demand or property type.
Recommendations for Hosts
- Consider adopting a Moderate policy to align with the 33% market standard in Richmond.
- Using a Strict policy might deter some guests, as only 8.5% of listings use it. Evaluate if potential revenue protection outweighs possible lower booking rates.
- Regularly review your cancellation policy against competitors and market demand shifts in Richmond.
Richmond STR Booking Lead Time Analysis (2026)
Average Booking Lead Time by Month
Booking Lead Time Insights for Richmond
- The overall average booking lead time for vacation rentals in Richmond is 34 days.
- Guests book furthest in advance for stays during November (average 53 days), likely coinciding with peak travel demand or local events.
- The shortest booking windows occur for stays in February (average 22 days), indicating more last-minute travel plans during this time.
- Seasonally, Fall (45 days avg.) sees the longest lead times, while Winter (28 days avg.) has the shortest, reflecting typical travel planning cycles.
Recommendations for Hosts
- Use the overall average lead time (34 days) as a baseline for your pricing and availability strategy in Richmond.
- For November stays, consider implementing length-of-stay discounts or slightly higher rates for bookings made less than 53 days out to capitalize on advance planning.
- Target marketing efforts for the Fall season well in advance (at least 45 days) to capture early planners.
- Monitor your own booking lead times against these Richmond averages to identify opportunities for dynamic pricing adjustments.
Popular & Essential Airbnb Amenities in Richmond (2026)
Amenity Prevalence
Amenity Insights for Richmond
- Essential amenities in Richmond that guests expect include: Wifi, Smoke alarm, Air conditioning, Heating. Lacking these (any) could significantly impact bookings.
- Popular amenities like TV, Hot water, Kitchen are common but not universal. Offering these can provide a competitive edge.
Recommendations for Hosts
- Ensure your listing includes all essential amenities for Richmond: Wifi, Smoke alarm, Air conditioning, Heating.
- Prioritize adding missing essentials: Wifi, Smoke alarm, Air conditioning, Heating.
- Consider adding popular differentiators like TV or Hot water to increase appeal.
- Highlight unique or less common amenities you offer (e.g., hot tub, dedicated workspace, EV charger) in your listing description and photos.
- Regularly check competitor amenities in Richmond to stay competitive.
Richmond Airbnb Guest Demographics & Profile Analysis (2026)
Guest Profile Summary for Richmond
- The typical guest profile for Airbnb in Richmond consists of primarily domestic travelers (93%), often arriving from nearby Richmond, typically belonging to the Post-2000s (Gen Z/Alpha) group (50%), primarily speaking English or Spanish.
- Domestic travelers account for 92.8% of guests.
- Key international markets include United States (92.8%) and DC (4.3%).
- Top languages spoken are English (70.6%) followed by Spanish (12.5%).
- A significant demographic segment is the Post-2000s (Gen Z/Alpha) group, representing 50% of guests.
Recommendations for Hosts
- Target domestic marketing efforts towards travelers from Richmond and Washington.
- Tailor amenities and listing descriptions to appeal to the dominant Post-2000s (Gen Z/Alpha) demographic (e.g., highlight fast WiFi, smart home features, local guides).
- Highlight unique local experiences or amenities relevant to the primary guest profile.
- Consider seasonal promotions aligned with peak travel times for key origin markets.
Nearby Short-Term Rental Market Comparison
How does the Richmond Airbnb market stack up against its neighbors? Compare key performance metrics like average monthly revenue, ADR, and occupancy rates in surrounding areas to understand the broader regional STR landscape.
| Market | Active Properties | Monthly Revenue | Daily Rate | Avg. Occupancy |
|---|---|---|---|---|
| McGaheysville | 83 | $6,156 | $431.72 | 45% |
| Mayo | 13 | $5,915 | $447.58 | 51% |
| Stevensville | 80 | $5,412 | $556.79 | 41% |
| Bentonville | 23 | $5,372 | $420.82 | 51% |
| Nellysford | 62 | $5,276 | $426.33 | 39% |
| Weems | 11 | $5,077 | $417.22 | 47% |
| Arundel on the Bay | 29 | $5,043 | $486.96 | 40% |
| Easton | 45 | $4,985 | $654.52 | 39% |
| Bumpass | 120 | $4,851 | $553.01 | 33% |
| Mineral | 231 | $4,800 | $474.55 | 36% |