Merrifield Airbnb Market Analysis 2025: Short Term Rental Data & Vacation Rental Statistics in Virginia, United States
Is Airbnb profitable in Merrifield in 2025? Explore comprehensive Airbnb analytics for Merrifield, Virginia, United States to uncover income potential. This 2025 STR market report for Merrifield, based on AirROI data from December 2024 to November 2025, reveals key trends in the niche market of 19 active listings.
Whether you're considering an Airbnb investment in Merrifield, optimizing your existing vacation rental, or exploring rental arbitrage opportunities, understanding the Merrifield Airbnb data is crucial. Leveraging the low regulation environment is key to maximizing your short term rental income potential. Let's dive into the specifics.
Key Merrifield Airbnb Performance Metrics Overview
Monthly Airbnb Revenue Variations & Income Potential in Merrifield (2025)
Understanding the monthly revenue variations for Airbnb listings in Merrifield is key to maximizing your short term rental income potential. Seasonality significantly impacts earnings. Our analysis, based on data from the past 12 months, shows that the peak revenue month for STRs in Merrifield is typically December, while January often presents the lowest earnings, highlighting opportunities for strategic pricing adjustments during shoulder and low seasons. Explore the typical Airbnb income in Merrifield across different performance tiers:
- Best-in-class properties (Top 10%) achieve $5,714+ monthly, often utilizing dynamic pricing and superior guest experiences.
- Strong performing properties (Top 25%) earn $3,441 or more, indicating effective management and desirable locations/amenities.
- Typical properties (Median) generate around $2,065 per month, representing the average market performance.
- Entry-level properties (Bottom 25%) see earnings around $874, often with potential for optimization.
Average Monthly Airbnb Earnings Trend in Merrifield
Merrifield Airbnb Occupancy Rate Trends (2025)
Maximize your bookings by understanding the Merrifield STR occupancy trends. Seasonal demand shifts significantly influence how often properties are booked. Typically, Junesees the highest demand (peak season occupancy), while January experiences the lowest (low season). Effective strategies, like adjusting minimum stays or offering promotions, can boost occupancy during slower periods. Here's how different property tiers perform in Merrifield:
- Best-in-class properties (Top 10%) achieve 73%+ occupancy, indicating high desirability and potentially optimized availability.
- Strong performing properties (Top 25%) maintain 58% or higher occupancy, suggesting good market fit and guest satisfaction.
- Typical properties (Median) have an occupancy rate around 41%.
- Entry-level properties (Bottom 25%) average 23% occupancy, potentially facing higher vacancy.
Average Monthly Occupancy Rate Trend in Merrifield
Average Daily Rate (ADR) Airbnb Trends in Merrifield (2025)
Effective short term rental pricing strategy in Merrifield involves understanding monthly ADR fluctuations. The Average Daily Rate (ADR) for Airbnb in Merrifield typically peaks in July and dips lowest during February. Leveraging Airbnb dynamic pricing tools or strategies based on this seasonality can significantly boost revenue. Here's a look at the typical nightly rates achieved:
- Best-in-class properties (Top 10%) command rates of $245+ per night, often due to premium features or locations.
- Strong performing properties (Top 25%) achieve nightly rates of $164 or more.
- Typical properties (Median) charge around $112 per night.
- Entry-level properties (Bottom 25%) earn around $48 per night.
Average Daily Rate (ADR) Trend by Month in Merrifield
Get Live Merrifield Market Intelligence 👇

Explore Real-time Analytics
Airbnb Seasonality Analysis & Trends in Merrifield (2025)
Peak Season (December, April, October)
- Revenue averages $3,150 per month
- Occupancy rates average 48.9%
- Daily rates average $149
Shoulder Season
- Revenue averages $2,612 per month
- Occupancy maintains around 45.8%
- Daily rates hold near $154
Low Season (January, February, September)
- Revenue drops to average $1,833 per month
- Occupancy decreases to average 32.2%
- Daily rates adjust to average $147
Seasonality Insights for Merrifield
- The Airbnb seasonality in Merrifield shows highly seasonal trends requiring careful strategy. While the sections above show seasonal averages, it's also insightful to look at the extremes:
- During the high season, the absolute peak month showcases Merrifield's highest earning potential, with monthly revenues capable of climbing to $3,253, occupancy reaching a high of 55.4%, and ADRs peaking at $167.
- Conversely, the slowest single month of the year, typically falling within the low season, marks the market's lowest point. In this month, revenue might dip to $1,450, occupancy could drop to 21.8%, and ADRs may adjust down to $139.
- Understanding both the seasonal averages and these monthly peaks and troughs in revenue, occupancy, and ADR is crucial for maximizing your Airbnb profit potential in Merrifield.
Seasonal Strategies for Maximizing Profit
- Peak Season: Maximize revenue through premium pricing and potentially longer minimum stays. Ensure high availability.
- Low Season: Offer competitive pricing, special promotions (e.g., extended stay discounts), and flexible cancellation policies. Target off-season travelers like remote workers or budget-conscious guests.
- Shoulder Seasons: Implement dynamic pricing that balances peak and low rates. Target weekend travelers or specific events. Offer slightly more flexible terms than peak season.
- Regularly analyze your own performance against these Merrifield seasonality benchmarks and adjust your pricing and availability strategy accordingly.
Best Areas for Airbnb Investment in Merrifield (2025)
Exploring the top neighborhoods for short-term rentals in Merrifield? This section highlights key areas, outlining why they are attractive for hosts and guests, along with notable local attractions. Consider these locations based on your target guest profile and investment strategy.
| Neighborhood / Area | Why Host Here? (Target Guests & Appeal) | Key Attractions & Landmarks |
|---|---|---|
| Mason District | Conveniently located near Washington, D.C., the Mason District offers a vibrant community with various dining, shopping, and cultural options. It's appealing to both tourists and business travelers. | Mason District Park, Shirley Gate Park, Eden Center, Dunn Loring Metro Station, Annandale Community Park |
| Merrifield Town Center | A bustling area with a mix of residential, retail, and office spaces, Merrifield Town Center is growing in popularity, especially among families and young professionals seeking urban conveniences. | Mosaic District, Angelika Film Center, Dunn Loring Park, NOVA (Northern Virginia Community College), Multiple parks and recreational areas |
| Tysons Corner | One of the country's largest business districts, Tysons Corner attracts a plethora of business travelers and shoppers, making it an ideal location for Airbnb hosting. | Tysons Corner Center, Tysons Galleria, Wolf Trap National Park, Meadowlark Botanical Gardens, Great Falls Park |
| Wintergreen Crossing | A suburban neighborhood that appeals to families looking for community and convenience, with good access to parks and schools, making it family-friendly for Airbnb guests. | Mason District Park, Dunn Loring Park, Local eateries, Close proximity to metro stations |
| Greenbriar | Greenbriar is a residential area that is near shopping centers and parks, ideal for families and business travelers who appreciate suburban comfort close to urban amenities. | Greenbriar Park, George Mason University, Nearby restaurants and cafes, Access to I-66 and local transport |
| Columbia Pike | A diverse and vibrant area with a unique blend of cultures, restaurants, and markets. Ideal for guests who enjoy a lively atmosphere and a variety of culinary experiences. | Columbia Pike Farmers Market, Local cafes and restaurants, Parks and community events, Easy access to Arlington and D.C. |
| Falls Church City | Known for its historic charm and community feel. This area is family-oriented with parks and local activities that cater to visitors looking for a peaceful stay near urban attractions. | Cherry Hill Park, Falls Church Farmers Market, Historic buildings, Broad Street shops |
| Forest Glen | A quieter residential area that offers a suburban feel with easy access to parks and local amenities, perfect for those looking for a tranquil home away from home. | Forest Glen Park, Nearby local shops and cafes, Nature trails, Access to metro |
Understanding Airbnb License Requirements & STR Laws in Merrifield (2025)
While Merrifield, Virginia, United States currently shows low STR regulations, specific Airbnb license requirements might still exist or change. Always verify the latest short term rental regulations and Airbnb license requirements directly with local government authorities for Merrifield to ensure full compliance before hosting.
(Source: AirROI data, 2025, finding no licensed listings among those analyzed)
Top Performing Airbnb Properties in Merrifield (2025)
Benchmark your potential! Explore examples of top-performing Airbnb properties in Merrifieldbased on Trailing Twelve Month (TTM) revenue. Analyze their characteristics, revenue, occupancy rate, and ADR to understand what drives success in this market.
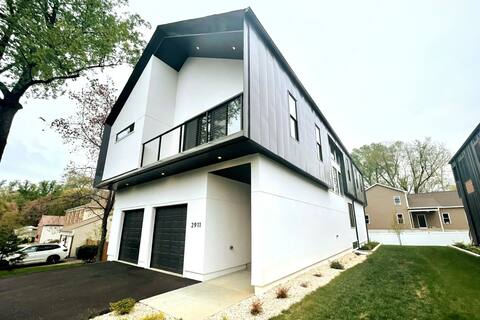
Minimalist | Modern | Scandi Home in Fairfax!
Entire Place • 6 bedrooms

Beautiful Townhouse - Vienna Metro, 20 Min to DC
Entire Place • 4 bedrooms

Chic Mosaic Private Guest Suite
Entire Place • 2 bedrooms
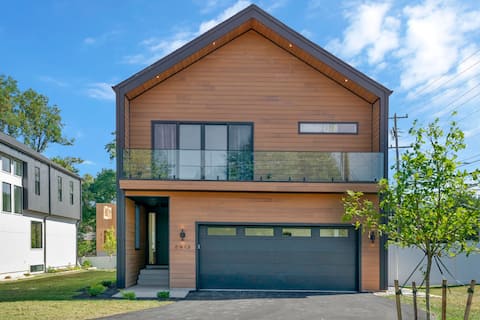
Chic | Unique | Scandi-Style Gem in FFX!
Entire Place • 6 bedrooms

Cozy Guest Suite in Fairfax
Entire Place • 1 bedroom

Explore DC! At Metro & Shops
Private Room • N/A
Note: Performance varies based on location, size, amenities, seasonality, and management quality. Data reflects the past 12 months.
Top Performing Airbnb Hosts in Merrifield (2025)
Learn from the best! This table showcases top-performing Airbnb hosts in Merrifield based on the number of properties managed and estimated total revenue over the past year. Analyze their scale and performance metrics.
| Host Name | Properties | Grossing Revenue | Stay Reviews | Avg Rating |
|---|---|---|---|---|
| Andrew | 2 | $79,245 | 67 | 4.91/5.0 |
| Nagla | 1 | $45,729 | 102 | 4.88/5.0 |
| Aster | 1 | $42,105 | 55 | 4.91/5.0 |
| Edwin | 1 | $30,138 | 320 | 4.94/5.0 |
| Liz | 1 | $13,191 | 10 | 5.00/5.0 |
| Jay | 1 | $10,298 | 23 | 4.48/5.0 |
| Mona | 1 | $8,837 | 15 | 4.80/5.0 |
| Core Investments | 1 | $7,819 | 2 | Not Rated |
| Mark | 4 | $7,734 | 313 | 4.85/5.0 |
| Eric | 1 | $6,283 | 20 | 5.00/5.0 |
Analyzing the strategies of top hosts, such as their property selection, pricing, and guest communication, can offer valuable lessons for optimizing your own Airbnb operations in Merrifield.
Dive Deeper: Advanced Merrifield STR Market Data (2025)
Ready to unlock more insights? AirROI provides access to advanced metrics and comprehensive Airbnb data for Merrifield. Explore detailed analytics beyond this report to refine your investment strategy, optimize pricing, and maximize your vacation rental profits.
Explore Advanced MetricsMerrifield Short-Term Rental Market Composition (2025): Property & Room Types
Room Type Distribution
Property Type Distribution
Market Composition Insights for Merrifield
- The Merrifield Airbnb market composition is heavily skewed towards Entire Home/Apt listings, which make up 63.2% of the 19 active rentals. This indicates strong guest preference for privacy and space.
- However, a notable 26.3% share for Private Rooms suggests opportunities for budget-conscious travelers or hosts renting out spare rooms.
- Looking at the property type distribution in Merrifield, Apartment/Condo properties are the most common (47.4%), reflecting the local real estate landscape.
- Houses represent a significant 36.8% portion, catering likely to families or larger groups.
- The presence of 10.5% Hotel/Boutique listings indicates integration with traditional hospitality.
Merrifield Airbnb Room Capacity Analysis (2025): Bedroom Distribution
Distribution of Listings by Number of Bedrooms
Room Capacity Insights for Merrifield
- The dominant room capacity in Merrifield is 1 bedroom listings, making up 31.6% of the market. This suggests a strong demand for properties suitable for couples or solo travelers.
- Together, 1 bedroom and 5+ bedrooms properties represent 42.1% of the active Airbnb listings in Merrifield, indicating a high concentration in these sizes.
- A significant 21.1% of listings offer 3+ bedrooms, catering to larger groups and families seeking more space in Merrifield.
Merrifield Vacation Rental Guest Capacity Trends (2025)
Distribution of Listings by Guest Capacity
Guest Capacity Insights for Merrifield
- The most common guest capacity trend in Merrifield vacation rentals is listings accommodating 2 guests (26.3%). This suggests the primary traveler segment is likely couples or solo travelers.
- Properties designed for 2 guests and 8+ guests dominate the Merrifield STR market, accounting for 42.1% of listings.
- 15.8% of properties accommodate 6+ guests, serving the market segment for larger families or group travel in Merrifield.
- On average, properties in Merrifield are equipped to host 2.5 guests.
Merrifield Airbnb Booking Patterns (2025): Available vs. Booked Days
Available Days Distribution
Booked Days Distribution
Booking Pattern Insights for Merrifield
- The most common availability pattern in Merrifield falls within the 271-366 days range, representing 73.7% of listings. This suggests many properties have significant open periods on their calendars.
- Approximately 89.5% of listings show high availability (181+ days open annually), indicating potential for increased bookings or specific owner usage patterns.
- For booked days, the 31-90 days range is most frequent in Merrifield (42.1%), reflecting common guest stay durations or potential owner blocking patterns.
- A notable 10.5% of properties secure long booking periods (181+ days booked per year), highlighting successful long-term rental strategies or significant owner usage.
Merrifield Airbnb Minimum Stay Requirements Analysis
Distribution of Listings by Minimum Night Requirement
1 Night
3 listings
15.8% of total
2 Nights
4 listings
21.1% of total
3 Nights
4 listings
21.1% of total
4-6 Nights
1 listings
5.3% of total
7-29 Nights
1 listings
5.3% of total
30+ Nights
6 listings
31.6% of total
Key Insights
- The most prevalent minimum stay requirement in Merrifield is 30+ Nights, adopted by 31.6% of listings. This highlights the market's preference for longer commitments.
- A significant segment (31.6%) caters to monthly stays (30+ nights) in Merrifield, pointing to opportunities in the extended-stay market.
Recommendations
- Align with the market by considering a 30+ Nights minimum stay, as 31.6% of Merrifield hosts use this setting.
- If feasible, allowing 1-night stays, especially midweek or during low season, could capture last-minute bookings, as only 15.8% currently do.
- Explore offering discounts for stays of 30+ nights to attract the 31.6% of the market seeking extended stays.
- Adjust minimum nights based on seasonality – potentially shorter during low season and longer during peak demand periods in Merrifield.
Merrifield Airbnb Cancellation Policy Trends Analysis (2025)
Flexible
3 listings
15.8% of total
Moderate
4 listings
21.1% of total
Firm
4 listings
21.1% of total
Strict
8 listings
42.1% of total
Cancellation Policy Insights for Merrifield
- The prevailing Airbnb cancellation policy trend in Merrifield is Strict, used by 42.1% of listings.
- A majority (63.2%) of hosts in Merrifield utilize Firm or Strict policies, indicating a market where hosts prioritize booking security.
Recommendations for Hosts
- Consider adopting a Strict policy to align with the 42.1% market standard in Merrifield.
- With 42.1% using Strict terms, this is a viable option in Merrifield, particularly for high-value properties or during peak demand periods.
- Regularly review your cancellation policy against competitors and market demand shifts in Merrifield.
Merrifield STR Booking Lead Time Analysis (2025)
Average Booking Lead Time by Month
Booking Lead Time Insights for Merrifield
- The overall average booking lead time for vacation rentals in Merrifield is 25 days.
- Guests book furthest in advance for stays during November (average 55 days), likely coinciding with peak travel demand or local events.
- The shortest booking windows occur for stays in February (average 11 days), indicating more last-minute travel plans during this time.
- Seasonally, Spring (34 days avg.) sees the longest lead times, while Summer (22 days avg.) has the shortest, reflecting typical travel planning cycles.
Recommendations for Hosts
- Use the overall average lead time (25 days) as a baseline for your pricing and availability strategy in Merrifield.
- For November stays, consider implementing length-of-stay discounts or slightly higher rates for bookings made less than 55 days out to capitalize on advance planning.
- During February, focus on last-minute booking availability and promotions, as guests book with very short notice (11 days avg.).
- Target marketing efforts for the Spring season well in advance (at least 34 days) to capture early planners.
- Monitor your own booking lead times against these Merrifield averages to identify opportunities for dynamic pricing adjustments.
Popular & Essential Airbnb Amenities in Merrifield (2025)
Amenity Prevalence
Amenity Insights for Merrifield
- Essential amenities in Merrifield that guests expect include: Wifi, Air conditioning. Lacking these (any) could significantly impact bookings.
- Popular amenities like Heating, Smoke alarm, Hangers are common but not universal. Offering these can provide a competitive edge.
Recommendations for Hosts
- Ensure your listing includes all essential amenities for Merrifield: Wifi, Air conditioning.
- Consider adding popular differentiators like Heating or Smoke alarm to increase appeal.
- Highlight unique or less common amenities you offer (e.g., hot tub, dedicated workspace, EV charger) in your listing description and photos.
- Regularly check competitor amenities in Merrifield to stay competitive.
Merrifield Airbnb Guest Demographics & Profile Analysis (2025)
Guest Profile Summary for Merrifield
- The typical guest profile for Airbnb in Merrifield consists of primarily domestic travelers (91%), often arriving from nearby Alexandria, typically belonging to the Post-2000s (Gen Z/Alpha) group (50%), primarily speaking English or Spanish.
- Domestic travelers account for 90.8% of guests.
- Key international markets include United States (90.8%) and DC (1.8%).
- Top languages spoken are English (61.7%) followed by Spanish (8.6%).
- A significant demographic segment is the Post-2000s (Gen Z/Alpha) group, representing 50% of guests.
Recommendations for Hosts
- Target domestic marketing efforts towards travelers from Alexandria and Fairfax.
- Tailor amenities and listing descriptions to appeal to the dominant Post-2000s (Gen Z/Alpha) demographic (e.g., highlight fast WiFi, smart home features, local guides).
- Highlight unique local experiences or amenities relevant to the primary guest profile.
- Consider seasonal promotions aligned with peak travel times for key origin markets.
Nearby Short-Term Rental Market Comparison
How does the Merrifield Airbnb market stack up against its neighbors? Compare key performance metrics like average monthly revenue, ADR, and occupancy rates in surrounding areas to understand the broader regional STR landscape.
| Market | Active Properties | Monthly Revenue | Daily Rate | Avg. Occupancy |
|---|---|---|---|---|
| Mayo | 13 | $6,456 | $454.24 | 51% |
| Centreville | 17 | $5,971 | $583.21 | 43% |
| Bentonville | 23 | $5,783 | $430.77 | 51% |
| Shannondale | 47 | $5,776 | $333.28 | 55% |
| Castleton | 10 | $5,734 | $547.84 | 34% |
| McGaheysville | 79 | $5,727 | $426.94 | 45% |
| Stevensville | 79 | $5,704 | $565.15 | 41% |
| Arundel on the Bay | 28 | $5,578 | $497.59 | 40% |
| Lower Windsor Township | 14 | $5,415 | $444.20 | 45% |
| Weems | 11 | $5,350 | $417.50 | 48% |