Maurertown Airbnb Market Analysis 2026: Short Term Rental Data & Vacation Rental Statistics in Virginia, United States
Is Airbnb profitable in Maurertown in 2026? Explore comprehensive Airbnb analytics for Maurertown, Virginia, United States to uncover income potential. This 2026 STR market report for Maurertown, based on AirROI data from February 2025 to January 2026, reveals key trends in the niche market of 20 active listings.
Whether you're considering an Airbnb investment in Maurertown, optimizing your existing vacation rental, or exploring rental arbitrage opportunities, understanding the Maurertown Airbnb data is crucial. Leveraging the low regulation environment is key to maximizing your short term rental income potential. Let's dive into the specifics.
Key Maurertown Airbnb Performance Metrics Overview
Monthly Airbnb Revenue Variations & Income Potential in Maurertown (2026)
Understanding the monthly revenue variations for Airbnb listings in Maurertown is key to maximizing your short term rental income potential. Seasonality significantly impacts earnings. Our analysis, based on data from the past 12 months, shows that the peak revenue month for STRs in Maurertown is typically July, while January often presents the lowest earnings, highlighting opportunities for strategic pricing adjustments during shoulder and low seasons. Explore the typical Airbnb income in Maurertown across different performance tiers:
- Best-in-class properties (Top 10%) achieve $6,544+ monthly, often utilizing dynamic pricing and superior guest experiences.
- Strong performing properties (Top 25%) earn $4,554 or more, indicating effective management and desirable locations/amenities.
- Typical properties (Median) generate around $2,573 per month, representing the average market performance.
- Entry-level properties (Bottom 25%) see earnings around $1,155, often with potential for optimization.
Average Monthly Airbnb Earnings Trend in Maurertown
Maurertown Airbnb Occupancy Rate Trends (2026)
Maximize your bookings by understanding the Maurertown STR occupancy trends. Seasonal demand shifts significantly influence how often properties are booked. Typically, Julysees the highest demand (peak season occupancy), while December experiences the lowest (low season). Effective strategies, like adjusting minimum stays or offering promotions, can boost occupancy during slower periods. Here's how different property tiers perform in Maurertown:
- Best-in-class properties (Top 10%) achieve 69%+ occupancy, indicating high desirability and potentially optimized availability.
- Strong performing properties (Top 25%) maintain 56% or higher occupancy, suggesting good market fit and guest satisfaction.
- Typical properties (Median) have an occupancy rate around 34%.
- Entry-level properties (Bottom 25%) average 20% occupancy, potentially facing higher vacancy.
Average Monthly Occupancy Rate Trend in Maurertown
Average Daily Rate (ADR) Airbnb Trends in Maurertown (2026)
Effective short term rental pricing strategy in Maurertown involves understanding monthly ADR fluctuations. The Average Daily Rate (ADR) for Airbnb in Maurertown typically peaks in October and dips lowest during February. Leveraging Airbnb dynamic pricing tools or strategies based on this seasonality can significantly boost revenue. Here's a look at the typical nightly rates achieved:
- Best-in-class properties (Top 10%) command rates of $397+ per night, often due to premium features or locations.
- Strong performing properties (Top 25%) achieve nightly rates of $315 or more.
- Typical properties (Median) charge around $210 per night.
- Entry-level properties (Bottom 25%) earn around $135 per night.
Average Daily Rate (ADR) Trend by Month in Maurertown
Get Live Maurertown Market Intelligence 👇

Explore Real-time Analytics
Airbnb Seasonality Analysis & Trends in Maurertown (2026)
Peak Season (July, October, June)
- Revenue averages $4,004 per month
- Occupancy rates average 46.6%
- Daily rates average $261
Shoulder Season
- Revenue averages $3,109 per month
- Occupancy maintains around 39.9%
- Daily rates hold near $239
Low Season (January, February, December)
- Revenue drops to average $2,626 per month
- Occupancy decreases to average 29.5%
- Daily rates adjust to average $241
Seasonality Insights for Maurertown
- The Airbnb seasonality in Maurertown shows moderate seasonality with distinct peak and low periods. While the sections above show seasonal averages, it's also insightful to look at the extremes:
- During the high season, the absolute peak month showcases Maurertown's highest earning potential, with monthly revenues capable of climbing to $4,280, occupancy reaching a high of 51.1%, and ADRs peaking at $268.
- Conversely, the slowest single month of the year, typically falling within the low season, marks the market's lowest point. In this month, revenue might dip to $2,603, occupancy could drop to 27.0%, and ADRs may adjust down to $217.
- Understanding both the seasonal averages and these monthly peaks and troughs in revenue, occupancy, and ADR is crucial for maximizing your Airbnb profit potential in Maurertown.
Seasonal Strategies for Maximizing Profit
- Peak Season: Maximize revenue through premium pricing and potentially longer minimum stays. Ensure high availability.
- Low Season: Offer competitive pricing, special promotions (e.g., extended stay discounts), and flexible cancellation policies. Target off-season travelers like remote workers or budget-conscious guests.
- Shoulder Seasons: Implement dynamic pricing that balances peak and low rates. Target weekend travelers or specific events. Offer slightly more flexible terms than peak season.
- Regularly analyze your own performance against these Maurertown seasonality benchmarks and adjust your pricing and availability strategy accordingly.
Best Areas for Airbnb Investment in Maurertown (2026)
Exploring the top neighborhoods for short-term rentals in Maurertown? This section highlights key areas, outlining why they are attractive for hosts and guests, along with notable local attractions. Consider these locations based on your target guest profile and investment strategy.
| Neighborhood / Area | Why Host Here? (Target Guests & Appeal) | Key Attractions & Landmarks |
|---|---|---|
| Shenandoah National Park | Breathtaking natural beauty with hiking, camping, and wildlife viewing. Attracts outdoor enthusiasts and families looking for adventure in nature. | Skyline Drive, Old Rag Mountain, Hawksbill Mountain, Swift Run Gap, Big Meadows, Dark Hollow Falls |
| Historic Woodward House | Charming historic home that offers a glimpse into the area's rich history. Popular with history buffs and those looking for unique lodging experiences. | Woodward House, Local museums, Civil War Trails, Historical landmarks |
| Cedar Creek and Belle Grove National Historical Park | Significant Civil War history combined with beautiful landscapes. Ideal for history lovers and educational tourism. | Belle Grove Plantation, Cedar Creek Battlefield, Interpretive trails, Visitor center, Historical programming |
| Local Wineries | Virginia's wine country, known for its beautiful vineyards and wine tastings. Attracts wine enthusiasts and couples looking for romantic getaways. | Wine tasting tours, Local vineyards, Scenic views, Wine festivals |
| Front Royal | Gateway to the Shenandoah National Park with charming downtown and outdoor activities. Appeals to families and nature lovers. | Front Royal Historic District, Shenandoah River, Warren County Fairgrounds, Local parks |
| Luray Caverns | Famous for its stunning limestone formations and underground tours. It attracts tourists seeking unique geological experiences. | Luray Caverns, Garden Maze, Luray Valley Museum, Skyline Caverns |
| Natural Bridge State Park | A natural wonder with hiking trails and beautiful views. It's great for tourists seeking outdoor activities and picturesque landscapes. | Natural Bridge, Cedar Creek Trail, Aylor's Overlook, Visitor center |
| Seasonal Festivals | Various local festivals throughout the year attract tourists and locals alike, boosting seasonal Airbnb interests. | Apple Blossom Festival, Virginia Renaissance Faire, Local farmers markets, Cultural events |
Understanding Airbnb License Requirements & STR Laws in Maurertown (2026)
While Maurertown, Virginia, United States currently shows low STR regulations, specific Airbnb license requirements might still exist or change. Always verify the latest short term rental regulations and Airbnb license requirements directly with local government authorities for Maurertown to ensure full compliance before hosting.
(Source: AirROI data, 2026, finding no licensed listings among those analyzed)
Top Performing Airbnb Properties in Maurertown (2026)
Benchmark your potential! Explore examples of top-performing Airbnb properties in Maurertownbased on Trailing Twelve Month (TTM) revenue. Analyze their characteristics, revenue, occupancy rate, and ADR to understand what drives success in this market.
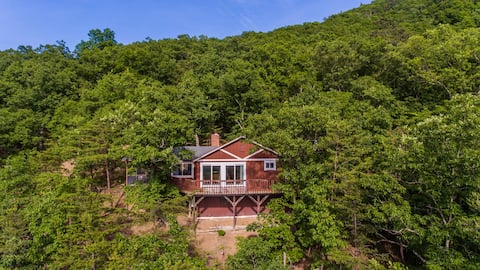
The Bear Den - Mountain Cabin w/ Spectacular Views
Entire Place • 2 bedrooms
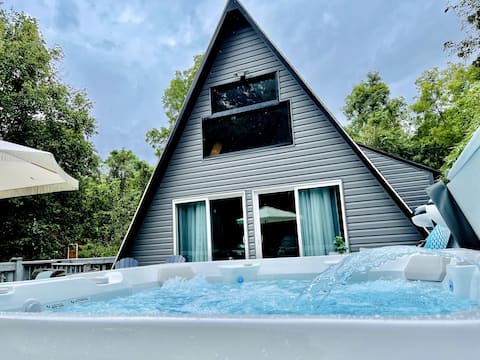
Riverfront A-Frame /Hot Tub/Fire Pit/Fast WiFi
Entire Place • 2 bedrooms

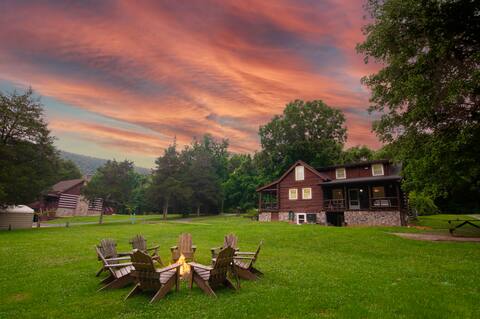
Idyllic Mtn Retreat w/ Hot Tub Near Shenandoah NP!
Entire Place • 6 bedrooms
Stunning Shenandoah Riverfront Retreat
Entire Place • 4 bedrooms

Riverfront Retreat
Entire Place • 4 bedrooms

MountainWaters-Mtn, River, Relax
Entire Place • 2 bedrooms
Note: Performance varies based on location, size, amenities, seasonality, and management quality. Data reflects the past 12 months.
Top Performing Airbnb Hosts in Maurertown (2026)
Learn from the best! This table showcases top-performing Airbnb hosts in Maurertown based on the number of properties managed and estimated total revenue over the past year. Analyze their scale and performance metrics.
| Host Name | Properties | Grossing Revenue | Stay Reviews | Avg Rating |
|---|---|---|---|---|
| Jessica | 1 | $84,808 | 287 | 4.99/5.0 |
| Rigoberto | 1 | $74,233 | 146 | 4.86/5.0 |
| Evolve | 1 | $66,971 | 109 | 4.83/5.0 |
| Anthony | 1 | $53,884 | 242 | 4.90/5.0 |
| Amber | 1 | $49,109 | 23 | 4.87/5.0 |
| Angie | 1 | $39,247 | 107 | 4.94/5.0 |
| Olivia | 1 | $33,157 | 181 | 4.99/5.0 |
| Jennifer | 1 | $32,270 | 72 | 4.94/5.0 |
| Erin | 1 | $31,946 | 120 | 4.99/5.0 |
| Brian And Sara | 1 | $22,921 | 71 | 4.59/5.0 |
Analyzing the strategies of top hosts, such as their property selection, pricing, and guest communication, can offer valuable lessons for optimizing your own Airbnb operations in Maurertown.
Dive Deeper: Advanced Maurertown STR Market Data (2026)
Ready to unlock more insights? AirROI provides access to advanced metrics and comprehensive Airbnb data for Maurertown. Explore detailed analytics beyond this report to refine your investment strategy, optimize pricing, and maximize your vacation rental profits.
Explore Advanced MetricsMaurertown Short-Term Rental Market Composition (2026): Property & Room Types
Room Type Distribution
Property Type Distribution
Market Composition Insights for Maurertown
- The Maurertown Airbnb market composition is heavily skewed towards Entire Home/Apt listings, which make up 100% of the 20 active rentals. This indicates strong guest preference for privacy and space.
- Looking at the property type distribution in Maurertown, Outdoor/Unique properties are the most common (45%), reflecting the local real estate landscape.
- Houses represent a significant 40% portion, catering likely to families or larger groups.
- The presence of 15% Hotel/Boutique listings indicates integration with traditional hospitality.
Maurertown Airbnb Room Capacity Analysis (2026): Bedroom Distribution
Distribution of Listings by Number of Bedrooms
Room Capacity Insights for Maurertown
- The dominant room capacity in Maurertown is 1 bedroom listings, making up 20% of the market. This suggests a strong demand for properties suitable for couples or solo travelers.
- Together, 1 bedroom and 3 bedrooms properties represent 40.0% of the active Airbnb listings in Maurertown, indicating a high concentration in these sizes.
- A significant 40.0% of listings offer 3+ bedrooms, catering to larger groups and families seeking more space in Maurertown.
Maurertown Vacation Rental Guest Capacity Trends (2026)
Distribution of Listings by Guest Capacity
Guest Capacity Insights for Maurertown
- The most common guest capacity trend in Maurertown vacation rentals is listings accommodating 4 guests (30%). This suggests the primary traveler segment is likely small families or groups.
- Properties designed for 4 guests and 2 guests dominate the Maurertown STR market, accounting for 55.0% of listings.
- 40.0% of properties accommodate 6+ guests, serving the market segment for larger families or group travel in Maurertown.
- On average, properties in Maurertown are equipped to host 4.7 guests.
Maurertown Airbnb Booking Patterns (2026): Available vs. Booked Days
Available Days Distribution
Booked Days Distribution
Booking Pattern Insights for Maurertown
- The most common availability pattern in Maurertown falls within the 181-270 days range, representing 40% of listings. This suggests many properties have significant open periods on their calendars.
- Approximately 80.0% of listings show high availability (181+ days open annually), indicating potential for increased bookings or specific owner usage patterns.
- For booked days, the 91-180 days range is most frequent in Maurertown (35%), reflecting common guest stay durations or potential owner blocking patterns.
- A notable 25.0% of properties secure long booking periods (181+ days booked per year), highlighting successful long-term rental strategies or significant owner usage.
Maurertown Airbnb Minimum Stay Requirements Analysis
Distribution of Listings by Minimum Night Requirement
1 Night
6 listings
30% of total
2 Nights
9 listings
45% of total
30+ Nights
5 listings
25% of total
Key Insights
- The most prevalent minimum stay requirement in Maurertown is 2 Nights, adopted by 45% of listings. This highlights the market's preference for shorter, flexible bookings.
- A strong majority (75.0%) of the Maurertown Airbnb data shows acceptance of very short stays (1-2 nights), indicating a dynamic, high-turnover market.
- A significant segment (25%) caters to monthly stays (30+ nights) in Maurertown, pointing to opportunities in the extended-stay market.
Recommendations
- Align with the market by considering a 2 Nights minimum stay, as 45% of Maurertown hosts use this setting.
- Explore offering discounts for stays of 30+ nights to attract the 25% of the market seeking extended stays.
- Adjust minimum nights based on seasonality – potentially shorter during low season and longer during peak demand periods in Maurertown.
Maurertown Airbnb Cancellation Policy Trends Analysis (2026)
Limited
2 listings
10% of total
Flexible
5 listings
25% of total
Moderate
5 listings
25% of total
Firm
6 listings
30% of total
Strict
2 listings
10% of total
Cancellation Policy Insights for Maurertown
- The prevailing Airbnb cancellation policy trend in Maurertown is Firm, used by 30% of listings.
- There's a relatively balanced mix between guest-friendly (50.0%) and stricter (40.0%) policies, offering choices for different guest needs.
Recommendations for Hosts
- Consider adopting a Firm policy to align with the 30% market standard in Maurertown.
- Using a Strict policy might deter some guests, as only 10% of listings use it. Evaluate if potential revenue protection outweighs possible lower booking rates.
- Regularly review your cancellation policy against competitors and market demand shifts in Maurertown.
Maurertown STR Booking Lead Time Analysis (2026)
Average Booking Lead Time by Month
Booking Lead Time Insights for Maurertown
- The overall average booking lead time for vacation rentals in Maurertown is 44 days.
- Guests book furthest in advance for stays during October (average 66 days), likely coinciding with peak travel demand or local events.
- The shortest booking windows occur for stays in March (average 20 days), indicating more last-minute travel plans during this time.
- Seasonally, Fall (60 days avg.) sees the longest lead times, while Winter (32 days avg.) has the shortest, reflecting typical travel planning cycles.
Recommendations for Hosts
- Use the overall average lead time (44 days) as a baseline for your pricing and availability strategy in Maurertown.
- For October stays, consider implementing length-of-stay discounts or slightly higher rates for bookings made less than 66 days out to capitalize on advance planning.
- Target marketing efforts for the Fall season well in advance (at least 60 days) to capture early planners.
- Monitor your own booking lead times against these Maurertown averages to identify opportunities for dynamic pricing adjustments.
Popular & Essential Airbnb Amenities in Maurertown (2026)
Amenity Prevalence
Amenity Insights for Maurertown
- Essential amenities in Maurertown that guests expect include: Free parking on premises, Heating, Outdoor furniture. Lacking these (any) could significantly impact bookings.
- Popular amenities like Hot water, Air conditioning, Essentials are common but not universal. Offering these can provide a competitive edge.
Recommendations for Hosts
- Ensure your listing includes all essential amenities for Maurertown: Free parking on premises, Heating, Outdoor furniture.
- Prioritize adding missing essentials: Heating, Outdoor furniture.
- Consider adding popular differentiators like Hot water or Air conditioning to increase appeal.
- Highlight unique or less common amenities you offer (e.g., hot tub, dedicated workspace, EV charger) in your listing description and photos.
- Regularly check competitor amenities in Maurertown to stay competitive.
Maurertown Airbnb Guest Demographics & Profile Analysis (2026)
Guest Profile Summary for Maurertown
- The typical guest profile for Airbnb in Maurertown consists of primarily domestic travelers (90%), often arriving from nearby Washington, typically belonging to the Post-2000s (Gen Z/Alpha) group (50%), primarily speaking English or Spanish.
- Domestic travelers account for 89.6% of guests.
- Key international markets include United States (89.6%) and DC (8%).
- Top languages spoken are English (66.7%) followed by Spanish (19.5%).
- A significant demographic segment is the Post-2000s (Gen Z/Alpha) group, representing 50% of guests.
Recommendations for Hosts
- Target domestic marketing efforts towards travelers from Washington and Alexandria.
- Tailor amenities and listing descriptions to appeal to the dominant Post-2000s (Gen Z/Alpha) demographic (e.g., highlight fast WiFi, smart home features, local guides).
- Highlight unique local experiences or amenities relevant to the primary guest profile.
- Consider seasonal promotions aligned with peak travel times for key origin markets.
Nearby Short-Term Rental Market Comparison
How does the Maurertown Airbnb market stack up against its neighbors? Compare key performance metrics like average monthly revenue, ADR, and occupancy rates in surrounding areas to understand the broader regional STR landscape.
| Market | Active Properties | Monthly Revenue | Daily Rate | Avg. Occupancy |
|---|---|---|---|---|
| McGaheysville | 83 | $6,156 | $431.72 | 45% |
| Shannondale | 45 | $5,808 | $337.30 | 54% |
| Penhook | 18 | $5,675 | $678.75 | 37% |
| Bentonville | 23 | $5,372 | $420.82 | 51% |
| Nellysford | 62 | $5,276 | $426.33 | 39% |
| Bumpass | 120 | $4,851 | $553.01 | 33% |
| Mineral | 231 | $4,800 | $474.55 | 36% |
| Shenandoah | 104 | $4,778 | $354.44 | 47% |
| Middleburg | 39 | $4,681 | $485.11 | 41% |
| Skyland Estates | 14 | $4,649 | $280.30 | 55% |