Massanutten Airbnb Market Analysis 2026: Short Term Rental Data & Vacation Rental Statistics in Virginia, United States
Is Airbnb profitable in Massanutten in 2026? Explore comprehensive Airbnb analytics for Massanutten, Virginia, United States to uncover income potential. This 2026 STR market report for Massanutten, based on AirROI data from February 2025 to January 2026, reveals key trends in the market of 310 active listings.
Whether you're considering an Airbnb investment in Massanutten, optimizing your existing vacation rental, or exploring rental arbitrage opportunities, understanding the Massanutten Airbnb data is crucial. Leveraging the low regulation environment is key to maximizing your short term rental income potential. Let's dive into the specifics.
Key Massanutten Airbnb Performance Metrics Overview
Monthly Airbnb Revenue Variations & Income Potential in Massanutten (2026)
Understanding the monthly revenue variations for Airbnb listings in Massanutten is key to maximizing your short term rental income potential. Seasonality significantly impacts earnings. Our analysis, based on data from the past 12 months, shows that the peak revenue month for STRs in Massanutten is typically December, while September often presents the lowest earnings, highlighting opportunities for strategic pricing adjustments during shoulder and low seasons. Explore the typical Airbnb income in Massanutten across different performance tiers:
- Best-in-class properties (Top 10%) achieve $9,956+ monthly, often utilizing dynamic pricing and superior guest experiences.
- Strong performing properties (Top 25%) earn $6,246 or more, indicating effective management and desirable locations/amenities.
- Typical properties (Median) generate around $3,464 per month, representing the average market performance.
- Entry-level properties (Bottom 25%) see earnings around $1,799, often with potential for optimization.
Average Monthly Airbnb Earnings Trend in Massanutten
Massanutten Airbnb Occupancy Rate Trends (2026)
Maximize your bookings by understanding the Massanutten STR occupancy trends. Seasonal demand shifts significantly influence how often properties are booked. Typically, Februarysees the highest demand (peak season occupancy), while September experiences the lowest (low season). Effective strategies, like adjusting minimum stays or offering promotions, can boost occupancy during slower periods. Here's how different property tiers perform in Massanutten:
- Best-in-class properties (Top 10%) achieve 65%+ occupancy, indicating high desirability and potentially optimized availability.
- Strong performing properties (Top 25%) maintain 49% or higher occupancy, suggesting good market fit and guest satisfaction.
- Typical properties (Median) have an occupancy rate around 32%.
- Entry-level properties (Bottom 25%) average 20% occupancy, potentially facing higher vacancy.
Average Monthly Occupancy Rate Trend in Massanutten
Average Daily Rate (ADR) Airbnb Trends in Massanutten (2026)
Effective short term rental pricing strategy in Massanutten involves understanding monthly ADR fluctuations. The Average Daily Rate (ADR) for Airbnb in Massanutten typically peaks in December and dips lowest during March. Leveraging Airbnb dynamic pricing tools or strategies based on this seasonality can significantly boost revenue. Here's a look at the typical nightly rates achieved:
- Best-in-class properties (Top 10%) command rates of $615+ per night, often due to premium features or locations.
- Strong performing properties (Top 25%) achieve nightly rates of $432 or more.
- Typical properties (Median) charge around $307 per night.
- Entry-level properties (Bottom 25%) earn around $223 per night.
Average Daily Rate (ADR) Trend by Month in Massanutten
Get Live Massanutten Market Intelligence 👇

Explore Real-time Analytics
Airbnb Seasonality Analysis & Trends in Massanutten (2026)
Peak Season (December, July, January)
- Revenue averages $6,143 per month
- Occupancy rates average 39.0%
- Daily rates average $410
Shoulder Season
- Revenue averages $4,757 per month
- Occupancy maintains around 37.1%
- Daily rates hold near $362
Low Season (March, April, September)
- Revenue drops to average $3,321 per month
- Occupancy decreases to average 29.6%
- Daily rates adjust to average $327
Seasonality Insights for Massanutten
- The Airbnb seasonality in Massanutten shows highly seasonal trends requiring careful strategy. While the sections above show seasonal averages, it's also insightful to look at the extremes:
- During the high season, the absolute peak month showcases Massanutten's highest earning potential, with monthly revenues capable of climbing to $6,971, occupancy reaching a high of 42.5%, and ADRs peaking at $446.
- Conversely, the slowest single month of the year, typically falling within the low season, marks the market's lowest point. In this month, revenue might dip to $3,064, occupancy could drop to 23.0%, and ADRs may adjust down to $301.
- Understanding both the seasonal averages and these monthly peaks and troughs in revenue, occupancy, and ADR is crucial for maximizing your Airbnb profit potential in Massanutten.
Seasonal Strategies for Maximizing Profit
- Peak Season: Maximize revenue through premium pricing and potentially longer minimum stays. Ensure high availability.
- Low Season: Offer competitive pricing, special promotions (e.g., extended stay discounts), and flexible cancellation policies. Target off-season travelers like remote workers or budget-conscious guests.
- Shoulder Seasons: Implement dynamic pricing that balances peak and low rates. Target weekend travelers or specific events. Offer slightly more flexible terms than peak season.
- Regularly analyze your own performance against these Massanutten seasonality benchmarks and adjust your pricing and availability strategy accordingly.
Best Areas for Airbnb Investment in Massanutten (2026)
Exploring the top neighborhoods for short-term rentals in Massanutten? This section highlights key areas, outlining why they are attractive for hosts and guests, along with notable local attractions. Consider these locations based on your target guest profile and investment strategy.
| Neighborhood / Area | Why Host Here? (Target Guests & Appeal) | Key Attractions & Landmarks |
|---|---|---|
| Massanutten Resort | A popular family-friendly resort offering skiing, water park, and outdoor activities year-round. Attracts tourists seeking active vacations and relaxation. | Massanutten Water Park, Ski Massanutten, Mountain Go-Kart, Massanutten Adventure Park, Golf at Massanutten Resort |
| Shenandoah National Park | A stunning national park nearby, ideal for nature lovers and hikers. Perfect for guests looking to explore the great outdoors and enjoy breathtaking views. | Skyline Drive, Old Rag Mountain, Dark Hollow Falls, Hawksbill Mountain, Compton Gap |
| Harrisonburg | A nearby city with a vibrant downtown, offering restaurants, shops, and cultural events. Great location for guests looking for urban amenities while close to nature. | James Madison University, The Blue Ridge Bus Line, Massanutten Regional Library, Downtown Harrisonburg, Environs Sculpture Park |
| Luray Caverns | Famous caverns with impressive limestone formations, drawing tourists interested in geological wonders and unique experiences. | Luray Caverns, Luray Valley Museum, Garden Maze, Luray Zoo, Skyline Caverns |
| Elkton | A small town close to Massanutten, with easy access to local farms, vineyards, and the picturesque countryside. | Wisteria Farm and Vineyard, Elkton Community Center, Local farmers markets, Elk Run Vineyards, The Blue Ridge Group |
| Woodstock | Charming small town known for its historic sites and proximity to natural attractions, appealing to visitors wanting a quaint experience. | Shenandoah County Courthouse, Woodstock Tower, Meems Bottom Covered Bridge, Shenandoah Music Festival, Natural Art Garden |
| New Market | Rich in history, this town attracts history buffs and those looking to explore Civil War sites. | New Market Battlefields State Historical Park, Virginia Museum of the Civil War, New Market Community Park, Historic New Market, Local antiques shops |
| Stanley | A quaint small town offering visitors a peaceful mountain getaway, ideal for those wanting to escape the hustle and bustle of city life. | Shenandoah River State Park, Stanley Community Center, Hiking Trails, Scenic Views, Nearby vineyards |
Understanding Airbnb License Requirements & STR Laws in Massanutten (2026)
While Massanutten, Virginia, United States currently shows low STR regulations, specific Airbnb license requirements might still exist or change. Always verify the latest short term rental regulations and Airbnb license requirements directly with local government authorities for Massanutten to ensure full compliance before hosting.
(Source: AirROI data, 2026, finding no licensed listings among those analyzed)
Top Performing Airbnb Properties in Massanutten (2026)
Benchmark your potential! Explore examples of top-performing Airbnb properties in Massanuttenbased on Trailing Twelve Month (TTM) revenue. Analyze their characteristics, revenue, occupancy rate, and ADR to understand what drives success in this market.
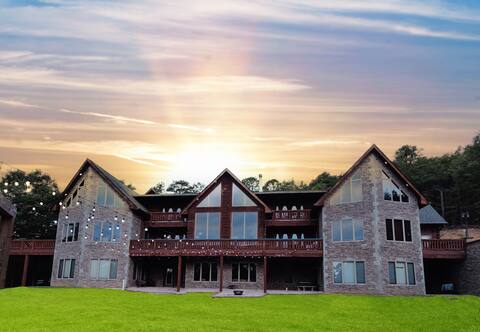
Payton's Peak Mansion Massanutten Mountain Resort
Entire Place • 11 bedrooms
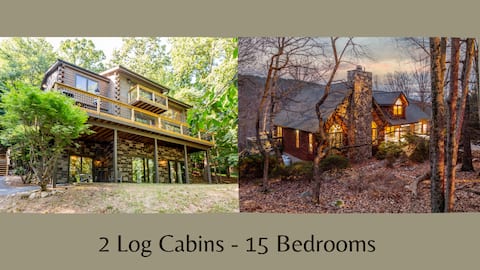
Sprawling 15 BR Log Haven Great for Reunions
Entire Place • 15 bedrooms

Mtn Luxury 12 BR Indoor Pool Hot Tub Near Slopes
Entire Place • 12 bedrooms

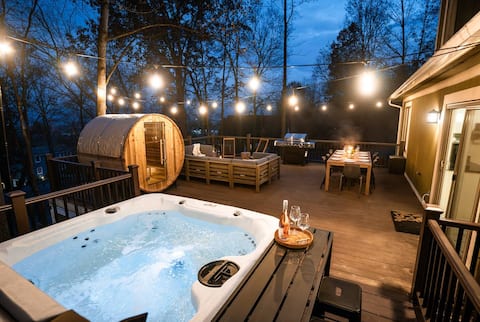
Luxury Retreat | Hot Tub, Theater, Stunning Patio
Entire Place • 8 bedrooms
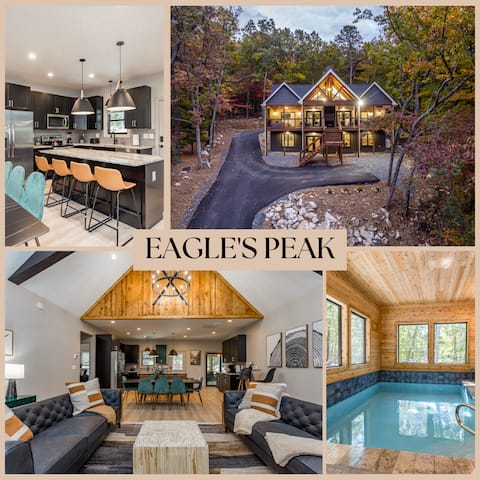
Eagles Peak | Luxe Lodge w/ Indoor Pool & Hot Tubs
Entire Place • 6 bedrooms
7BR Designer Home in Massanutten
Entire Place • 7 bedrooms
Note: Performance varies based on location, size, amenities, seasonality, and management quality. Data reflects the past 12 months.
Top Performing Airbnb Hosts in Massanutten (2026)
Learn from the best! This table showcases top-performing Airbnb hosts in Massanutten based on the number of properties managed and estimated total revenue over the past year. Analyze their scale and performance metrics.
| Host Name | Properties | Grossing Revenue | Stay Reviews | Avg Rating |
|---|---|---|---|---|
| Brian And Sara | 13 | $1,578,953 | 938 | 4.72/5.0 |
| Evolve | 27 | $1,167,416 | 1309 | 4.67/5.0 |
| Sabrina | 6 | $829,490 | 777 | 4.83/5.0 |
| Chris | 5 | $689,145 | 376 | 4.92/5.0 |
| Jeremy | 35 | $571,566 | 838 | 4.62/5.0 |
| Kevin | 20 | $445,916 | 150 | 4.67/5.0 |
| Vacation Properties Made Simpl | 18 | $439,945 | 777 | 4.84/5.0 |
| Germain | 3 | $370,694 | 91 | 4.88/5.0 |
| Kim | 1 | $313,066 | 38 | 4.95/5.0 |
| Erika | 2 | $203,992 | 187 | 4.97/5.0 |
Analyzing the strategies of top hosts, such as their property selection, pricing, and guest communication, can offer valuable lessons for optimizing your own Airbnb operations in Massanutten.
Dive Deeper: Advanced Massanutten STR Market Data (2026)
Ready to unlock more insights? AirROI provides access to advanced metrics and comprehensive Airbnb data for Massanutten. Explore detailed analytics beyond this report to refine your investment strategy, optimize pricing, and maximize your vacation rental profits.
Explore Advanced MetricsMassanutten Short-Term Rental Market Composition (2026): Property & Room Types
Room Type Distribution
Property Type Distribution
Market Composition Insights for Massanutten
- The Massanutten Airbnb market composition is heavily skewed towards Entire Home/Apt listings, which make up 99.4% of the 310 active rentals. This indicates strong guest preference for privacy and space.
- Looking at the property type distribution in Massanutten, House properties are the most common (74.5%), reflecting the local real estate landscape.
- Houses represent a significant 74.5% portion, catering likely to families or larger groups.
- Smaller segments like hotel/boutique, others (combined 0.6%) offer potential for unique stay experiences.
Massanutten Airbnb Room Capacity Analysis (2026): Bedroom Distribution
Distribution of Listings by Number of Bedrooms
Room Capacity Insights for Massanutten
- The dominant room capacity in Massanutten is 5+ bedrooms listings, making up 31.3% of the market. This suggests a strong demand for properties suitable for families or small groups.
- Together, 5+ bedrooms and 4 bedrooms properties represent 56.8% of the active Airbnb listings in Massanutten, indicating a high concentration in these sizes.
- A significant 81.6% of listings offer 3+ bedrooms, catering to larger groups and families seeking more space in Massanutten.
Massanutten Vacation Rental Guest Capacity Trends (2026)
Distribution of Listings by Guest Capacity
Guest Capacity Insights for Massanutten
- The most common guest capacity trend in Massanutten vacation rentals is listings accommodating 8+ guests (78.7%). This suggests the primary traveler segment is likely larger groups.
- Properties designed for 8+ guests and 6 guests dominate the Massanutten STR market, accounting for 91.9% of listings.
- 95.1% of properties accommodate 6+ guests, serving the market segment for larger families or group travel in Massanutten.
- On average, properties in Massanutten are equipped to host 7.5 guests.
Massanutten Airbnb Booking Patterns (2026): Available vs. Booked Days
Available Days Distribution
Booked Days Distribution
Booking Pattern Insights for Massanutten
- The most common availability pattern in Massanutten falls within the 271-366 days range, representing 46.8% of listings. This suggests many properties have significant open periods on their calendars.
- Approximately 87.1% of listings show high availability (181+ days open annually), indicating potential for increased bookings or specific owner usage patterns.
- For booked days, the 91-180 days range is most frequent in Massanutten (41%), reflecting common guest stay durations or potential owner blocking patterns.
- A notable 14.5% of properties secure long booking periods (181+ days booked per year), highlighting successful long-term rental strategies or significant owner usage.
Massanutten Airbnb Minimum Stay Requirements Analysis
Distribution of Listings by Minimum Night Requirement
1 Night
19 listings
6.1% of total
2 Nights
187 listings
60.3% of total
3 Nights
8 listings
2.6% of total
4-6 Nights
8 listings
2.6% of total
7-29 Nights
4 listings
1.3% of total
30+ Nights
84 listings
27.1% of total
Key Insights
- The most prevalent minimum stay requirement in Massanutten is 2 Nights, adopted by 60.3% of listings. This highlights the market's preference for shorter, flexible bookings.
- A strong majority (66.4%) of the Massanutten Airbnb data shows acceptance of very short stays (1-2 nights), indicating a dynamic, high-turnover market.
- A significant segment (27.1%) caters to monthly stays (30+ nights) in Massanutten, pointing to opportunities in the extended-stay market.
Recommendations
- Align with the market by considering a 2 Nights minimum stay, as 60.3% of Massanutten hosts use this setting.
- If feasible, allowing 1-night stays, especially midweek or during low season, could capture last-minute bookings, as only 6.1% currently do.
- A 2-night minimum appears standard (60.3%). Consider this for weekends or peak periods.
- Explore offering discounts for stays of 30+ nights to attract the 27.1% of the market seeking extended stays.
- Adjust minimum nights based on seasonality – potentially shorter during low season and longer during peak demand periods in Massanutten.
Massanutten Airbnb Cancellation Policy Trends Analysis (2026)
Super Strict 60 Days
6 listings
1.9% of total
Limited
7 listings
2.3% of total
Super Strict 30 Days
16 listings
5.2% of total
Flexible
14 listings
4.5% of total
Moderate
51 listings
16.5% of total
Firm
120 listings
38.8% of total
Strict
95 listings
30.7% of total
Cancellation Policy Insights for Massanutten
- The prevailing Airbnb cancellation policy trend in Massanutten is Firm, used by 38.8% of listings.
- A majority (69.5%) of hosts in Massanutten utilize Firm or Strict policies, indicating a market where hosts prioritize booking security.
Recommendations for Hosts
- Consider adopting a Firm policy to align with the 38.8% market standard in Massanutten.
- With 30.7% using Strict terms, this is a viable option in Massanutten, particularly for high-value properties or during peak demand periods.
- Regularly review your cancellation policy against competitors and market demand shifts in Massanutten.
Massanutten STR Booking Lead Time Analysis (2026)
Average Booking Lead Time by Month
Booking Lead Time Insights for Massanutten
- The overall average booking lead time for vacation rentals in Massanutten is 62 days.
- Guests book furthest in advance for stays during May (average 130 days), likely coinciding with peak travel demand or local events.
- The shortest booking windows occur for stays in March (average 31 days), indicating more last-minute travel plans during this time.
- Seasonally, Fall (72 days avg.) sees the longest lead times, while Winter (60 days avg.) has the shortest, reflecting typical travel planning cycles.
Recommendations for Hosts
- Use the overall average lead time (62 days) as a baseline for your pricing and availability strategy in Massanutten.
- For May stays, consider implementing length-of-stay discounts or slightly higher rates for bookings made less than 130 days out to capitalize on advance planning.
- Target marketing efforts for the Fall season well in advance (at least 72 days) to capture early planners.
- Monitor your own booking lead times against these Massanutten averages to identify opportunities for dynamic pricing adjustments.
Popular & Essential Airbnb Amenities in Massanutten (2026)
Amenity Prevalence
Amenity Insights for Massanutten
- Essential amenities in Massanutten that guests expect include: Air conditioning, TV, Smoke alarm, Wifi, Free parking on premises, Heating, Hot water. Lacking these (any) could significantly impact bookings.
- Popular amenities like Coffee maker, Bed linens, Refrigerator are common but not universal. Offering these can provide a competitive edge.
Recommendations for Hosts
- Ensure your listing includes all essential amenities for Massanutten: Air conditioning, TV, Smoke alarm, Wifi, Free parking on premises, Heating, Hot water.
- Prioritize adding missing essentials: Smoke alarm, Wifi, Free parking on premises, Heating, Hot water.
- Consider adding popular differentiators like Coffee maker or Bed linens to increase appeal.
- Highlight unique or less common amenities you offer (e.g., hot tub, dedicated workspace, EV charger) in your listing description and photos.
- Regularly check competitor amenities in Massanutten to stay competitive.
Massanutten Airbnb Guest Demographics & Profile Analysis (2026)
Guest Profile Summary for Massanutten
- The typical guest profile for Airbnb in Massanutten consists of primarily domestic travelers (93%), often arriving from nearby Washington, typically belonging to the Post-2000s (Gen Z/Alpha) group (50%), primarily speaking English or Spanish.
- Domestic travelers account for 92.8% of guests.
- Key international markets include United States (92.8%) and DC (5.2%).
- Top languages spoken are English (73.6%) followed by Spanish (10.6%).
- A significant demographic segment is the Post-2000s (Gen Z/Alpha) group, representing 50% of guests.
Recommendations for Hosts
- Target domestic marketing efforts towards travelers from Washington and Richmond.
- Tailor amenities and listing descriptions to appeal to the dominant Post-2000s (Gen Z/Alpha) demographic (e.g., highlight fast WiFi, smart home features, local guides).
- Highlight unique local experiences or amenities relevant to the primary guest profile.
- Consider seasonal promotions aligned with peak travel times for key origin markets.
Nearby Short-Term Rental Market Comparison
How does the Massanutten Airbnb market stack up against its neighbors? Compare key performance metrics like average monthly revenue, ADR, and occupancy rates in surrounding areas to understand the broader regional STR landscape.
| Market | Active Properties | Monthly Revenue | Daily Rate | Avg. Occupancy |
|---|---|---|---|---|
| McGaheysville | 83 | $6,156 | $431.72 | 45% |
| Shannondale | 45 | $5,808 | $337.30 | 54% |
| Penhook | 18 | $5,675 | $678.75 | 37% |
| Bentonville | 23 | $5,372 | $420.82 | 51% |
| Nellysford | 62 | $5,276 | $426.33 | 39% |
| Bumpass | 120 | $4,851 | $553.01 | 33% |
| Mineral | 231 | $4,800 | $474.55 | 36% |
| Shenandoah | 104 | $4,778 | $354.44 | 47% |
| Middleburg | 39 | $4,681 | $485.11 | 41% |
| Skyland Estates | 14 | $4,649 | $280.30 | 55% |