Lyndhurst Airbnb Market Analysis 2026: Short Term Rental Data & Vacation Rental Statistics in Virginia, United States
Is Airbnb profitable in Lyndhurst in 2026? Explore comprehensive Airbnb analytics for Lyndhurst, Virginia, United States to uncover income potential. This 2026 STR market report for Lyndhurst, based on AirROI data from February 2025 to January 2026, reveals key trends in the niche market of 26 active listings.
Whether you're considering an Airbnb investment in Lyndhurst, optimizing your existing vacation rental, or exploring rental arbitrage opportunities, understanding the Lyndhurst Airbnb data is crucial. Leveraging the low regulation environment is key to maximizing your short term rental income potential. Let's dive into the specifics.
Key Lyndhurst Airbnb Performance Metrics Overview
Monthly Airbnb Revenue Variations & Income Potential in Lyndhurst (2026)
Understanding the monthly revenue variations for Airbnb listings in Lyndhurst is key to maximizing your short term rental income potential. Seasonality significantly impacts earnings. Our analysis, based on data from the past 12 months, shows that the peak revenue month for STRs in Lyndhurst is typically October, while January often presents the lowest earnings, highlighting opportunities for strategic pricing adjustments during shoulder and low seasons. Explore the typical Airbnb income in Lyndhurst across different performance tiers:
- Best-in-class properties (Top 10%) achieve $4,317+ monthly, often utilizing dynamic pricing and superior guest experiences.
- Strong performing properties (Top 25%) earn $2,804 or more, indicating effective management and desirable locations/amenities.
- Typical properties (Median) generate around $1,614 per month, representing the average market performance.
- Entry-level properties (Bottom 25%) see earnings around $1,010, often with potential for optimization.
Average Monthly Airbnb Earnings Trend in Lyndhurst
Lyndhurst Airbnb Occupancy Rate Trends (2026)
Maximize your bookings by understanding the Lyndhurst STR occupancy trends. Seasonal demand shifts significantly influence how often properties are booked. Typically, Octobersees the highest demand (peak season occupancy), while January experiences the lowest (low season). Effective strategies, like adjusting minimum stays or offering promotions, can boost occupancy during slower periods. Here's how different property tiers perform in Lyndhurst:
- Best-in-class properties (Top 10%) achieve 53%+ occupancy, indicating high desirability and potentially optimized availability.
- Strong performing properties (Top 25%) maintain 36% or higher occupancy, suggesting good market fit and guest satisfaction.
- Typical properties (Median) have an occupancy rate around 25%.
- Entry-level properties (Bottom 25%) average 16% occupancy, potentially facing higher vacancy.
Average Monthly Occupancy Rate Trend in Lyndhurst
Average Daily Rate (ADR) Airbnb Trends in Lyndhurst (2026)
Effective short term rental pricing strategy in Lyndhurst involves understanding monthly ADR fluctuations. The Average Daily Rate (ADR) for Airbnb in Lyndhurst typically peaks in October and dips lowest during February. Leveraging Airbnb dynamic pricing tools or strategies based on this seasonality can significantly boost revenue. Here's a look at the typical nightly rates achieved:
- Best-in-class properties (Top 10%) command rates of $400+ per night, often due to premium features or locations.
- Strong performing properties (Top 25%) achieve nightly rates of $276 or more.
- Typical properties (Median) charge around $221 per night.
- Entry-level properties (Bottom 25%) earn around $145 per night.
Average Daily Rate (ADR) Trend by Month in Lyndhurst
Get Live Lyndhurst Market Intelligence 👇

Explore Real-time Analytics
Airbnb Seasonality Analysis & Trends in Lyndhurst (2026)
Peak Season (October, November, July)
- Revenue averages $2,991 per month
- Occupancy rates average 35.5%
- Daily rates average $257
Shoulder Season
- Revenue averages $2,143 per month
- Occupancy maintains around 28.7%
- Daily rates hold near $239
Low Season (January, March, April)
- Revenue drops to average $1,351 per month
- Occupancy decreases to average 21.8%
- Daily rates adjust to average $229
Seasonality Insights for Lyndhurst
- The Airbnb seasonality in Lyndhurst shows highly seasonal trends requiring careful strategy. While the sections above show seasonal averages, it's also insightful to look at the extremes:
- During the high season, the absolute peak month showcases Lyndhurst's highest earning potential, with monthly revenues capable of climbing to $3,463, occupancy reaching a high of 40.9%, and ADRs peaking at $268.
- Conversely, the slowest single month of the year, typically falling within the low season, marks the market's lowest point. In this month, revenue might dip to $1,303, occupancy could drop to 16.4%, and ADRs may adjust down to $218.
- Understanding both the seasonal averages and these monthly peaks and troughs in revenue, occupancy, and ADR is crucial for maximizing your Airbnb profit potential in Lyndhurst.
Seasonal Strategies for Maximizing Profit
- Peak Season: Maximize revenue through premium pricing and potentially longer minimum stays. Ensure high availability.
- Low Season: Offer competitive pricing, special promotions (e.g., extended stay discounts), and flexible cancellation policies. Target off-season travelers like remote workers or budget-conscious guests.
- Shoulder Seasons: Implement dynamic pricing that balances peak and low rates. Target weekend travelers or specific events. Offer slightly more flexible terms than peak season.
- Regularly analyze your own performance against these Lyndhurst seasonality benchmarks and adjust your pricing and availability strategy accordingly.
Best Areas for Airbnb Investment in Lyndhurst (2026)
Exploring the top neighborhoods for short-term rentals in Lyndhurst? This section highlights key areas, outlining why they are attractive for hosts and guests, along with notable local attractions. Consider these locations based on your target guest profile and investment strategy.
| Neighborhood / Area | Why Host Here? (Target Guests & Appeal) | Key Attractions & Landmarks |
|---|---|---|
| Historic Lyndhurst | Charming historical district with beautiful architecture, close to local shops and restaurants. Appeals to visitors looking for small-town charm and history. | Lyndhurst Mansion, Lake District, Shenandoah National Park, Local vineyards, Hiking trails |
| Lakeview | Picturesque areas near local lakes and parks, ideal for nature lovers and outdoor enthusiasts. Perfect for families visiting for recreational activities. | Lake Lyndhurst, Fishing spots, Picnic areas, Birdwatching, Hiking trails |
| Downtown Lyndhurst | The bustling center of the town with a mix of dining, shopping, and events. Popular with visitors looking for convenience and accessibility. | Local restaurants, Cafes, Art galleries, Historic sites, Community events |
| Shenandoah Valley | Scenic valley known for breathtaking views, vineyards, and outdoor adventures. Attracts tourists seeking relaxation and exploration of nature. | Skyline Drive, Vineyards, Caves, Horseback riding, Hiking trails |
| Catoctin Mountain Park | Natural park with mountainous terrain, ideal for hiking and wildlife observation. Perfect for adventurers and families. | Hiking trails, Camping grounds, Wildlife watching, Scenic outlooks, Rock climbing |
| Blue Ridge Parkway | Renowned scenic drive with stunning views and outdoor activities, appealing to road trippers and nature lovers. | Scenic overviews, Hiking trails, Picnic areas, Visitor centers, Wildflower viewing |
| Local Vineyards | Famous for its wineries and vineyards producing local wines, attracting wine lovers and those looking for unique experiences in wine tasting. | Wine tours, Tasting rooms, Grape picking, Wine festivals, Beautiful landscapes |
| Cultural Hub | A vibrant area filled with arts and culture, attracting visitors interested in local art, music, and theater. | Art shows, Theater performances, Music festivals, Local artisan shops, Cultural events |
Understanding Airbnb License Requirements & STR Laws in Lyndhurst (2026)
While Lyndhurst, Virginia, United States currently shows low STR regulations, specific Airbnb license requirements might still exist or change. Always verify the latest short term rental regulations and Airbnb license requirements directly with local government authorities for Lyndhurst to ensure full compliance before hosting.
(Source: AirROI data, 2026, finding no licensed listings among those analyzed)
Top Performing Airbnb Properties in Lyndhurst (2026)
Benchmark your potential! Explore examples of top-performing Airbnb properties in Lyndhurstbased on Trailing Twelve Month (TTM) revenue. Analyze their characteristics, revenue, occupancy rate, and ADR to understand what drives success in this market.
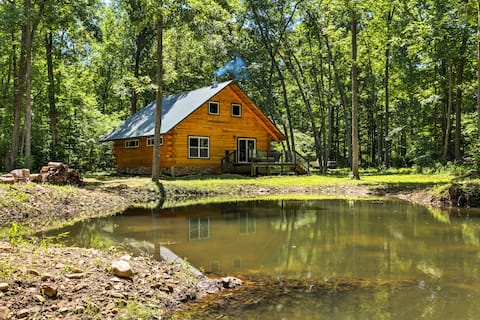
Lyndhurst Cabin on Farm w/ Pond & Stocked Stream!
Entire Place • 1 bedroom

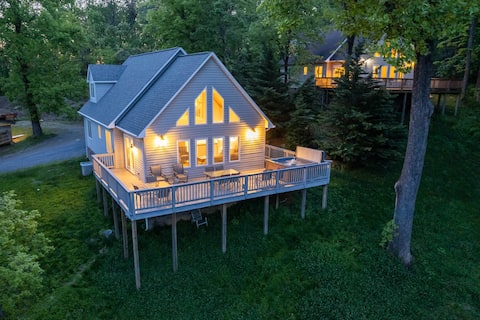
Peak Retreat – Private Luxury A-Frame for Couples
Entire Place • 2 bedrooms
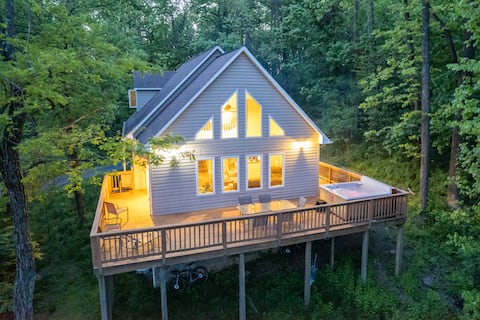
Torry Ridge - Hot Tub & Views
Entire Place • 3 bedrooms
Ravens Roost: Mountain Views w/ Hot Tub
Entire Place • 3 bedrooms
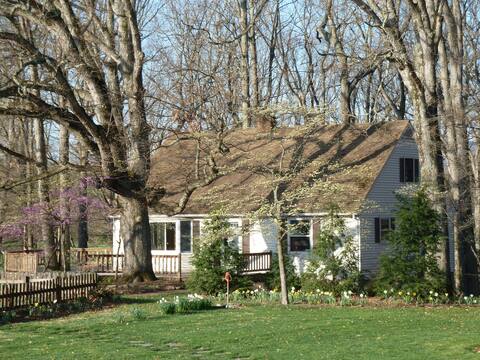
Oak Tree Cottage - beautiful farm, mountain views.
Entire Place • 4 bedrooms

Sherando Cabin-3+ BR w/ Hot Tub
Entire Place • 4 bedrooms
Note: Performance varies based on location, size, amenities, seasonality, and management quality. Data reflects the past 12 months.
Top Performing Airbnb Hosts in Lyndhurst (2026)
Learn from the best! This table showcases top-performing Airbnb hosts in Lyndhurst based on the number of properties managed and estimated total revenue over the past year. Analyze their scale and performance metrics.
| Host Name | Properties | Grossing Revenue | Stay Reviews | Avg Rating |
|---|---|---|---|---|
| Oliver And Natasha | 14 | $289,989 | 184 | 4.75/5.0 |
| Evolve | 1 | $67,504 | 135 | 4.90/5.0 |
| Lynne | 3 | $64,036 | 304 | 4.98/5.0 |
| Scott & Heather | Koehler Vaca | 1 | $57,636 | 20 | 5.00/5.0 |
| Adam | 4 | $44,316 | 163 | 4.77/5.0 |
| Karen | 1 | $30,479 | 109 | 4.97/5.0 |
| Shellie | 1 | $16,505 | 69 | 4.94/5.0 |
| Jennifer | 1 | $4,430 | 1 | Not Rated |
Analyzing the strategies of top hosts, such as their property selection, pricing, and guest communication, can offer valuable lessons for optimizing your own Airbnb operations in Lyndhurst.
Dive Deeper: Advanced Lyndhurst STR Market Data (2026)
Ready to unlock more insights? AirROI provides access to advanced metrics and comprehensive Airbnb data for Lyndhurst. Explore detailed analytics beyond this report to refine your investment strategy, optimize pricing, and maximize your vacation rental profits.
Explore Advanced MetricsLyndhurst Short-Term Rental Market Composition (2026): Property & Room Types
Room Type Distribution
Property Type Distribution
Market Composition Insights for Lyndhurst
- The Lyndhurst Airbnb market composition is heavily skewed towards Entire Home/Apt listings, which make up 92.3% of the 26 active rentals. This indicates strong guest preference for privacy and space.
- Looking at the property type distribution in Lyndhurst, Outdoor/Unique properties are the most common (69.2%), reflecting the local real estate landscape.
- Houses represent a significant 23.1% portion, catering likely to families or larger groups.
- Smaller segments like hotel/boutique, others (combined 7.6%) offer potential for unique stay experiences.
Lyndhurst Airbnb Room Capacity Analysis (2026): Bedroom Distribution
Distribution of Listings by Number of Bedrooms
Room Capacity Insights for Lyndhurst
- The dominant room capacity in Lyndhurst is 1 bedroom listings, making up 53.8% of the market. This suggests a strong demand for properties suitable for couples or solo travelers.
- Together, 1 bedroom and 2 bedrooms properties represent 73.0% of the active Airbnb listings in Lyndhurst, indicating a high concentration in these sizes.
- With over half the market (53.8%) consisting of studios or 1-bedroom units, Lyndhurst is particularly well-suited for individuals or couples.
Lyndhurst Vacation Rental Guest Capacity Trends (2026)
Distribution of Listings by Guest Capacity
Guest Capacity Insights for Lyndhurst
- The most common guest capacity trend in Lyndhurst vacation rentals is listings accommodating 4 guests (26.9%). This suggests the primary traveler segment is likely small families or groups.
- Properties designed for 4 guests and 2 guests dominate the Lyndhurst STR market, accounting for 50.0% of listings.
- 34.6% of properties accommodate 6+ guests, serving the market segment for larger families or group travel in Lyndhurst.
- On average, properties in Lyndhurst are equipped to host 4.4 guests.
Lyndhurst Airbnb Booking Patterns (2026): Available vs. Booked Days
Available Days Distribution
Booked Days Distribution
Booking Pattern Insights for Lyndhurst
- The most common availability pattern in Lyndhurst falls within the 271-366 days range, representing 65.4% of listings. This suggests many properties have significant open periods on their calendars.
- Approximately 92.3% of listings show high availability (181+ days open annually), indicating potential for increased bookings or specific owner usage patterns.
- For booked days, the 31-90 days range is most frequent in Lyndhurst (61.5%), reflecting common guest stay durations or potential owner blocking patterns.
- A notable 7.6% of properties secure long booking periods (181+ days booked per year), highlighting successful long-term rental strategies or significant owner usage.
Lyndhurst Airbnb Minimum Stay Requirements Analysis
Distribution of Listings by Minimum Night Requirement
1 Night
18 listings
69.2% of total
2 Nights
3 listings
11.5% of total
30+ Nights
5 listings
19.2% of total
Key Insights
- The most prevalent minimum stay requirement in Lyndhurst is 1 Night, adopted by 69.2% of listings. This highlights the market's preference for shorter, flexible bookings.
- A strong majority (80.7%) of the Lyndhurst Airbnb data shows acceptance of very short stays (1-2 nights), indicating a dynamic, high-turnover market.
- A significant segment (19.2%) caters to monthly stays (30+ nights) in Lyndhurst, pointing to opportunities in the extended-stay market.
Recommendations
- Align with the market by considering a 1 Night minimum stay, as 69.2% of Lyndhurst hosts use this setting.
- Explore offering discounts for stays of 30+ nights to attract the 19.2% of the market seeking extended stays.
- Adjust minimum nights based on seasonality – potentially shorter during low season and longer during peak demand periods in Lyndhurst.
Lyndhurst Airbnb Cancellation Policy Trends Analysis (2026)
Flexible
3 listings
11.5% of total
Moderate
3 listings
11.5% of total
Firm
12 listings
46.2% of total
Strict
8 listings
30.8% of total
Cancellation Policy Insights for Lyndhurst
- The prevailing Airbnb cancellation policy trend in Lyndhurst is Firm, used by 46.2% of listings.
- A majority (77.0%) of hosts in Lyndhurst utilize Firm or Strict policies, indicating a market where hosts prioritize booking security.
Recommendations for Hosts
- Consider adopting a Firm policy to align with the 46.2% market standard in Lyndhurst.
- With 30.8% using Strict terms, this is a viable option in Lyndhurst, particularly for high-value properties or during peak demand periods.
- Regularly review your cancellation policy against competitors and market demand shifts in Lyndhurst.
Lyndhurst STR Booking Lead Time Analysis (2026)
Average Booking Lead Time by Month
Booking Lead Time Insights for Lyndhurst
- The overall average booking lead time for vacation rentals in Lyndhurst is 105 days.
- Guests book furthest in advance for stays during October (average 210 days), likely coinciding with peak travel demand or local events.
- The shortest booking windows occur for stays in January (average 25 days), indicating more last-minute travel plans during this time.
- Seasonally, Fall (179 days avg.) sees the longest lead times, while Winter (59 days avg.) has the shortest, reflecting typical travel planning cycles.
Recommendations for Hosts
- Use the overall average lead time (105 days) as a baseline for your pricing and availability strategy in Lyndhurst.
- For October stays, consider implementing length-of-stay discounts or slightly higher rates for bookings made less than 210 days out to capitalize on advance planning.
- Target marketing efforts for the Fall season well in advance (at least 179 days) to capture early planners.
- Monitor your own booking lead times against these Lyndhurst averages to identify opportunities for dynamic pricing adjustments.
Popular & Essential Airbnb Amenities in Lyndhurst (2026)
Amenity Prevalence
Amenity Insights for Lyndhurst
- Essential amenities in Lyndhurst that guests expect include: Air conditioning, Kitchen, BBQ grill, Free parking on premises, Carbon monoxide alarm, Fire extinguisher, Smoke alarm, Heating, Cooking basics. Lacking these (any) could significantly impact bookings.
- Popular amenities like Hot water are common but not universal. Offering these can provide a competitive edge.
Recommendations for Hosts
- Ensure your listing includes all essential amenities for Lyndhurst: Air conditioning, Kitchen, BBQ grill, Free parking on premises, Carbon monoxide alarm, Fire extinguisher, Smoke alarm, Heating, Cooking basics.
- Prioritize adding missing essentials: Carbon monoxide alarm, Fire extinguisher, Smoke alarm, Heating, Cooking basics.
- Consider adding popular differentiators like Hot water to increase appeal.
- Highlight unique or less common amenities you offer (e.g., hot tub, dedicated workspace, EV charger) in your listing description and photos.
- Regularly check competitor amenities in Lyndhurst to stay competitive.
Lyndhurst Airbnb Guest Demographics & Profile Analysis (2026)
Guest Profile Summary for Lyndhurst
- The typical guest profile for Airbnb in Lyndhurst consists of primarily domestic travelers (93%), often arriving from nearby Richmond, typically belonging to the Post-2000s (Gen Z/Alpha) group (50%), primarily speaking English or Spanish.
- Domestic travelers account for 93.1% of guests.
- Key international markets include United States (93.1%) and DC (3%).
- Top languages spoken are English (68.3%) followed by Spanish (7.3%).
- A significant demographic segment is the Post-2000s (Gen Z/Alpha) group, representing 50% of guests.
Recommendations for Hosts
- Target domestic marketing efforts towards travelers from Richmond and Virginia Beach.
- Tailor amenities and listing descriptions to appeal to the dominant Post-2000s (Gen Z/Alpha) demographic (e.g., highlight fast WiFi, smart home features, local guides).
- Highlight unique local experiences or amenities relevant to the primary guest profile.
- Consider seasonal promotions aligned with peak travel times for key origin markets.
Nearby Short-Term Rental Market Comparison
How does the Lyndhurst Airbnb market stack up against its neighbors? Compare key performance metrics like average monthly revenue, ADR, and occupancy rates in surrounding areas to understand the broader regional STR landscape.
| Market | Active Properties | Monthly Revenue | Daily Rate | Avg. Occupancy |
|---|---|---|---|---|
| McGaheysville | 83 | $6,156 | $431.72 | 45% |
| Penhook | 18 | $5,675 | $678.75 | 37% |
| Bentonville | 23 | $5,372 | $420.82 | 51% |
| Nellysford | 62 | $5,276 | $426.33 | 39% |
| Bumpass | 120 | $4,851 | $553.01 | 33% |
| Mineral | 231 | $4,800 | $474.55 | 36% |
| Shenandoah | 104 | $4,778 | $354.44 | 47% |
| Middleburg | 39 | $4,681 | $485.11 | 41% |
| Skyland Estates | 14 | $4,649 | $280.30 | 55% |
| Castleton | 11 | $4,646 | $528.43 | 30% |