Leesylvania Airbnb Market Analysis 2026: Short Term Rental Data & Vacation Rental Statistics in Virginia, United States
Is Airbnb profitable in Leesylvania in 2026? Explore comprehensive Airbnb analytics for Leesylvania, Virginia, United States to uncover income potential. This 2026 STR market report for Leesylvania, based on AirROI data from February 2025 to January 2026, reveals key trends in the niche market of 28 active listings.
Whether you're considering an Airbnb investment in Leesylvania, optimizing your existing vacation rental, or exploring rental arbitrage opportunities, understanding the Leesylvania Airbnb data is crucial. Leveraging the low regulation environment is key to maximizing your short term rental income potential. Let's dive into the specifics.
Key Leesylvania Airbnb Performance Metrics Overview
Monthly Airbnb Revenue Variations & Income Potential in Leesylvania (2026)
Understanding the monthly revenue variations for Airbnb listings in Leesylvania is key to maximizing your short term rental income potential. Seasonality significantly impacts earnings. Our analysis, based on data from the past 12 months, shows that the peak revenue month for STRs in Leesylvania is typically July, while January often presents the lowest earnings, highlighting opportunities for strategic pricing adjustments during shoulder and low seasons. Explore the typical Airbnb income in Leesylvania across different performance tiers:
- Best-in-class properties (Top 10%) achieve $4,988+ monthly, often utilizing dynamic pricing and superior guest experiences.
- Strong performing properties (Top 25%) earn $1,943 or more, indicating effective management and desirable locations/amenities.
- Typical properties (Median) generate around $576 per month, representing the average market performance.
- Entry-level properties (Bottom 25%) see earnings around $253, often with potential for optimization.
Average Monthly Airbnb Earnings Trend in Leesylvania
Leesylvania Airbnb Occupancy Rate Trends (2026)
Maximize your bookings by understanding the Leesylvania STR occupancy trends. Seasonal demand shifts significantly influence how often properties are booked. Typically, Februarysees the highest demand (peak season occupancy), while January experiences the lowest (low season). Effective strategies, like adjusting minimum stays or offering promotions, can boost occupancy during slower periods. Here's how different property tiers perform in Leesylvania:
- Best-in-class properties (Top 10%) achieve 79%+ occupancy, indicating high desirability and potentially optimized availability.
- Strong performing properties (Top 25%) maintain 67% or higher occupancy, suggesting good market fit and guest satisfaction.
- Typical properties (Median) have an occupancy rate around 38%.
- Entry-level properties (Bottom 25%) average 18% occupancy, potentially facing higher vacancy.
Average Monthly Occupancy Rate Trend in Leesylvania
Average Daily Rate (ADR) Airbnb Trends in Leesylvania (2026)
Effective short term rental pricing strategy in Leesylvania involves understanding monthly ADR fluctuations. The Average Daily Rate (ADR) for Airbnb in Leesylvania typically peaks in July and dips lowest during September. Leveraging Airbnb dynamic pricing tools or strategies based on this seasonality can significantly boost revenue. Here's a look at the typical nightly rates achieved:
- Best-in-class properties (Top 10%) command rates of $245+ per night, often due to premium features or locations.
- Strong performing properties (Top 25%) achieve nightly rates of $100 or more.
- Typical properties (Median) charge around $48 per night.
- Entry-level properties (Bottom 25%) earn around $39 per night.
Average Daily Rate (ADR) Trend by Month in Leesylvania
Get Live Leesylvania Market Intelligence 👇
Explore Real-time Analytics
Airbnb Seasonality Analysis & Trends in Leesylvania (2026)
Peak Season (July, June, August)
- Revenue averages $1,863 per month
- Occupancy rates average 40.8%
- Daily rates average $111
Shoulder Season
- Revenue averages $1,524 per month
- Occupancy maintains around 42.7%
- Daily rates hold near $94
Low Season (January, February, March)
- Revenue drops to average $1,065 per month
- Occupancy decreases to average 44.4%
- Daily rates adjust to average $97
Seasonality Insights for Leesylvania
- The Airbnb seasonality in Leesylvania shows highly seasonal trends requiring careful strategy. While the sections above show seasonal averages, it's also insightful to look at the extremes:
- During the high season, the absolute peak month showcases Leesylvania's highest earning potential, with monthly revenues capable of climbing to $2,000, occupancy reaching a high of 57.0%, and ADRs peaking at $113.
- Conversely, the slowest single month of the year, typically falling within the low season, marks the market's lowest point. In this month, revenue might dip to $860, occupancy could drop to 31.1%, and ADRs may adjust down to $89.
- Understanding both the seasonal averages and these monthly peaks and troughs in revenue, occupancy, and ADR is crucial for maximizing your Airbnb profit potential in Leesylvania.
Seasonal Strategies for Maximizing Profit
- Peak Season: Maximize revenue through premium pricing and potentially longer minimum stays. Ensure high availability.
- Low Season: Offer competitive pricing, special promotions (e.g., extended stay discounts), and flexible cancellation policies. Target off-season travelers like remote workers or budget-conscious guests.
- Shoulder Seasons: Implement dynamic pricing that balances peak and low rates. Target weekend travelers or specific events. Offer slightly more flexible terms than peak season.
- Regularly analyze your own performance against these Leesylvania seasonality benchmarks and adjust your pricing and availability strategy accordingly.
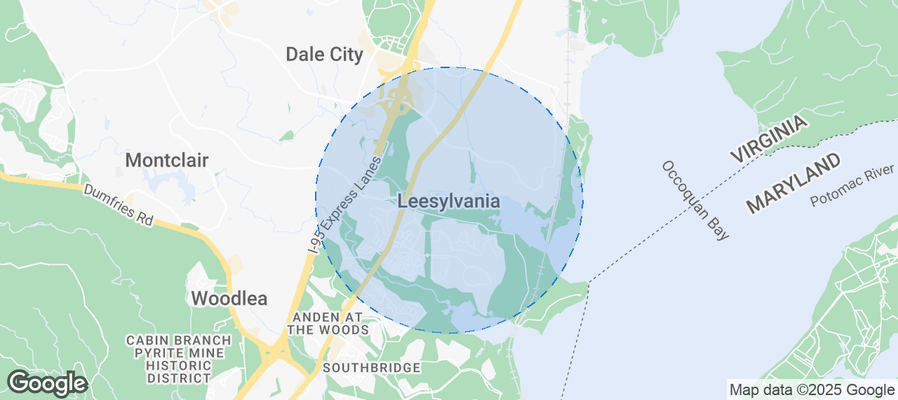
Best Areas for Airbnb Investment in Leesylvania (2026)
Exploring the top neighborhoods for short-term rentals in Leesylvania? This section highlights key areas, outlining why they are attractive for hosts and guests, along with notable local attractions. Consider these locations based on your target guest profile and investment strategy.
| Neighborhood / Area | Why Host Here? (Target Guests & Appeal) | Key Attractions & Landmarks |
|---|---|---|
| Occoquan Bay National Wildlife Refuge | A beautiful natural area that attracts nature lovers and bird watchers. Perfect for guests seeking outdoor experiences and tranquility away from the urban chaos. | Occoquan Bay, Wildlife Viewing, Hiking Trails, Bird Watching, Visitor Center |
| Leesylvania State Park | This scenic park along the Potomac River offers outdoor activities such as hiking, fishing, and picnicking. Ideal for families and nature enthusiasts. | Potomac River Views, Hiking Trails, Picnic Areas, Fishing Spots, Visitor Center |
| Historic Occoquan | A charming small town with a historic district, boutiques, and waterfront views. Great for visitors looking for a quaint, picturesque getaway. | Occoquan River, Historic Shops, Dining, Art Galleries, Annual Festivals |
| Lake Ridge | A suburban area with access to local amenities and recreational activities. Popular with families and business travelers looking for a residential feel. | Lake Ridge Park, Golf Courses, Community Events, Shopping Centers, Parks |
| Woodbridge | A developed suburban community close to Washington D.C. Offers both residential comfort and urban accessibility for guests wishing to explore the capital. | Potomac Mills Mall, Waterfront Park, Local Dining, Historic Sites, Occoquan Regional Park |
| Dale City | A rapidly growing suburban area, offering various dining and shopping options. Attracts families and individuals looking for convenient access to D.C. | Dale City Farmer's Market, Parks, Shopping Centers, Local Dining, Community Services |
| Mason Neck State Park | Adjacent to the National Wildlife Refuge, this area is known for its diverse wildlife and beautiful natural scenery. Great for eco-tourists and families. | Eco-Tours, Hiking Trails, Wildlife Observation, Kayaking, Nature Programs |
| Prince William Forest Park | This large national park features forests, streams, and trails perfect for hiking, biking, and camping. Ideal for outdoor enthusiasts and families. | Trails, Camping Areas, Visitor Center, Historic Cabins, Scenic Views |
Understanding Airbnb License Requirements & STR Laws in Leesylvania (2026)
While Leesylvania, Virginia, United States currently shows low STR regulations, specific Airbnb license requirements might still exist or change. Always verify the latest short term rental regulations and Airbnb license requirements directly with local government authorities for Leesylvania to ensure full compliance before hosting.
(Source: AirROI data, 2026, based on 4% licensed listings)
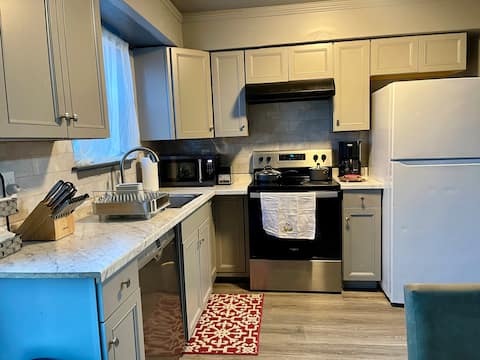
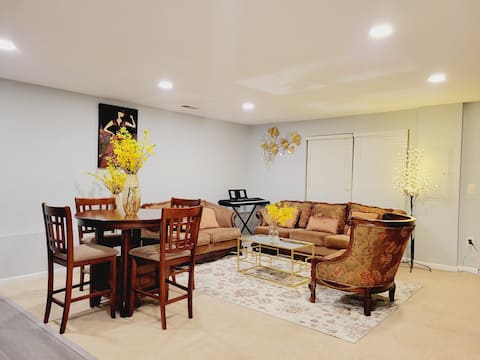
Top Performing Airbnb Properties in Leesylvania (2026)
Benchmark your potential! Explore examples of top-performing Airbnb properties in Leesylvaniabased on Trailing Twelve Month (TTM) revenue. Analyze their characteristics, revenue, occupancy rate, and ADR to understand what drives success in this market.

Grand-Lux | Pool & Gym | Free-Parking
Entire Place • 2 bedrooms

Retreat | Pool & Gym | Free-Parking
Entire Place • 2 bedrooms

Luxury Darlington Villa - Near Washington DC
Entire Place • 3 bedrooms
Cozy Home Away From Home
Entire Place • 2 bedrooms
Cheerful, bright and spacious with free parking
Entire Place • 1 bedroom

(SR) A Private Room in a Beautiful Home
Private Room • N/A
Note: Performance varies based on location, size, amenities, seasonality, and management quality. Data reflects the past 12 months.
Top Performing Airbnb Hosts in Leesylvania (2026)
Learn from the best! This table showcases top-performing Airbnb hosts in Leesylvania based on the number of properties managed and estimated total revenue over the past year. Analyze their scale and performance metrics.
| Host Name | Properties | Grossing Revenue | Stay Reviews | Avg Rating |
|---|---|---|---|---|
| Lucas | 2 | $115,369 | 96 | 4.91/5.0 |
| Jb | 1 | $41,903 | 76 | 4.87/5.0 |
| Yong | 1 | $30,827 | 3 | 5.00/5.0 |
| Multifamily | 12 | $30,092 | 31 | 4.44/5.0 |
| Tsegaye | 1 | $20,341 | 48 | 4.85/5.0 |
| Vincent | 2 | $16,481 | 719 | 4.93/5.0 |
| Esther | 6 | $13,620 | 385 | 4.63/5.0 |
| Aj | 2 | $12,931 | 96 | 4.92/5.0 |
| Asbel | 1 | $6,210 | 72 | 4.93/5.0 |
Analyzing the strategies of top hosts, such as their property selection, pricing, and guest communication, can offer valuable lessons for optimizing your own Airbnb operations in Leesylvania.
Dive Deeper: Advanced Leesylvania STR Market Data (2026)
Ready to unlock more insights? AirROI provides access to advanced metrics and comprehensive Airbnb data for Leesylvania. Explore detailed analytics beyond this report to refine your investment strategy, optimize pricing, and maximize your vacation rental profits.
Explore Advanced MetricsLeesylvania Short-Term Rental Market Composition (2026): Property & Room Types
Room Type Distribution
Property Type Distribution
Market Composition Insights for Leesylvania
- The Leesylvania Airbnb market composition is heavily skewed towards Private Room listings, which make up 78.6% of the 28 active rentals. This indicates strong guest preference for privacy and space.
- Looking at the property type distribution in Leesylvania, House properties are the most common (89.3%), reflecting the local real estate landscape.
- Houses represent a significant 89.3% portion, catering likely to families or larger groups.
- Smaller segments like others (combined 3.6%) offer potential for unique stay experiences.
Leesylvania Airbnb Room Capacity Analysis (2026): Bedroom Distribution
Distribution of Listings by Number of Bedrooms
Room Capacity Insights for Leesylvania
- The dominant room capacity in Leesylvania is 1 bedroom listings, making up 14.3% of the market. This suggests a strong demand for properties suitable for couples or solo travelers.
- Together, 1 bedroom and 2 bedrooms properties represent 25.0% of the active Airbnb listings in Leesylvania, indicating a high concentration in these sizes.
- Listings with 3+ bedrooms (3.6%) represent a smaller niche, potentially indicating an underserved market for larger group accommodations in Leesylvania.
Leesylvania Vacation Rental Guest Capacity Trends (2026)
Distribution of Listings by Guest Capacity
Guest Capacity Insights for Leesylvania
- The most common guest capacity trend in Leesylvania vacation rentals is listings accommodating 8+ guests (7.1%). This suggests the primary traveler segment is likely larger groups.
- Properties designed for 8+ guests and 2 guests dominate the Leesylvania STR market, accounting for 14.2% of listings.
- On average, properties in Leesylvania are equipped to host 1.2 guests.
Leesylvania Airbnb Booking Patterns (2026): Available vs. Booked Days
Available Days Distribution
Booked Days Distribution
Booking Pattern Insights for Leesylvania
- The most common availability pattern in Leesylvania falls within the 271-366 days range, representing 60.7% of listings. This suggests many properties have significant open periods on their calendars.
- Approximately 89.3% of listings show high availability (181+ days open annually), indicating potential for increased bookings or specific owner usage patterns.
- For booked days, the 31-90 days range is most frequent in Leesylvania (46.4%), reflecting common guest stay durations or potential owner blocking patterns.
- A notable 10.7% of properties secure long booking periods (181+ days booked per year), highlighting successful long-term rental strategies or significant owner usage.
Leesylvania Airbnb Minimum Stay Requirements Analysis
Distribution of Listings by Minimum Night Requirement
1 Night
4 listings
14.3% of total
2 Nights
6 listings
21.4% of total
3 Nights
1 listings
3.6% of total
4-6 Nights
1 listings
3.6% of total
30+ Nights
16 listings
57.1% of total
Key Insights
- The most prevalent minimum stay requirement in Leesylvania is 30+ Nights, adopted by 57.1% of listings. This highlights the market's preference for longer commitments.
- A significant segment (57.1%) caters to monthly stays (30+ nights) in Leesylvania, pointing to opportunities in the extended-stay market.
Recommendations
- Align with the market by considering a 30+ Nights minimum stay, as 57.1% of Leesylvania hosts use this setting.
- If feasible, allowing 1-night stays, especially midweek or during low season, could capture last-minute bookings, as only 14.3% currently do.
- Explore offering discounts for stays of 30+ nights to attract the 57.1% of the market seeking extended stays.
- Adjust minimum nights based on seasonality – potentially shorter during low season and longer during peak demand periods in Leesylvania.
Leesylvania Airbnb Cancellation Policy Trends Analysis (2026)
Flexible
2 listings
7.1% of total
Moderate
4 listings
14.3% of total
Firm
22 listings
78.6% of total
Cancellation Policy Insights for Leesylvania
- The prevailing Airbnb cancellation policy trend in Leesylvania is Firm, used by 78.6% of listings.
- A majority (78.6%) of hosts in Leesylvania utilize Firm or Strict policies, indicating a market where hosts prioritize booking security.
Recommendations for Hosts
- Consider adopting a Firm policy to align with the 78.6% market standard in Leesylvania.
- Regularly review your cancellation policy against competitors and market demand shifts in Leesylvania.
Leesylvania STR Booking Lead Time Analysis (2026)
Average Booking Lead Time by Month
Booking Lead Time Insights for Leesylvania
- The overall average booking lead time for vacation rentals in Leesylvania is 12 days.
- Guests book furthest in advance for stays during March (average 34 days), likely coinciding with peak travel demand or local events.
- The shortest booking windows occur for stays in August (average 5 days), indicating more last-minute travel plans during this time.
- Seasonally, Spring (19 days avg.) sees the longest lead times, while Summer (10 days avg.) has the shortest, reflecting typical travel planning cycles.
Recommendations for Hosts
- Use the overall average lead time (12 days) as a baseline for your pricing and availability strategy in Leesylvania.
- For March stays, consider implementing length-of-stay discounts or slightly higher rates for bookings made less than 34 days out to capitalize on advance planning.
- Target marketing efforts for the Spring season well in advance (at least 19 days) to capture early planners.
- Monitor your own booking lead times against these Leesylvania averages to identify opportunities for dynamic pricing adjustments.
Popular & Essential Airbnb Amenities in Leesylvania (2026)
Amenity Prevalence
Amenity Insights for Leesylvania
- Essential amenities in Leesylvania that guests expect include: Smoke alarm, Carbon monoxide alarm, Wifi, Air conditioning. Lacking these (any) could significantly impact bookings.
- Popular amenities like Dedicated workspace, First aid kit, Heating are common but not universal. Offering these can provide a competitive edge.
Recommendations for Hosts
- Ensure your listing includes all essential amenities for Leesylvania: Smoke alarm, Carbon monoxide alarm, Wifi, Air conditioning.
- Prioritize adding missing essentials: Air conditioning.
- Consider adding popular differentiators like Dedicated workspace or First aid kit to increase appeal.
- Highlight unique or less common amenities you offer (e.g., hot tub, dedicated workspace, EV charger) in your listing description and photos.
- Regularly check competitor amenities in Leesylvania to stay competitive.
Leesylvania Airbnb Guest Demographics & Profile Analysis (2026)
Guest Profile Summary for Leesylvania
- The typical guest profile for Airbnb in Leesylvania consists of primarily domestic travelers (92%), often arriving from nearby Richmond, typically belonging to the Post-2000s (Gen Z/Alpha) group (50%), primarily speaking English or Spanish.
- Domestic travelers account for 92.4% of guests.
- Key international markets include United States (92.4%) and Canada (2.5%).
- Top languages spoken are English (59.3%) followed by Spanish (14.8%).
- A significant demographic segment is the Post-2000s (Gen Z/Alpha) group, representing 50% of guests.
Recommendations for Hosts
- Target domestic marketing efforts towards travelers from Richmond and Alexandria.
- Tailor amenities and listing descriptions to appeal to the dominant Post-2000s (Gen Z/Alpha) demographic (e.g., highlight fast WiFi, smart home features, local guides).
- Highlight unique local experiences or amenities relevant to the primary guest profile.
- Consider seasonal promotions aligned with peak travel times for key origin markets.
Nearby Short-Term Rental Market Comparison
How does the Leesylvania Airbnb market stack up against its neighbors? Compare key performance metrics like average monthly revenue, ADR, and occupancy rates in surrounding areas to understand the broader regional STR landscape.
| Market | Active Properties | Monthly Revenue | Daily Rate | Avg. Occupancy |
|---|---|---|---|---|
| Centreville | 17 | $6,298 | $565.66 | 45% |
| McGaheysville | 83 | $6,156 | $431.72 | 45% |
| Mayo | 13 | $5,915 | $447.58 | 51% |
| Shannondale | 45 | $5,808 | $337.30 | 54% |
| Stevensville | 80 | $5,412 | $556.79 | 41% |
| Bentonville | 23 | $5,372 | $420.82 | 51% |
| Nellysford | 62 | $5,276 | $426.33 | 39% |
| Weems | 11 | $5,077 | $417.22 | 47% |
| Lower Windsor Township | 14 | $5,062 | $428.71 | 45% |
| Arundel on the Bay | 29 | $5,043 | $486.96 | 40% |