Hillsville Airbnb Market Analysis 2026: Short Term Rental Data & Vacation Rental Statistics in Virginia, United States
Is Airbnb profitable in Hillsville in 2026? Explore comprehensive Airbnb analytics for Hillsville, Virginia, United States to uncover income potential. This 2026 STR market report for Hillsville, based on AirROI data from February 2025 to January 2026, reveals key trends in the niche market of 44 active listings.
Whether you're considering an Airbnb investment in Hillsville, optimizing your existing vacation rental, or exploring rental arbitrage opportunities, understanding the Hillsville Airbnb data is crucial. Leveraging the low regulation environment is key to maximizing your short term rental income potential. Let's dive into the specifics.
Key Hillsville Airbnb Performance Metrics Overview
Monthly Airbnb Revenue Variations & Income Potential in Hillsville (2026)
Understanding the monthly revenue variations for Airbnb listings in Hillsville is key to maximizing your short term rental income potential. Seasonality significantly impacts earnings. Our analysis, based on data from the past 12 months, shows that the peak revenue month for STRs in Hillsville is typically October, while September often presents the lowest earnings, highlighting opportunities for strategic pricing adjustments during shoulder and low seasons. Explore the typical Airbnb income in Hillsville across different performance tiers:
- Best-in-class properties (Top 10%) achieve $4,458+ monthly, often utilizing dynamic pricing and superior guest experiences.
- Strong performing properties (Top 25%) earn $3,138 or more, indicating effective management and desirable locations/amenities.
- Typical properties (Median) generate around $2,192 per month, representing the average market performance.
- Entry-level properties (Bottom 25%) see earnings around $1,300, often with potential for optimization.
Average Monthly Airbnb Earnings Trend in Hillsville
Hillsville Airbnb Occupancy Rate Trends (2026)
Maximize your bookings by understanding the Hillsville STR occupancy trends. Seasonal demand shifts significantly influence how often properties are booked. Typically, Octobersees the highest demand (peak season occupancy), while January experiences the lowest (low season). Effective strategies, like adjusting minimum stays or offering promotions, can boost occupancy during slower periods. Here's how different property tiers perform in Hillsville:
- Best-in-class properties (Top 10%) achieve 81%+ occupancy, indicating high desirability and potentially optimized availability.
- Strong performing properties (Top 25%) maintain 67% or higher occupancy, suggesting good market fit and guest satisfaction.
- Typical properties (Median) have an occupancy rate around 45%.
- Entry-level properties (Bottom 25%) average 28% occupancy, potentially facing higher vacancy.
Average Monthly Occupancy Rate Trend in Hillsville
Average Daily Rate (ADR) Airbnb Trends in Hillsville (2026)
Effective short term rental pricing strategy in Hillsville involves understanding monthly ADR fluctuations. The Average Daily Rate (ADR) for Airbnb in Hillsville typically peaks in October and dips lowest during February. Leveraging Airbnb dynamic pricing tools or strategies based on this seasonality can significantly boost revenue. Here's a look at the typical nightly rates achieved:
- Best-in-class properties (Top 10%) command rates of $239+ per night, often due to premium features or locations.
- Strong performing properties (Top 25%) achieve nightly rates of $180 or more.
- Typical properties (Median) charge around $145 per night.
- Entry-level properties (Bottom 25%) earn around $119 per night.
Average Daily Rate (ADR) Trend by Month in Hillsville
Get Live Hillsville Market Intelligence 👇

Explore Real-time Analytics
Airbnb Seasonality Analysis & Trends in Hillsville (2026)
Peak Season (October, July, November)
- Revenue averages $3,172 per month
- Occupancy rates average 53.2%
- Daily rates average $183
Shoulder Season
- Revenue averages $2,787 per month
- Occupancy maintains around 46.8%
- Daily rates hold near $177
Low Season (February, April, September)
- Revenue drops to average $2,191 per month
- Occupancy decreases to average 42.0%
- Daily rates adjust to average $172
Seasonality Insights for Hillsville
- The Airbnb seasonality in Hillsville shows moderate seasonality with distinct peak and low periods. While the sections above show seasonal averages, it's also insightful to look at the extremes:
- During the high season, the absolute peak month showcases Hillsville's highest earning potential, with monthly revenues capable of climbing to $3,371, occupancy reaching a high of 58.0%, and ADRs peaking at $188.
- Conversely, the slowest single month of the year, typically falling within the low season, marks the market's lowest point. In this month, revenue might dip to $2,140, occupancy could drop to 37.4%, and ADRs may adjust down to $166.
- Understanding both the seasonal averages and these monthly peaks and troughs in revenue, occupancy, and ADR is crucial for maximizing your Airbnb profit potential in Hillsville.
Seasonal Strategies for Maximizing Profit
- Peak Season: Maximize revenue through premium pricing and potentially longer minimum stays. Ensure high availability.
- Low Season: Offer competitive pricing, special promotions (e.g., extended stay discounts), and flexible cancellation policies. Target off-season travelers like remote workers or budget-conscious guests.
- Shoulder Seasons: Implement dynamic pricing that balances peak and low rates. Target weekend travelers or specific events. Offer slightly more flexible terms than peak season.
- Regularly analyze your own performance against these Hillsville seasonality benchmarks and adjust your pricing and availability strategy accordingly.
Best Areas for Airbnb Investment in Hillsville (2026)
Exploring the top neighborhoods for short-term rentals in Hillsville? This section highlights key areas, outlining why they are attractive for hosts and guests, along with notable local attractions. Consider these locations based on your target guest profile and investment strategy.
| Neighborhood / Area | Why Host Here? (Target Guests & Appeal) | Key Attractions & Landmarks |
|---|---|---|
| Hillsville Downtown | The charming downtown area is known for its historic architecture and local shops. It's a great location for visitors wanting to experience the local culture and events. | Carroll County Courthouse, Hillsville Antique Mall, local dining, local festivals |
| Fairy Stone State Park | A beautiful natural area offering camping, hiking, and water activities. Perfect for nature lovers looking for outdoor adventures. | Fairy Stone Lake, hiking trails, fishing, picnic areas, swimming |
| New River Valley | A picturesque valley known for its scenic views and outdoor recreation, attracting tourists year-round for its beauty and serenity. | New River, hiking and biking trails, kayaking, fishing spots |
| Blue Ridge Parkway | An iconic scenic highway known for its stunning views and natural beauty, drawing travelers seeking picturesque landscapes and photography opportunities. | scenic overlooks, driving tours, nature trails, wildlife watching |
| Hillsville Flea Market | The largest flea market in the area attracts thousands of visitors looking for unique finds and local crafts, making it a great location for short-term rentals during market events. | hundreds of vendors, local crafts, food stalls, community events |
| Bristol, VA | Nearby city with a vibrant music scene and rich cultural history, offering additional attractions and amenities for visitors. | Birthplace of Country Music Museum, Bristol Motor Speedway, Downtown Bristol shops and restaurants |
| Galax, VA | Known as the "World Capital of Old Time Music," this quaint town attracts visitors for music events and its scenic trails. | Galax Fiddlers Convention, New River Trail, local music venues |
| Mount Rogers National Recreation Area | A popular destination for those interested in hiking, camping, and exploring the natural beauty of the region, with well-maintained trails and diverse wildlife. | hiking trails, Mount Rogers summit, wild ponies, camping spots |
Understanding Airbnb License Requirements & STR Laws in Hillsville (2026)
While Hillsville, Virginia, United States currently shows low STR regulations, specific Airbnb license requirements might still exist or change. Always verify the latest short term rental regulations and Airbnb license requirements directly with local government authorities for Hillsville to ensure full compliance before hosting.
(Source: AirROI data, 2026, finding no licensed listings among those analyzed)
Top Performing Airbnb Properties in Hillsville (2026)
Benchmark your potential! Explore examples of top-performing Airbnb properties in Hillsvillebased on Trailing Twelve Month (TTM) revenue. Analyze their characteristics, revenue, occupancy rate, and ADR to understand what drives success in this market.

Family Reunion Villa/Sleep 16/Hot Tub/20%off 3rd n
Entire Place • 5 bedrooms
20 Acres Dog-friendly/Fire Pit/Hot Tub/Game Room
Entire Place • 5 bedrooms

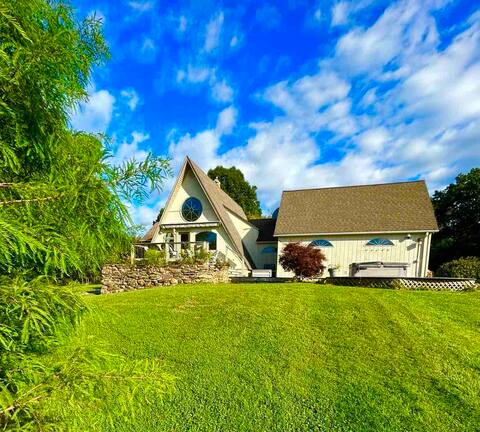
Timeless Hillsville Farmhouse: Blue Ridge Parkway!
Entire Place • 6 bedrooms

Cozy Cottage in the Clouds - Mountain View/BR Pkwy
Entire Place • 3 bedrooms
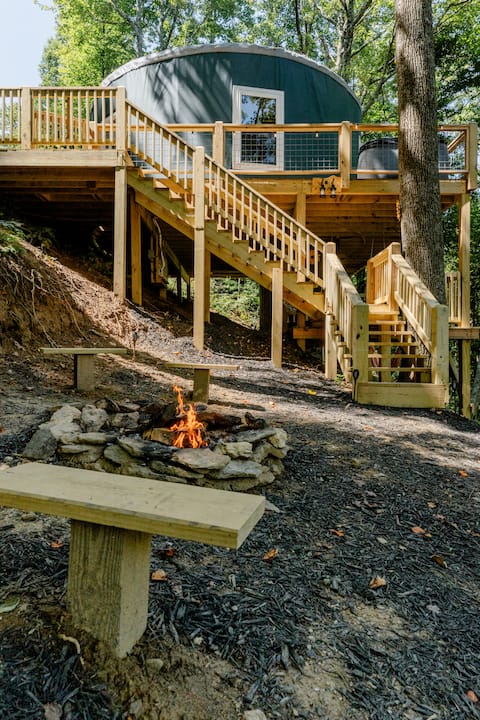
Windsong Tree top yurt w/ hot tub
Entire Place • 1 bedroom

Barrel Sauna, Fire Pit, Peaceful Creekside Setting
Entire Place • 1 bedroom
Note: Performance varies based on location, size, amenities, seasonality, and management quality. Data reflects the past 12 months.
Top Performing Airbnb Hosts in Hillsville (2026)
Learn from the best! This table showcases top-performing Airbnb hosts in Hillsville based on the number of properties managed and estimated total revenue over the past year. Analyze their scale and performance metrics.
| Host Name | Properties | Grossing Revenue | Stay Reviews | Avg Rating |
|---|---|---|---|---|
| Rebecca | 10 | $202,024 | 892 | 4.95/5.0 |
| Lauren | 1 | $174,136 | 18 | 5.00/5.0 |
| Jennifer | 1 | $110,788 | 156 | 4.97/5.0 |
| JoDee | 4 | $107,823 | 475 | 4.94/5.0 |
| Evolve | 2 | $76,010 | 26 | 4.72/5.0 |
| Alison | 2 | $67,228 | 136 | 4.99/5.0 |
| Raymond | 2 | $57,618 | 190 | 4.74/5.0 |
| Haley | 3 | $49,449 | 168 | 4.91/5.0 |
| Autumn | 1 | $45,516 | 78 | 4.97/5.0 |
| Amy And Derek | 1 | $35,796 | 358 | 4.99/5.0 |
Analyzing the strategies of top hosts, such as their property selection, pricing, and guest communication, can offer valuable lessons for optimizing your own Airbnb operations in Hillsville.
Dive Deeper: Advanced Hillsville STR Market Data (2026)
Ready to unlock more insights? AirROI provides access to advanced metrics and comprehensive Airbnb data for Hillsville. Explore detailed analytics beyond this report to refine your investment strategy, optimize pricing, and maximize your vacation rental profits.
Explore Advanced MetricsHillsville Short-Term Rental Market Composition (2026): Property & Room Types
Room Type Distribution
Property Type Distribution
Market Composition Insights for Hillsville
- The Hillsville Airbnb market composition is heavily skewed towards Entire Home/Apt listings, which make up 97.7% of the 44 active rentals. This indicates strong guest preference for privacy and space.
- Looking at the property type distribution in Hillsville, House properties are the most common (40.9%), reflecting the local real estate landscape.
- Houses represent a significant 40.9% portion, catering likely to families or larger groups.
Hillsville Airbnb Room Capacity Analysis (2026): Bedroom Distribution
Distribution of Listings by Number of Bedrooms
Room Capacity Insights for Hillsville
- The dominant room capacity in Hillsville is 1 bedroom listings, making up 38.6% of the market. This suggests a strong demand for properties suitable for couples or solo travelers.
- Together, 1 bedroom and 2 bedrooms properties represent 63.6% of the active Airbnb listings in Hillsville, indicating a high concentration in these sizes.
- A significant 34.0% of listings offer 3+ bedrooms, catering to larger groups and families seeking more space in Hillsville.
Hillsville Vacation Rental Guest Capacity Trends (2026)
Distribution of Listings by Guest Capacity
Guest Capacity Insights for Hillsville
- The most common guest capacity trend in Hillsville vacation rentals is listings accommodating 4 guests (38.6%). This suggests the primary traveler segment is likely small families or groups.
- Properties designed for 4 guests and 6 guests dominate the Hillsville STR market, accounting for 59.1% of listings.
- 36.4% of properties accommodate 6+ guests, serving the market segment for larger families or group travel in Hillsville.
- On average, properties in Hillsville are equipped to host 4.6 guests.
Hillsville Airbnb Booking Patterns (2026): Available vs. Booked Days
Available Days Distribution
Booked Days Distribution
Booking Pattern Insights for Hillsville
- The most common availability pattern in Hillsville falls within the 181-270 days range, representing 36.4% of listings. This suggests many properties have significant open periods on their calendars.
- Approximately 68.2% of listings show high availability (181+ days open annually), indicating potential for increased bookings or specific owner usage patterns.
- For booked days, the 91-180 days range is most frequent in Hillsville (36.4%), reflecting common guest stay durations or potential owner blocking patterns.
- A notable 34.0% of properties secure long booking periods (181+ days booked per year), highlighting successful long-term rental strategies or significant owner usage.
Hillsville Airbnb Minimum Stay Requirements Analysis
Distribution of Listings by Minimum Night Requirement
1 Night
29 listings
65.9% of total
2 Nights
8 listings
18.2% of total
3 Nights
2 listings
4.5% of total
30+ Nights
5 listings
11.4% of total
Key Insights
- The most prevalent minimum stay requirement in Hillsville is 1 Night, adopted by 65.9% of listings. This highlights the market's preference for shorter, flexible bookings.
- A strong majority (84.1%) of the Hillsville Airbnb data shows acceptance of very short stays (1-2 nights), indicating a dynamic, high-turnover market.
- A significant segment (11.4%) caters to monthly stays (30+ nights) in Hillsville, pointing to opportunities in the extended-stay market.
Recommendations
- Align with the market by considering a 1 Night minimum stay, as 65.9% of Hillsville hosts use this setting.
- Explore offering discounts for stays of 30+ nights to attract the 11.4% of the market seeking extended stays.
- Adjust minimum nights based on seasonality – potentially shorter during low season and longer during peak demand periods in Hillsville.
Hillsville Airbnb Cancellation Policy Trends Analysis (2026)
Limited
2 listings
4.7% of total
Flexible
5 listings
11.6% of total
Moderate
15 listings
34.9% of total
Firm
18 listings
41.9% of total
Strict
3 listings
7% of total
Cancellation Policy Insights for Hillsville
- The prevailing Airbnb cancellation policy trend in Hillsville is Firm, used by 41.9% of listings.
- There's a relatively balanced mix between guest-friendly (46.5%) and stricter (48.9%) policies, offering choices for different guest needs.
- Strict cancellation policies are quite rare (7%), potentially making listings with this policy less competitive unless justified by high demand or property type.
Recommendations for Hosts
- Consider adopting a Firm policy to align with the 41.9% market standard in Hillsville.
- Using a Strict policy might deter some guests, as only 7% of listings use it. Evaluate if potential revenue protection outweighs possible lower booking rates.
- Regularly review your cancellation policy against competitors and market demand shifts in Hillsville.
Hillsville STR Booking Lead Time Analysis (2026)
Average Booking Lead Time by Month
Booking Lead Time Insights for Hillsville
- The overall average booking lead time for vacation rentals in Hillsville is 41 days.
- Guests book furthest in advance for stays during August (average 54 days), likely coinciding with peak travel demand or local events.
- The shortest booking windows occur for stays in April (average 28 days), indicating more last-minute travel plans during this time.
- Seasonally, Summer (48 days avg.) sees the longest lead times, while Winter (32 days avg.) has the shortest, reflecting typical travel planning cycles.
Recommendations for Hosts
- Use the overall average lead time (41 days) as a baseline for your pricing and availability strategy in Hillsville.
- For August stays, consider implementing length-of-stay discounts or slightly higher rates for bookings made less than 54 days out to capitalize on advance planning.
- Target marketing efforts for the Summer season well in advance (at least 48 days) to capture early planners.
- Monitor your own booking lead times against these Hillsville averages to identify opportunities for dynamic pricing adjustments.
Popular & Essential Airbnb Amenities in Hillsville (2026)
Amenity Prevalence
Amenity Insights for Hillsville
- Essential amenities in Hillsville that guests expect include: Heating, Free parking on premises, Smoke alarm, Dishes and silverware, Refrigerator, Coffee maker, Hot water, Cooking basics, Bed linens, Air conditioning. Lacking these (any) could significantly impact bookings.
Recommendations for Hosts
- Ensure your listing includes all essential amenities for Hillsville: Heating, Free parking on premises, Smoke alarm, Dishes and silverware, Refrigerator, Coffee maker, Hot water, Cooking basics, Bed linens, Air conditioning.
- Prioritize adding missing essentials: Free parking on premises, Smoke alarm, Dishes and silverware, Refrigerator, Coffee maker, Hot water, Cooking basics, Bed linens, Air conditioning.
- Highlight unique or less common amenities you offer (e.g., hot tub, dedicated workspace, EV charger) in your listing description and photos.
- Regularly check competitor amenities in Hillsville to stay competitive.
Hillsville Airbnb Guest Demographics & Profile Analysis (2026)
Guest Profile Summary for Hillsville
- The typical guest profile for Airbnb in Hillsville consists of primarily domestic travelers (96%), often arriving from nearby Raleigh, typically belonging to the Post-2000s (Gen Z/Alpha) group (50%), primarily speaking English or Spanish.
- Domestic travelers account for 95.6% of guests.
- Key international markets include United States (95.6%) and DC (1.1%).
- Top languages spoken are English (74.6%) followed by Spanish (7.3%).
- A significant demographic segment is the Post-2000s (Gen Z/Alpha) group, representing 50% of guests.
Recommendations for Hosts
- Target domestic marketing efforts towards travelers from Raleigh and Richmond.
- Tailor amenities and listing descriptions to appeal to the dominant Post-2000s (Gen Z/Alpha) demographic (e.g., highlight fast WiFi, smart home features, local guides).
- Highlight unique local experiences or amenities relevant to the primary guest profile.
- Consider seasonal promotions aligned with peak travel times for key origin markets.
Nearby Short-Term Rental Market Comparison
How does the Hillsville Airbnb market stack up against its neighbors? Compare key performance metrics like average monthly revenue, ADR, and occupancy rates in surrounding areas to understand the broader regional STR landscape.
| Market | Active Properties | Monthly Revenue | Daily Rate | Avg. Occupancy |
|---|---|---|---|---|
| Denver | 109 | $6,309 | $590.96 | 45% |
| Catawba | 16 | $6,093 | $582.49 | 38% |
| Mooresville | 369 | $5,702 | $559.93 | 42% |
| Penhook | 18 | $5,675 | $678.75 | 37% |
| Sherrills Ford | 107 | $5,615 | $547.26 | 41% |
| Troutman | 49 | $5,587 | $467.90 | 42% |
| Lake Norman of Catawba | 51 | $4,972 | $513.30 | 43% |
| Rockbridge Baths | 12 | $4,144 | $298.35 | 45% |
| Blacksburg | 297 | $4,116 | $509.14 | 40% |
| Goodview | 31 | $3,953 | $401.90 | 44% |