Fredericksburg Airbnb Market Analysis 2026: Short Term Rental Data & Vacation Rental Statistics in Virginia, United States
Is Airbnb profitable in Fredericksburg in 2026? Explore comprehensive Airbnb analytics for Fredericksburg, Virginia, United States to uncover income potential. This 2026 STR market report for Fredericksburg, based on AirROI data from February 2025 to January 2026, reveals key trends in the niche market of 165 active listings.
Whether you're considering an Airbnb investment in Fredericksburg, optimizing your existing vacation rental, or exploring rental arbitrage opportunities, understanding the Fredericksburg Airbnb data is crucial. Leveraging the low regulation environment is key to maximizing your short term rental income potential. Let's dive into the specifics.
Key Fredericksburg Airbnb Performance Metrics Overview
Monthly Airbnb Revenue Variations & Income Potential in Fredericksburg (2026)
Understanding the monthly revenue variations for Airbnb listings in Fredericksburg is key to maximizing your short term rental income potential. Seasonality significantly impacts earnings. Our analysis, based on data from the past 12 months, shows that the peak revenue month for STRs in Fredericksburg is typically August, while January often presents the lowest earnings, highlighting opportunities for strategic pricing adjustments during shoulder and low seasons. Explore the typical Airbnb income in Fredericksburg across different performance tiers:
- Best-in-class properties (Top 10%) achieve $5,134+ monthly, often utilizing dynamic pricing and superior guest experiences.
- Strong performing properties (Top 25%) earn $3,494 or more, indicating effective management and desirable locations/amenities.
- Typical properties (Median) generate around $2,060 per month, representing the average market performance.
- Entry-level properties (Bottom 25%) see earnings around $950, often with potential for optimization.
Average Monthly Airbnb Earnings Trend in Fredericksburg
Fredericksburg Airbnb Occupancy Rate Trends (2026)
Maximize your bookings by understanding the Fredericksburg STR occupancy trends. Seasonal demand shifts significantly influence how often properties are booked. Typically, Marchsees the highest demand (peak season occupancy), while January experiences the lowest (low season). Effective strategies, like adjusting minimum stays or offering promotions, can boost occupancy during slower periods. Here's how different property tiers perform in Fredericksburg:
- Best-in-class properties (Top 10%) achieve 82%+ occupancy, indicating high desirability and potentially optimized availability.
- Strong performing properties (Top 25%) maintain 66% or higher occupancy, suggesting good market fit and guest satisfaction.
- Typical properties (Median) have an occupancy rate around 47%.
- Entry-level properties (Bottom 25%) average 23% occupancy, potentially facing higher vacancy.
Average Monthly Occupancy Rate Trend in Fredericksburg
Average Daily Rate (ADR) Airbnb Trends in Fredericksburg (2026)
Effective short term rental pricing strategy in Fredericksburg involves understanding monthly ADR fluctuations. The Average Daily Rate (ADR) for Airbnb in Fredericksburg typically peaks in October and dips lowest during February. Leveraging Airbnb dynamic pricing tools or strategies based on this seasonality can significantly boost revenue. Here's a look at the typical nightly rates achieved:
- Best-in-class properties (Top 10%) command rates of $272+ per night, often due to premium features or locations.
- Strong performing properties (Top 25%) achieve nightly rates of $192 or more.
- Typical properties (Median) charge around $124 per night.
- Entry-level properties (Bottom 25%) earn around $85 per night.
Average Daily Rate (ADR) Trend by Month in Fredericksburg
Get Live Fredericksburg Market Intelligence 👇

Explore Real-time Analytics
Airbnb Seasonality Analysis & Trends in Fredericksburg (2026)
Peak Season (August, October, December)
- Revenue averages $2,859 per month
- Occupancy rates average 48.7%
- Daily rates average $157
Shoulder Season
- Revenue averages $2,670 per month
- Occupancy maintains around 47.6%
- Daily rates hold near $149
Low Season (January, February, September)
- Revenue drops to average $1,998 per month
- Occupancy decreases to average 40.2%
- Daily rates adjust to average $153
Seasonality Insights for Fredericksburg
- The Airbnb seasonality in Fredericksburg shows moderate seasonality with distinct peak and low periods. While the sections above show seasonal averages, it's also insightful to look at the extremes:
- During the high season, the absolute peak month showcases Fredericksburg's highest earning potential, with monthly revenues capable of climbing to $2,941, occupancy reaching a high of 53.2%, and ADRs peaking at $162.
- Conversely, the slowest single month of the year, typically falling within the low season, marks the market's lowest point. In this month, revenue might dip to $1,516, occupancy could drop to 30.4%, and ADRs may adjust down to $140.
- Understanding both the seasonal averages and these monthly peaks and troughs in revenue, occupancy, and ADR is crucial for maximizing your Airbnb profit potential in Fredericksburg.
Seasonal Strategies for Maximizing Profit
- Peak Season: Maximize revenue through premium pricing and potentially longer minimum stays. Ensure high availability.
- Low Season: Offer competitive pricing, special promotions (e.g., extended stay discounts), and flexible cancellation policies. Target off-season travelers like remote workers or budget-conscious guests.
- Shoulder Seasons: Implement dynamic pricing that balances peak and low rates. Target weekend travelers or specific events. Offer slightly more flexible terms than peak season.
- Regularly analyze your own performance against these Fredericksburg seasonality benchmarks and adjust your pricing and availability strategy accordingly.
Best Areas for Airbnb Investment in Fredericksburg (2026)
Exploring the top neighborhoods for short-term rentals in Fredericksburg? This section highlights key areas, outlining why they are attractive for hosts and guests, along with notable local attractions. Consider these locations based on your target guest profile and investment strategy.
| Neighborhood / Area | Why Host Here? (Target Guests & Appeal) | Key Attractions & Landmarks |
|---|---|---|
| Historic District | Charming area known for its well-preserved 19th-century architecture and vibrant downtown. A prime spot for tourists interested in history, culture, and local shops. | Fredericksburg and Spotsylvania National Military Park, Mary Washington House, Kenmore Plantation, Fredericksburg area museums, Central Park, Historic downtown shops |
| Battlefield Area | This area offers visitors easy access to several Civil War battlefields, making it a top choice for history enthusiasts. Ideal for educational experiences and historical tours. | Chancellorsville Battlefield, Fredericksburg Battlefield, Marye's Heights, Eagle Tavern, National Museum of the Civil War Soldier, Civil War Trust |
| Downtown Fredericksburg | A lively area filled with restaurants, cafes, and shops, perfect for those wanting to experience local life. The vibrant culinary scene attracts food lovers. | Discover Fredericksburg Visitor Center, Riverwalk Trail, The Bulkhead, United States National Slavery Museum, Fredericksburg Farmers Market, Art galleries and boutiques |
| Riverfront Area | Scenic area along the Rappahannock River, offering beautiful views and recreational activities. Great for outdoor enthusiasts looking for a peaceful retreat close to nature. | Rappahannock River, City Dock, River Park, Paddleboarding and kayaking, Fishing opportunities, Outdoor picnic areas |
| University of Mary Washington Area | Home to the University of Mary Washington, this area attracts college students, parents, and visitors for events and campus activities. A vibrant and youthful atmosphere is present. | University campus, The Fredericksburg Theater Company, Café and eateries around campus, Annual university events, Cultural community events, Nearby parks |
| Plank Road | A commercial area drawing visitors due to shopping centers and restaurants. Ideal for guests looking for convenience and proximity to major highways. | Central Park shopping area, Old Mill Park, Nearby dining options, Easy access to I-95, Fredericksburg Festival of the Arts, Fredericksburg Technology Center |
| Stafford County | Just outside Fredericksburg, this area offers a quieter residential alternative that’s still close to Fredericksburg attractions, ideal for families and longer stays. | Lake Arrowhead, Widewater State Park, Government Island Park, Stafford Civil War History, Shopping malls, Golf courses |
| King George County | A rural area that provides a serene escape, this location is great for those looking for an outdoor and nature-focused experience near Fredericksburg. | Patawomeck Park, Caledon State Park, Rappahannock River views, Historical sites, Small local farms, Fishing and outdoor sports |
Understanding Airbnb License Requirements & STR Laws in Fredericksburg (2026)
While Fredericksburg, Virginia, United States currently shows low STR regulations, specific Airbnb license requirements might still exist or change. Always verify the latest short term rental regulations and Airbnb license requirements directly with local government authorities for Fredericksburg to ensure full compliance before hosting.
(Source: AirROI data, 2026, based on 1% licensed listings)
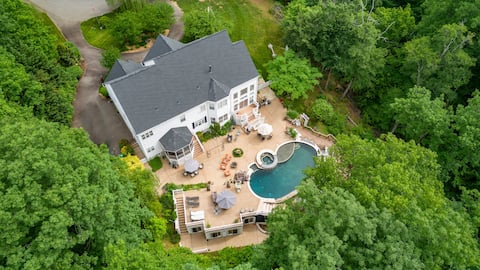
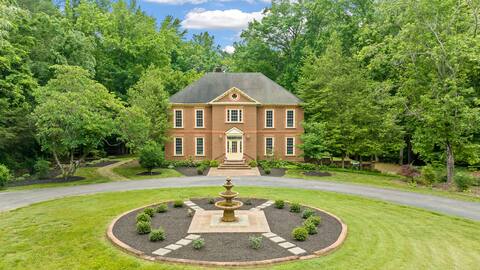
Top Performing Airbnb Properties in Fredericksburg (2026)
Benchmark your potential! Explore examples of top-performing Airbnb properties in Fredericksburgbased on Trailing Twelve Month (TTM) revenue. Analyze their characteristics, revenue, occupancy rate, and ADR to understand what drives success in this market.
Privacy, Infinity Pool, Riverfront Hiking & Fish
Entire Place • 5 bedrooms
Gem in a box
Entire Place • 5 bedrooms
Eden Try Winery Manor House
Entire Place • 5 bedrooms

Timberlake
Entire Place • 5 bedrooms

The Black Log Cabin - Hot Tub & Game Room
Entire Place • 3 bedrooms
Two Historic DwnTwn Apts (2Br/2Ba Kings+Kitchens)
Entire Place • 2 bedrooms
Note: Performance varies based on location, size, amenities, seasonality, and management quality. Data reflects the past 12 months.
Top Performing Airbnb Hosts in Fredericksburg (2026)
Learn from the best! This table showcases top-performing Airbnb hosts in Fredericksburg based on the number of properties managed and estimated total revenue over the past year. Analyze their scale and performance metrics.
| Host Name | Properties | Grossing Revenue | Stay Reviews | Avg Rating |
|---|---|---|---|---|
| Adam & Maria Johns | 5 | $172,357 | 651 | 4.94/5.0 |
| Manny | 4 | $156,726 | 162 | 4.87/5.0 |
| Sarah | 3 | $154,291 | 431 | 4.96/5.0 |
| Evolve | 3 | $136,915 | 43 | 4.72/5.0 |
| Dario | 13 | $131,546 | 205 | 4.81/5.0 |
| Rebecca Jean | 1 | $121,768 | 11 | 5.00/5.0 |
| Tatyana | 2 | $101,084 | 163 | 4.98/5.0 |
| Colby | 6 | $92,275 | 1218 | 4.79/5.0 |
| Gustavo | 1 | $89,852 | 41 | 5.00/5.0 |
| Eden Try Winery | 1 | $89,641 | 27 | 4.78/5.0 |
Analyzing the strategies of top hosts, such as their property selection, pricing, and guest communication, can offer valuable lessons for optimizing your own Airbnb operations in Fredericksburg.
Dive Deeper: Advanced Fredericksburg STR Market Data (2026)
Ready to unlock more insights? AirROI provides access to advanced metrics and comprehensive Airbnb data for Fredericksburg. Explore detailed analytics beyond this report to refine your investment strategy, optimize pricing, and maximize your vacation rental profits.
Explore Advanced MetricsFredericksburg Short-Term Rental Market Composition (2026): Property & Room Types
Room Type Distribution
Property Type Distribution
Market Composition Insights for Fredericksburg
- The Fredericksburg Airbnb market composition is heavily skewed towards Entire Home/Apt listings, which make up 76.4% of the 165 active rentals. This indicates strong guest preference for privacy and space.
- Looking at the property type distribution in Fredericksburg, House properties are the most common (55.8%), reflecting the local real estate landscape.
- Houses represent a significant 55.8% portion, catering likely to families or larger groups.
- The presence of 8.5% Hotel/Boutique listings indicates integration with traditional hospitality.
- Smaller segments like others (combined 4.2%) offer potential for unique stay experiences.
Fredericksburg Airbnb Room Capacity Analysis (2026): Bedroom Distribution
Distribution of Listings by Number of Bedrooms
Room Capacity Insights for Fredericksburg
- The dominant room capacity in Fredericksburg is 1 bedroom listings, making up 30.9% of the market. This suggests a strong demand for properties suitable for couples or solo travelers.
- Together, 1 bedroom and 2 bedrooms properties represent 54.5% of the active Airbnb listings in Fredericksburg, indicating a high concentration in these sizes.
- A significant 27.2% of listings offer 3+ bedrooms, catering to larger groups and families seeking more space in Fredericksburg.
Fredericksburg Vacation Rental Guest Capacity Trends (2026)
Distribution of Listings by Guest Capacity
Guest Capacity Insights for Fredericksburg
- The most common guest capacity trend in Fredericksburg vacation rentals is listings accommodating 4 guests (20.6%). This suggests the primary traveler segment is likely small families or groups.
- Properties designed for 4 guests and 2 guests dominate the Fredericksburg STR market, accounting for 36.4% of listings.
- 32.6% of properties accommodate 6+ guests, serving the market segment for larger families or group travel in Fredericksburg.
- On average, properties in Fredericksburg are equipped to host 4.0 guests.
Fredericksburg Airbnb Booking Patterns (2026): Available vs. Booked Days
Available Days Distribution
Booked Days Distribution
Booking Pattern Insights for Fredericksburg
- The most common availability pattern in Fredericksburg falls within the 271-366 days range, representing 39.4% of listings. This suggests many properties have significant open periods on their calendars.
- Approximately 75.2% of listings show high availability (181+ days open annually), indicating potential for increased bookings or specific owner usage patterns.
- For booked days, the 91-180 days range is most frequent in Fredericksburg (35.8%), reflecting common guest stay durations or potential owner blocking patterns.
- A notable 26.0% of properties secure long booking periods (181+ days booked per year), highlighting successful long-term rental strategies or significant owner usage.
Fredericksburg Airbnb Minimum Stay Requirements Analysis
Distribution of Listings by Minimum Night Requirement
1 Night
54 listings
32.7% of total
2 Nights
40 listings
24.2% of total
3 Nights
5 listings
3% of total
4-6 Nights
10 listings
6.1% of total
7-29 Nights
19 listings
11.5% of total
30+ Nights
37 listings
22.4% of total
Key Insights
- The most prevalent minimum stay requirement in Fredericksburg is 1 Night, adopted by 32.7% of listings. This highlights the market's preference for shorter, flexible bookings.
- A significant segment (22.4%) caters to monthly stays (30+ nights) in Fredericksburg, pointing to opportunities in the extended-stay market.
Recommendations
- Align with the market by considering a 1 Night minimum stay, as 32.7% of Fredericksburg hosts use this setting.
- Explore offering discounts for stays of 30+ nights to attract the 22.4% of the market seeking extended stays.
- Adjust minimum nights based on seasonality – potentially shorter during low season and longer during peak demand periods in Fredericksburg.
Fredericksburg Airbnb Cancellation Policy Trends Analysis (2026)
Super Strict 30 Days
1 listings
0.6% of total
Limited
2 listings
1.2% of total
Flexible
63 listings
38.2% of total
Moderate
43 listings
26.1% of total
Firm
34 listings
20.6% of total
Strict
22 listings
13.3% of total
Cancellation Policy Insights for Fredericksburg
- The prevailing Airbnb cancellation policy trend in Fredericksburg is Flexible, used by 38.2% of listings.
- There's a relatively balanced mix between guest-friendly (64.3%) and stricter (33.9%) policies, offering choices for different guest needs.
Recommendations for Hosts
- Consider adopting a Flexible policy to align with the 38.2% market standard in Fredericksburg.
- Using a Strict policy might deter some guests, as only 13.3% of listings use it. Evaluate if potential revenue protection outweighs possible lower booking rates.
- Regularly review your cancellation policy against competitors and market demand shifts in Fredericksburg.
Fredericksburg STR Booking Lead Time Analysis (2026)
Average Booking Lead Time by Month
Booking Lead Time Insights for Fredericksburg
- The overall average booking lead time for vacation rentals in Fredericksburg is 32 days.
- Guests book furthest in advance for stays during May (average 49 days), likely coinciding with peak travel demand or local events.
- The shortest booking windows occur for stays in January (average 16 days), indicating more last-minute travel plans during this time.
- Seasonally, Spring (40 days avg.) sees the longest lead times, while Winter (25 days avg.) has the shortest, reflecting typical travel planning cycles.
Recommendations for Hosts
- Use the overall average lead time (32 days) as a baseline for your pricing and availability strategy in Fredericksburg.
- For May stays, consider implementing length-of-stay discounts or slightly higher rates for bookings made less than 49 days out to capitalize on advance planning.
- Target marketing efforts for the Spring season well in advance (at least 40 days) to capture early planners.
- Monitor your own booking lead times against these Fredericksburg averages to identify opportunities for dynamic pricing adjustments.
Popular & Essential Airbnb Amenities in Fredericksburg (2026)
Amenity Prevalence
Amenity Insights for Fredericksburg
- Essential amenities in Fredericksburg that guests expect include: Wifi, Air conditioning, Smoke alarm, TV. Lacking these (any) could significantly impact bookings.
- Popular amenities like Heating, Hot water, Free parking on premises are common but not universal. Offering these can provide a competitive edge.
Recommendations for Hosts
- Ensure your listing includes all essential amenities for Fredericksburg: Wifi, Air conditioning, Smoke alarm, TV.
- Prioritize adding missing essentials: Wifi, Air conditioning, Smoke alarm, TV.
- Consider adding popular differentiators like Heating or Hot water to increase appeal.
- Highlight unique or less common amenities you offer (e.g., hot tub, dedicated workspace, EV charger) in your listing description and photos.
- Regularly check competitor amenities in Fredericksburg to stay competitive.
Fredericksburg Airbnb Guest Demographics & Profile Analysis (2026)
Guest Profile Summary for Fredericksburg
- The typical guest profile for Airbnb in Fredericksburg consists of primarily domestic travelers (93%), often arriving from nearby Washington, typically belonging to the Post-2000s (Gen Z/Alpha) group (50%), primarily speaking English or Spanish.
- Domestic travelers account for 93.1% of guests.
- Key international markets include United States (93.1%) and DC (3.3%).
- Top languages spoken are English (70.8%) followed by Spanish (15%).
- A significant demographic segment is the Post-2000s (Gen Z/Alpha) group, representing 50% of guests.
Recommendations for Hosts
- Target domestic marketing efforts towards travelers from Washington and Fredericksburg.
- Tailor amenities and listing descriptions to appeal to the dominant Post-2000s (Gen Z/Alpha) demographic (e.g., highlight fast WiFi, smart home features, local guides).
- Highlight unique local experiences or amenities relevant to the primary guest profile.
- Consider seasonal promotions aligned with peak travel times for key origin markets.
Nearby Short-Term Rental Market Comparison
How does the Fredericksburg Airbnb market stack up against its neighbors? Compare key performance metrics like average monthly revenue, ADR, and occupancy rates in surrounding areas to understand the broader regional STR landscape.
| Market | Active Properties | Monthly Revenue | Daily Rate | Avg. Occupancy |
|---|---|---|---|---|
| Centreville | 17 | $6,298 | $565.66 | 45% |
| McGaheysville | 83 | $6,156 | $431.72 | 45% |
| Mayo | 13 | $5,915 | $447.58 | 51% |
| Shannondale | 45 | $5,808 | $337.30 | 54% |
| Stevensville | 80 | $5,412 | $556.79 | 41% |
| Bentonville | 23 | $5,372 | $420.82 | 51% |
| Nellysford | 62 | $5,276 | $426.33 | 39% |
| Weems | 11 | $5,077 | $417.22 | 47% |
| Lower Windsor Township | 14 | $5,062 | $428.71 | 45% |
| Arundel on the Bay | 29 | $5,043 | $486.96 | 40% |