Floyd Airbnb Market Analysis 2026: Short Term Rental Data & Vacation Rental Statistics in Virginia, United States
Is Airbnb profitable in Floyd in 2026? Explore comprehensive Airbnb analytics for Floyd, Virginia, United States to uncover income potential. This 2026 STR market report for Floyd, based on AirROI data from February 2025 to January 2026, reveals key trends in the niche market of 78 active listings.
Whether you're considering an Airbnb investment in Floyd, optimizing your existing vacation rental, or exploring rental arbitrage opportunities, understanding the Floyd Airbnb data is crucial. Leveraging the low regulation environment is key to maximizing your short term rental income potential. Let's dive into the specifics.
Key Floyd Airbnb Performance Metrics Overview
Monthly Airbnb Revenue Variations & Income Potential in Floyd (2026)
Understanding the monthly revenue variations for Airbnb listings in Floyd is key to maximizing your short term rental income potential. Seasonality significantly impacts earnings. Our analysis, based on data from the past 12 months, shows that the peak revenue month for STRs in Floyd is typically October, while January often presents the lowest earnings, highlighting opportunities for strategic pricing adjustments during shoulder and low seasons. Explore the typical Airbnb income in Floyd across different performance tiers:
- Best-in-class properties (Top 10%) achieve $4,300+ monthly, often utilizing dynamic pricing and superior guest experiences.
- Strong performing properties (Top 25%) earn $2,783 or more, indicating effective management and desirable locations/amenities.
- Typical properties (Median) generate around $1,720 per month, representing the average market performance.
- Entry-level properties (Bottom 25%) see earnings around $920, often with potential for optimization.
Average Monthly Airbnb Earnings Trend in Floyd
Floyd Airbnb Occupancy Rate Trends (2026)
Maximize your bookings by understanding the Floyd STR occupancy trends. Seasonal demand shifts significantly influence how often properties are booked. Typically, Octobersees the highest demand (peak season occupancy), while January experiences the lowest (low season). Effective strategies, like adjusting minimum stays or offering promotions, can boost occupancy during slower periods. Here's how different property tiers perform in Floyd:
- Best-in-class properties (Top 10%) achieve 74%+ occupancy, indicating high desirability and potentially optimized availability.
- Strong performing properties (Top 25%) maintain 55% or higher occupancy, suggesting good market fit and guest satisfaction.
- Typical properties (Median) have an occupancy rate around 36%.
- Entry-level properties (Bottom 25%) average 22% occupancy, potentially facing higher vacancy.
Average Monthly Occupancy Rate Trend in Floyd
Average Daily Rate (ADR) Airbnb Trends in Floyd (2026)
Effective short term rental pricing strategy in Floyd involves understanding monthly ADR fluctuations. The Average Daily Rate (ADR) for Airbnb in Floyd typically peaks in October and dips lowest during March. Leveraging Airbnb dynamic pricing tools or strategies based on this seasonality can significantly boost revenue. Here's a look at the typical nightly rates achieved:
- Best-in-class properties (Top 10%) command rates of $284+ per night, often due to premium features or locations.
- Strong performing properties (Top 25%) achieve nightly rates of $188 or more.
- Typical properties (Median) charge around $141 per night.
- Entry-level properties (Bottom 25%) earn around $105 per night.
Average Daily Rate (ADR) Trend by Month in Floyd
Get Live Floyd Market Intelligence 👇

Explore Real-time Analytics
Airbnb Seasonality Analysis & Trends in Floyd (2026)
Peak Season (October, August, May)
- Revenue averages $2,666 per month
- Occupancy rates average 47.8%
- Daily rates average $176
Shoulder Season
- Revenue averages $2,169 per month
- Occupancy maintains around 40.0%
- Daily rates hold near $174
Low Season (January, February, April)
- Revenue drops to average $1,449 per month
- Occupancy decreases to average 31.2%
- Daily rates adjust to average $162
Seasonality Insights for Floyd
- The Airbnb seasonality in Floyd shows highly seasonal trends requiring careful strategy. While the sections above show seasonal averages, it's also insightful to look at the extremes:
- During the high season, the absolute peak month showcases Floyd's highest earning potential, with monthly revenues capable of climbing to $2,982, occupancy reaching a high of 49.6%, and ADRs peaking at $182.
- Conversely, the slowest single month of the year, typically falling within the low season, marks the market's lowest point. In this month, revenue might dip to $1,264, occupancy could drop to 23.0%, and ADRs may adjust down to $159.
- Understanding both the seasonal averages and these monthly peaks and troughs in revenue, occupancy, and ADR is crucial for maximizing your Airbnb profit potential in Floyd.
Seasonal Strategies for Maximizing Profit
- Peak Season: Maximize revenue through premium pricing and potentially longer minimum stays. Ensure high availability.
- Low Season: Offer competitive pricing, special promotions (e.g., extended stay discounts), and flexible cancellation policies. Target off-season travelers like remote workers or budget-conscious guests.
- Shoulder Seasons: Implement dynamic pricing that balances peak and low rates. Target weekend travelers or specific events. Offer slightly more flexible terms than peak season.
- Regularly analyze your own performance against these Floyd seasonality benchmarks and adjust your pricing and availability strategy accordingly.
Best Areas for Airbnb Investment in Floyd (2026)
Exploring the top neighborhoods for short-term rentals in Floyd? This section highlights key areas, outlining why they are attractive for hosts and guests, along with notable local attractions. Consider these locations based on your target guest profile and investment strategy.
| Neighborhood / Area | Why Host Here? (Target Guests & Appeal) | Key Attractions & Landmarks |
|---|---|---|
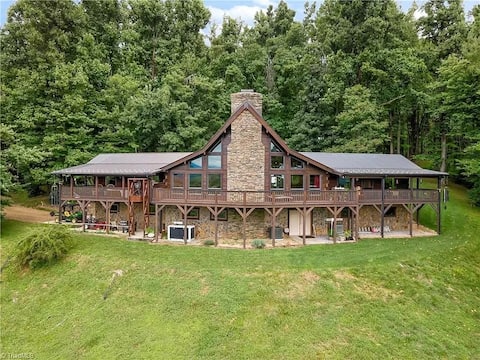
| Downtown Floyd | The central hub of Floyd, offering a charming small-town atmosphere with local shops, cafes, and art galleries. Ideal for visitors wanting to explore local culture and events. | Floyd Country Store, Old Church Gallery, Floyd Farmers Market, Dogwood Restaurant, Blue Ridge Parkway |
| The Blue Ridge Parkway | Known for its stunning natural beauty, this scenic route attracts nature lovers and outdoor enthusiasts. Perfect for guests seeking hiking, photography, and stunning landscapes. | Hiking Trails, Scenic Overlooks, Snowden Bridge, Mabry Mill, Natural Bridge State Park |
| Floyd Fest Grounds | Home to the popular Floyd Fest, this area is vibrant during festival season and attracts music lovers and travelers seeking a unique festival experience. | Floyd Fest, Live Music Venues, Local Craft Vendors, Camping Experiences, Food Trucks |
| The Crooked Road | This heritage music trail is a great draw for music lovers interested in traditional Appalachian music and culture, providing a unique experience for visitors. | Music Venues, Cultural Events, Heritage Music Sites, Local Jam Sessions, Traditional Dance Halls |
| Warm Springs | A relaxing area known for its natural hot springs and spa resorts, attracting visitors looking for wellness and relaxation experiences. | Warm Springs Pools, Spa Treatments, Hiking Trails, Local History Museums, Natural Wildlife |
| Red Oak Mountain | A lesser-known location that offers breathtaking views and peace, attracting those looking for solitude and nature retreats. | Hiking Trails, Bird Watching, Picnic Areas, Campsites, Scenic Views |
| Bland County | A tranquil area with stunning mountain landscapes, perfect for those who seek a quiet escape amidst nature and local wildlife. | Jefferson National Forest, Camping Spots, Fishing Areas, Hiking Trails, Nature Walks |
| Floyd County Vineyards | Home to several boutique wineries, this area attracts wine enthusiasts and those looking to enjoy local vineyards and tasting experiences. | Local Wineries, Wine Tastings, Vineyard Tours, Scenic Views, Food Pairing Events |
Understanding Airbnb License Requirements & STR Laws in Floyd (2026)
While Floyd, Virginia, United States currently shows low STR regulations, specific Airbnb license requirements might still exist or change. Always verify the latest short term rental regulations and Airbnb license requirements directly with local government authorities for Floyd to ensure full compliance before hosting.
(Source: AirROI data, 2026, finding no licensed listings among those analyzed)
Top Performing Airbnb Properties in Floyd (2026)
Benchmark your potential! Explore examples of top-performing Airbnb properties in Floydbased on Trailing Twelve Month (TTM) revenue. Analyze their characteristics, revenue, occupancy rate, and ADR to understand what drives success in this market.
Mountain View Lodge
Entire Place • 5 bedrooms
Sunflower: A Unique Nature Sanctuary!
Entire Place • 3 bedrooms
RidgeTop Lodge
Entire Place • 4 bedrooms

Winter Escape - Cozy Cabin + Hot Tub near Parkway
Entire Place • 2 bedrooms

The CV House| Spacious Family Retreat| Sleeps 8
Entire Place • 4 bedrooms

Floyd Family Home, 1 Mile from Downtown Great Yard
Entire Place • 4 bedrooms
Note: Performance varies based on location, size, amenities, seasonality, and management quality. Data reflects the past 12 months.
Top Performing Airbnb Hosts in Floyd (2026)
Learn from the best! This table showcases top-performing Airbnb hosts in Floyd based on the number of properties managed and estimated total revenue over the past year. Analyze their scale and performance metrics.
| Host Name | Properties | Grossing Revenue | Stay Reviews | Avg Rating |
|---|---|---|---|---|
| Allegheny | 5 | $131,684 | 593 | 4.94/5.0 |
| Ashera | 5 | $118,931 | 498 | 4.94/5.0 |
| Floyd EcoVillage | 10 | $114,105 | 743 | 4.81/5.0 |
| Nancy | 1 | $80,551 | 13 | 5.00/5.0 |
| Shalene | 3 | $67,492 | 485 | 4.95/5.0 |
| Eric | 1 | $64,914 | 136 | 4.99/5.0 |
| Curated Getaways Team | 1 | $61,029 | 272 | 4.92/5.0 |
| Mark | 1 | $52,902 | 53 | 4.98/5.0 |
| Paula | 1 | $47,951 | 77 | 4.99/5.0 |
| Rebecca | 2 | $44,971 | 208 | 4.99/5.0 |
Analyzing the strategies of top hosts, such as their property selection, pricing, and guest communication, can offer valuable lessons for optimizing your own Airbnb operations in Floyd.
Dive Deeper: Advanced Floyd STR Market Data (2026)
Ready to unlock more insights? AirROI provides access to advanced metrics and comprehensive Airbnb data for Floyd. Explore detailed analytics beyond this report to refine your investment strategy, optimize pricing, and maximize your vacation rental profits.
Explore Advanced MetricsFloyd Short-Term Rental Market Composition (2026): Property & Room Types
Room Type Distribution
Property Type Distribution
Market Composition Insights for Floyd
- The Floyd Airbnb market composition is heavily skewed towards Entire Home/Apt listings, which make up 89.7% of the 78 active rentals. This indicates strong guest preference for privacy and space.
- Looking at the property type distribution in Floyd, House properties are the most common (38.5%), reflecting the local real estate landscape.
- Houses represent a significant 38.5% portion, catering likely to families or larger groups.
- Smaller segments like hotel/boutique, others (combined 5.1%) offer potential for unique stay experiences.
Floyd Airbnb Room Capacity Analysis (2026): Bedroom Distribution
Distribution of Listings by Number of Bedrooms
Room Capacity Insights for Floyd
- The dominant room capacity in Floyd is 1 bedroom listings, making up 41% of the market. This suggests a strong demand for properties suitable for couples or solo travelers.
- Together, 1 bedroom and 2 bedrooms properties represent 70.5% of the active Airbnb listings in Floyd, indicating a high concentration in these sizes.
- A significant 21.7% of listings offer 3+ bedrooms, catering to larger groups and families seeking more space in Floyd.
Floyd Vacation Rental Guest Capacity Trends (2026)
Distribution of Listings by Guest Capacity
Guest Capacity Insights for Floyd
- The most common guest capacity trend in Floyd vacation rentals is listings accommodating 4 guests (32.1%). This suggests the primary traveler segment is likely small families or groups.
- Properties designed for 4 guests and 2 guests dominate the Floyd STR market, accounting for 56.5% of listings.
- 29.5% of properties accommodate 6+ guests, serving the market segment for larger families or group travel in Floyd.
- On average, properties in Floyd are equipped to host 4.4 guests.
Floyd Airbnb Booking Patterns (2026): Available vs. Booked Days
Available Days Distribution
Booked Days Distribution
Booking Pattern Insights for Floyd
- The most common availability pattern in Floyd falls within the 181-270 days range, representing 43.6% of listings. This suggests many properties have significant open periods on their calendars.
- Approximately 78.2% of listings show high availability (181+ days open annually), indicating potential for increased bookings or specific owner usage patterns.
- For booked days, the 91-180 days range is most frequent in Floyd (41%), reflecting common guest stay durations or potential owner blocking patterns.
- A notable 24.3% of properties secure long booking periods (181+ days booked per year), highlighting successful long-term rental strategies or significant owner usage.
Floyd Airbnb Minimum Stay Requirements Analysis
Distribution of Listings by Minimum Night Requirement
1 Night
44 listings
56.4% of total
2 Nights
23 listings
29.5% of total
4-6 Nights
1 listings
1.3% of total
30+ Nights
10 listings
12.8% of total
Key Insights
- The most prevalent minimum stay requirement in Floyd is 1 Night, adopted by 56.4% of listings. This highlights the market's preference for shorter, flexible bookings.
- A strong majority (85.9%) of the Floyd Airbnb data shows acceptance of very short stays (1-2 nights), indicating a dynamic, high-turnover market.
- A significant segment (12.8%) caters to monthly stays (30+ nights) in Floyd, pointing to opportunities in the extended-stay market.
Recommendations
- Align with the market by considering a 1 Night minimum stay, as 56.4% of Floyd hosts use this setting.
- Explore offering discounts for stays of 30+ nights to attract the 12.8% of the market seeking extended stays.
- Adjust minimum nights based on seasonality – potentially shorter during low season and longer during peak demand periods in Floyd.
Floyd Airbnb Cancellation Policy Trends Analysis (2026)
Limited
3 listings
3.8% of total
Flexible
32 listings
41% of total
Moderate
29 listings
37.2% of total
Firm
14 listings
17.9% of total
Cancellation Policy Insights for Floyd
- The prevailing Airbnb cancellation policy trend in Floyd is Flexible, used by 41% of listings.
- The market strongly favors guest-friendly terms, with 78.2% of listings offering Flexible or Moderate policies. This suggests guests in Floyd may expect booking flexibility.
Recommendations for Hosts
- Consider adopting a Flexible policy to align with the 41% market standard in Floyd.
- Regularly review your cancellation policy against competitors and market demand shifts in Floyd.
Floyd STR Booking Lead Time Analysis (2026)
Average Booking Lead Time by Month
Booking Lead Time Insights for Floyd
- The overall average booking lead time for vacation rentals in Floyd is 55 days.
- Guests book furthest in advance for stays during July (average 89 days), likely coinciding with peak travel demand or local events.
- The shortest booking windows occur for stays in February (average 19 days), indicating more last-minute travel plans during this time.
- Seasonally, Fall (64 days avg.) sees the longest lead times, while Winter (27 days avg.) has the shortest, reflecting typical travel planning cycles.
Recommendations for Hosts
- Use the overall average lead time (55 days) as a baseline for your pricing and availability strategy in Floyd.
- For July stays, consider implementing length-of-stay discounts or slightly higher rates for bookings made less than 89 days out to capitalize on advance planning.
- Target marketing efforts for the Fall season well in advance (at least 64 days) to capture early planners.
- Monitor your own booking lead times against these Floyd averages to identify opportunities for dynamic pricing adjustments.
Popular & Essential Airbnb Amenities in Floyd (2026)
Amenity Prevalence
Amenity Insights for Floyd
- Essential amenities in Floyd that guests expect include: Heating, Coffee maker. Lacking these (any) could significantly impact bookings.
- Popular amenities like Smoke alarm, Air conditioning, Wifi are common but not universal. Offering these can provide a competitive edge.
- Warning: Wifi is not universally provided but is considered essential globally. Ensure reliable Wifi is offered.
Recommendations for Hosts
- Ensure your listing includes all essential amenities for Floyd: Heating, Coffee maker.
- Prioritize adding missing essentials: Heating, Coffee maker.
- Consider adding popular differentiators like Smoke alarm or Air conditioning to increase appeal.
- Highlight unique or less common amenities you offer (e.g., hot tub, dedicated workspace, EV charger) in your listing description and photos.
- Regularly check competitor amenities in Floyd to stay competitive.
Floyd Airbnb Guest Demographics & Profile Analysis (2026)
Guest Profile Summary for Floyd
- The typical guest profile for Airbnb in Floyd consists of primarily domestic travelers (96%), often arriving from nearby Richmond, typically belonging to the Post-2000s (Gen Z/Alpha) group (50%), primarily speaking English or Spanish.
- Domestic travelers account for 95.8% of guests.
- Key international markets include United States (95.8%) and DC (1.3%).
- Top languages spoken are English (74.1%) followed by Spanish (11.1%).
- A significant demographic segment is the Post-2000s (Gen Z/Alpha) group, representing 50% of guests.
Recommendations for Hosts
- Target domestic marketing efforts towards travelers from Richmond and Roanoke.
- Tailor amenities and listing descriptions to appeal to the dominant Post-2000s (Gen Z/Alpha) demographic (e.g., highlight fast WiFi, smart home features, local guides).
- Highlight unique local experiences or amenities relevant to the primary guest profile.
- Consider seasonal promotions aligned with peak travel times for key origin markets.
Nearby Short-Term Rental Market Comparison
How does the Floyd Airbnb market stack up against its neighbors? Compare key performance metrics like average monthly revenue, ADR, and occupancy rates in surrounding areas to understand the broader regional STR landscape.
| Market | Active Properties | Monthly Revenue | Daily Rate | Avg. Occupancy |
|---|---|---|---|---|
| Denver | 109 | $6,309 | $590.96 | 45% |
| Catawba | 16 | $6,093 | $582.49 | 38% |
| Mooresville | 369 | $5,702 | $559.93 | 42% |
| Penhook | 18 | $5,675 | $678.75 | 37% |
| Sherrills Ford | 107 | $5,615 | $547.26 | 41% |
| Troutman | 49 | $5,587 | $467.90 | 42% |
| Lake Norman of Catawba | 51 | $4,972 | $513.30 | 43% |
| Rockbridge Baths | 12 | $4,144 | $298.35 | 45% |
| Blacksburg | 297 | $4,116 | $509.14 | 40% |
| Goodview | 31 | $3,953 | $401.90 | 44% |