Fancy Gap Airbnb Market Analysis 2026: Short Term Rental Data & Vacation Rental Statistics in Virginia, United States
Is Airbnb profitable in Fancy Gap in 2026? Explore comprehensive Airbnb analytics for Fancy Gap, Virginia, United States to uncover income potential. This 2026 STR market report for Fancy Gap, based on AirROI data from February 2025 to January 2026, reveals key trends in the niche market of 64 active listings.
Whether you're considering an Airbnb investment in Fancy Gap, optimizing your existing vacation rental, or exploring rental arbitrage opportunities, understanding the Fancy Gap Airbnb data is crucial. Leveraging the low regulation environment is key to maximizing your short term rental income potential. Let's dive into the specifics.
Key Fancy Gap Airbnb Performance Metrics Overview
Monthly Airbnb Revenue Variations & Income Potential in Fancy Gap (2026)
Understanding the monthly revenue variations for Airbnb listings in Fancy Gap is key to maximizing your short term rental income potential. Seasonality significantly impacts earnings. Our analysis, based on data from the past 12 months, shows that the peak revenue month for STRs in Fancy Gap is typically October, while January often presents the lowest earnings, highlighting opportunities for strategic pricing adjustments during shoulder and low seasons. Explore the typical Airbnb income in Fancy Gap across different performance tiers:
- Best-in-class properties (Top 10%) achieve $3,824+ monthly, often utilizing dynamic pricing and superior guest experiences.
- Strong performing properties (Top 25%) earn $2,930 or more, indicating effective management and desirable locations/amenities.
- Typical properties (Median) generate around $1,923 per month, representing the average market performance.
- Entry-level properties (Bottom 25%) see earnings around $976, often with potential for optimization.
Average Monthly Airbnb Earnings Trend in Fancy Gap
Fancy Gap Airbnb Occupancy Rate Trends (2026)
Maximize your bookings by understanding the Fancy Gap STR occupancy trends. Seasonal demand shifts significantly influence how often properties are booked. Typically, Octobersees the highest demand (peak season occupancy), while January experiences the lowest (low season). Effective strategies, like adjusting minimum stays or offering promotions, can boost occupancy during slower periods. Here's how different property tiers perform in Fancy Gap:
- Best-in-class properties (Top 10%) achieve 79%+ occupancy, indicating high desirability and potentially optimized availability.
- Strong performing properties (Top 25%) maintain 62% or higher occupancy, suggesting good market fit and guest satisfaction.
- Typical properties (Median) have an occupancy rate around 43%.
- Entry-level properties (Bottom 25%) average 21% occupancy, potentially facing higher vacancy.
Average Monthly Occupancy Rate Trend in Fancy Gap
Average Daily Rate (ADR) Airbnb Trends in Fancy Gap (2026)
Effective short term rental pricing strategy in Fancy Gap involves understanding monthly ADR fluctuations. The Average Daily Rate (ADR) for Airbnb in Fancy Gap typically peaks in October and dips lowest during March. Leveraging Airbnb dynamic pricing tools or strategies based on this seasonality can significantly boost revenue. Here's a look at the typical nightly rates achieved:
- Best-in-class properties (Top 10%) command rates of $219+ per night, often due to premium features or locations.
- Strong performing properties (Top 25%) achieve nightly rates of $179 or more.
- Typical properties (Median) charge around $145 per night.
- Entry-level properties (Bottom 25%) earn around $123 per night.
Average Daily Rate (ADR) Trend by Month in Fancy Gap
Get Live Fancy Gap Market Intelligence 👇

Explore Real-time Analytics
Airbnb Seasonality Analysis & Trends in Fancy Gap (2026)
Peak Season (October, July, August)
- Revenue averages $2,594 per month
- Occupancy rates average 50.7%
- Daily rates average $162
Shoulder Season
- Revenue averages $2,129 per month
- Occupancy maintains around 44.1%
- Daily rates hold near $158
Low Season (January, February, March)
- Revenue drops to average $1,600 per month
- Occupancy decreases to average 36.0%
- Daily rates adjust to average $148
Seasonality Insights for Fancy Gap
- The Airbnb seasonality in Fancy Gap shows moderate seasonality with distinct peak and low periods. While the sections above show seasonal averages, it's also insightful to look at the extremes:
- During the high season, the absolute peak month showcases Fancy Gap's highest earning potential, with monthly revenues capable of climbing to $2,996, occupancy reaching a high of 54.8%, and ADRs peaking at $172.
- Conversely, the slowest single month of the year, typically falling within the low season, marks the market's lowest point. In this month, revenue might dip to $1,518, occupancy could drop to 31.6%, and ADRs may adjust down to $144.
- Understanding both the seasonal averages and these monthly peaks and troughs in revenue, occupancy, and ADR is crucial for maximizing your Airbnb profit potential in Fancy Gap.
Seasonal Strategies for Maximizing Profit
- Peak Season: Maximize revenue through premium pricing and potentially longer minimum stays. Ensure high availability.
- Low Season: Offer competitive pricing, special promotions (e.g., extended stay discounts), and flexible cancellation policies. Target off-season travelers like remote workers or budget-conscious guests.
- Shoulder Seasons: Implement dynamic pricing that balances peak and low rates. Target weekend travelers or specific events. Offer slightly more flexible terms than peak season.
- Regularly analyze your own performance against these Fancy Gap seasonality benchmarks and adjust your pricing and availability strategy accordingly.
Best Areas for Airbnb Investment in Fancy Gap (2026)
Exploring the top neighborhoods for short-term rentals in Fancy Gap? This section highlights key areas, outlining why they are attractive for hosts and guests, along with notable local attractions. Consider these locations based on your target guest profile and investment strategy.
| Neighborhood / Area | Why Host Here? (Target Guests & Appeal) | Key Attractions & Landmarks |
|---|---|---|
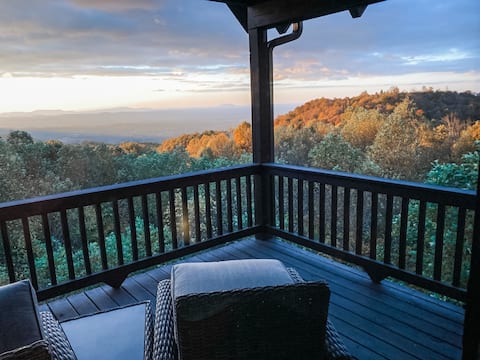
| Fancy Gap | A mountainous community offering beautiful views and a peaceful retreat. Ideal for nature lovers and those seeking a quiet escape from urban life, with proximity to hiking trails and outdoor activities. | Blue Ridge Parkway, Fancy Gap Overlook, Hang Gliding at the Lovingston, Grayson Highlands State Park, Hiking Trails, Local Vineyards |
| Galax | Known for its rich musical heritage and thriving arts scene, Galax is a popular spot for visitors interested in bluegrass music and the arts. Great for cultural tourism and events throughout the year. | Galax Old Fiddlers' Convention, Southwest Virginia Cultural Center & Gateway, Old Town Galax, The Galax Zoo, Local Music Venues |
| Mount Airy (NC) | Famous as the inspiration for the TV show 'The Andy Griffith Show', it draws tourists interested in Americana and nostalgia. Offers family-friendly attractions and a charming downtown area. | Andy Griffith Museum, Mayberry R.F.D. Tour, Mount Airy Museum of Regional History, Snappy Lunch, Pilot Mountain State Park |
| Willis | A quaint, small town near Fancy Gap, perfect for those looking for a rural experience. Offers access to beautiful countryside views and outdoor activities, such as hiking and fishing. | New River Trail State Park, Willis Gap, Local Farms, Biking Trails |
| Stuart | Offers a mix of history and outdoor adventures. Stuart is a gateway to various recreational activities and is known for its small-town charm. | Patrick County Historical Society, Fairy Stone State Park, Local Craft Fairs, Hiking and Fishing Spots |
| Ferrum | Home to Ferrum College and has a peaceful, rural atmosphere. Attracts cultural enthusiasts and those interested in education and local events. | Ferrum College, Blue Ridge Music Center, Local Farms and Markets, Hiking Trails, Fine Arts Events |
| Ridgeway | A small community that offers a slice of rural life with scenic views and outdoor activities. Great for guests looking to experience local Virginia culture. | Local Parks, Nature Trails, Historic Sites, Community Events |
| Meadows of Dan | A picturesque community known for its stunning views and proximity to the Blue Ridge Parkway. Popular among hikers and outdoor enthusiasts seeking a serene getaway. | Blue Ridge Parkway, Jasper's Restaurant, Local Artisans and Crafts, Festival Attractions |
Understanding Airbnb License Requirements & STR Laws in Fancy Gap (2026)
While Fancy Gap, Virginia, United States currently shows low STR regulations, specific Airbnb license requirements might still exist or change. Always verify the latest short term rental regulations and Airbnb license requirements directly with local government authorities for Fancy Gap to ensure full compliance before hosting.
(Source: AirROI data, 2026, finding no licensed listings among those analyzed)
Top Performing Airbnb Properties in Fancy Gap (2026)
Benchmark your potential! Explore examples of top-performing Airbnb properties in Fancy Gapbased on Trailing Twelve Month (TTM) revenue. Analyze their characteristics, revenue, occupancy rate, and ADR to understand what drives success in this market.

Blue Ridge Parkway Panoramic Paradise-60 Mile View
Entire Place • 4 bedrooms

Million Dollar View Mtn-side - Chateau Cristeau
Entire Place • 3 bedrooms

Winter Getaway! Chantilly Trace
Entire Place • 2 bedrooms
"Tulip Tree Cabin" - A Dream Mountain Getaway
Entire Place • 2 bedrooms
Enchanted Forest Modern Cabin w/ Upgraded Internet
Entire Place • 2 bedrooms
"Chantilly Ridge" - Quiet Mtn Getaway & Hot Tub
Entire Place • 2 bedrooms
Note: Performance varies based on location, size, amenities, seasonality, and management quality. Data reflects the past 12 months.
Top Performing Airbnb Hosts in Fancy Gap (2026)
Learn from the best! This table showcases top-performing Airbnb hosts in Fancy Gap based on the number of properties managed and estimated total revenue over the past year. Analyze their scale and performance metrics.
| Host Name | Properties | Grossing Revenue | Stay Reviews | Avg Rating |
|---|---|---|---|---|
| Rebecca | 12 | $400,460 | 1872 | 4.93/5.0 |
| Lonesome Pine Cabins | 10 | $149,578 | 557 | 4.80/5.0 |
| Laura | 2 | $72,684 | 258 | 4.90/5.0 |
| Ashley | 1 | $71,462 | 53 | 4.92/5.0 |
| Cathy | 1 | $61,364 | 171 | 4.94/5.0 |
| Ashley | 1 | $48,340 | 101 | 4.99/5.0 |
| Evolve | 3 | $44,354 | 85 | 4.77/5.0 |
| Linda | 2 | $41,749 | 256 | 4.89/5.0 |
| Kimberly Gray | 1 | $39,776 | 112 | 5.00/5.0 |
| John | 5 | $38,638 | 220 | 4.77/5.0 |
Analyzing the strategies of top hosts, such as their property selection, pricing, and guest communication, can offer valuable lessons for optimizing your own Airbnb operations in Fancy Gap.
Dive Deeper: Advanced Fancy Gap STR Market Data (2026)
Ready to unlock more insights? AirROI provides access to advanced metrics and comprehensive Airbnb data for Fancy Gap. Explore detailed analytics beyond this report to refine your investment strategy, optimize pricing, and maximize your vacation rental profits.
Explore Advanced MetricsFancy Gap Short-Term Rental Market Composition (2026): Property & Room Types
Room Type Distribution
Property Type Distribution
Market Composition Insights for Fancy Gap
- The Fancy Gap Airbnb market composition is heavily skewed towards Entire Home/Apt listings, which make up 100% of the 64 active rentals. This indicates strong guest preference for privacy and space.
- Looking at the property type distribution in Fancy Gap, Outdoor/Unique properties are the most common (64.1%), reflecting the local real estate landscape.
- Houses represent a significant 32.8% portion, catering likely to families or larger groups.
- Smaller segments like apartment/condo (combined 3.1%) offer potential for unique stay experiences.
Fancy Gap Airbnb Room Capacity Analysis (2026): Bedroom Distribution
Distribution of Listings by Number of Bedrooms
Room Capacity Insights for Fancy Gap
- The dominant room capacity in Fancy Gap is 2 bedrooms listings, making up 40.6% of the market. This suggests a strong demand for properties suitable for couples or solo travelers.
- Together, 2 bedrooms and 1 bedroom properties represent 76.5% of the active Airbnb listings in Fancy Gap, indicating a high concentration in these sizes.
- A significant 23.5% of listings offer 3+ bedrooms, catering to larger groups and families seeking more space in Fancy Gap.
Fancy Gap Vacation Rental Guest Capacity Trends (2026)
Distribution of Listings by Guest Capacity
Guest Capacity Insights for Fancy Gap
- The most common guest capacity trend in Fancy Gap vacation rentals is listings accommodating 4 guests (42.2%). This suggests the primary traveler segment is likely small families or groups.
- Properties designed for 4 guests and 6 guests dominate the Fancy Gap STR market, accounting for 64.1% of listings.
- 34.4% of properties accommodate 6+ guests, serving the market segment for larger families or group travel in Fancy Gap.
- On average, properties in Fancy Gap are equipped to host 4.6 guests.
Fancy Gap Airbnb Booking Patterns (2026): Available vs. Booked Days
Available Days Distribution
Booked Days Distribution
Booking Pattern Insights for Fancy Gap
- The most common availability pattern in Fancy Gap falls within the 271-366 days range, representing 35.9% of listings. This suggests many properties have significant open periods on their calendars.
- Approximately 70.3% of listings show high availability (181+ days open annually), indicating potential for increased bookings or specific owner usage patterns.
- For booked days, the 91-180 days range is most frequent in Fancy Gap (35.9%), reflecting common guest stay durations or potential owner blocking patterns.
- A notable 31.3% of properties secure long booking periods (181+ days booked per year), highlighting successful long-term rental strategies or significant owner usage.
Fancy Gap Airbnb Minimum Stay Requirements Analysis
Distribution of Listings by Minimum Night Requirement
1 Night
38 listings
59.4% of total
2 Nights
18 listings
28.1% of total
30+ Nights
8 listings
12.5% of total
Key Insights
- The most prevalent minimum stay requirement in Fancy Gap is 1 Night, adopted by 59.4% of listings. This highlights the market's preference for shorter, flexible bookings.
- A strong majority (87.5%) of the Fancy Gap Airbnb data shows acceptance of very short stays (1-2 nights), indicating a dynamic, high-turnover market.
- A significant segment (12.5%) caters to monthly stays (30+ nights) in Fancy Gap, pointing to opportunities in the extended-stay market.
Recommendations
- Align with the market by considering a 1 Night minimum stay, as 59.4% of Fancy Gap hosts use this setting.
- Explore offering discounts for stays of 30+ nights to attract the 12.5% of the market seeking extended stays.
- Adjust minimum nights based on seasonality – potentially shorter during low season and longer during peak demand periods in Fancy Gap.
Fancy Gap Airbnb Cancellation Policy Trends Analysis (2026)
Flexible
13 listings
20.3% of total
Moderate
19 listings
29.7% of total
Firm
27 listings
42.2% of total
Strict
5 listings
7.8% of total
Cancellation Policy Insights for Fancy Gap
- The prevailing Airbnb cancellation policy trend in Fancy Gap is Firm, used by 42.2% of listings.
- There's a relatively balanced mix between guest-friendly (50.0%) and stricter (50.0%) policies, offering choices for different guest needs.
- Strict cancellation policies are quite rare (7.8%), potentially making listings with this policy less competitive unless justified by high demand or property type.
Recommendations for Hosts
- Consider adopting a Firm policy to align with the 42.2% market standard in Fancy Gap.
- Using a Strict policy might deter some guests, as only 7.8% of listings use it. Evaluate if potential revenue protection outweighs possible lower booking rates.
- Regularly review your cancellation policy against competitors and market demand shifts in Fancy Gap.
Fancy Gap STR Booking Lead Time Analysis (2026)
Average Booking Lead Time by Month
Booking Lead Time Insights for Fancy Gap
- The overall average booking lead time for vacation rentals in Fancy Gap is 48 days.
- Guests book furthest in advance for stays during October (average 72 days), likely coinciding with peak travel demand or local events.
- The shortest booking windows occur for stays in March (average 30 days), indicating more last-minute travel plans during this time.
- Seasonally, Summer (58 days avg.) sees the longest lead times, while Winter (44 days avg.) has the shortest, reflecting typical travel planning cycles.
Recommendations for Hosts
- Use the overall average lead time (48 days) as a baseline for your pricing and availability strategy in Fancy Gap.
- For October stays, consider implementing length-of-stay discounts or slightly higher rates for bookings made less than 72 days out to capitalize on advance planning.
- Target marketing efforts for the Summer season well in advance (at least 58 days) to capture early planners.
- Monitor your own booking lead times against these Fancy Gap averages to identify opportunities for dynamic pricing adjustments.
Popular & Essential Airbnb Amenities in Fancy Gap (2026)
Amenity Prevalence
Amenity Insights for Fancy Gap
- Essential amenities in Fancy Gap that guests expect include: Heating, Smoke alarm, TV, Air conditioning, Hot water, Coffee maker. Lacking these (any) could significantly impact bookings.
- Popular amenities like Dishes and silverware, Free parking on premises, Microwave are common but not universal. Offering these can provide a competitive edge.
- Warning: Wifi is not universally provided but is considered essential globally. Ensure reliable Wifi is offered.
Recommendations for Hosts
- Ensure your listing includes all essential amenities for Fancy Gap: Heating, Smoke alarm, TV, Air conditioning, Hot water, Coffee maker.
- Prioritize adding missing essentials: Smoke alarm, TV, Air conditioning, Hot water, Coffee maker.
- Consider adding popular differentiators like Dishes and silverware or Free parking on premises to increase appeal.
- Highlight unique or less common amenities you offer (e.g., hot tub, dedicated workspace, EV charger) in your listing description and photos.
- Regularly check competitor amenities in Fancy Gap to stay competitive.
Fancy Gap Airbnb Guest Demographics & Profile Analysis (2026)
Guest Profile Summary for Fancy Gap
- The typical guest profile for Airbnb in Fancy Gap consists of primarily domestic travelers (97%), often arriving from nearby Charlotte, typically belonging to the Post-2000s (Gen Z/Alpha) group (50%), primarily speaking English or Spanish.
- Domestic travelers account for 97.4% of guests.
- Key international markets include United States (97.4%) and Canada (0.8%).
- Top languages spoken are English (80.8%) followed by Spanish (6.7%).
- A significant demographic segment is the Post-2000s (Gen Z/Alpha) group, representing 50% of guests.
Recommendations for Hosts
- Target domestic marketing efforts towards travelers from Charlotte and Raleigh.
- Tailor amenities and listing descriptions to appeal to the dominant Post-2000s (Gen Z/Alpha) demographic (e.g., highlight fast WiFi, smart home features, local guides).
- Highlight unique local experiences or amenities relevant to the primary guest profile.
- Consider seasonal promotions aligned with peak travel times for key origin markets.
Nearby Short-Term Rental Market Comparison
How does the Fancy Gap Airbnb market stack up against its neighbors? Compare key performance metrics like average monthly revenue, ADR, and occupancy rates in surrounding areas to understand the broader regional STR landscape.
| Market | Active Properties | Monthly Revenue | Daily Rate | Avg. Occupancy |
|---|---|---|---|---|
| Denver | 109 | $6,309 | $590.96 | 45% |
| Catawba | 16 | $6,093 | $582.49 | 38% |
| Mooresville | 369 | $5,702 | $559.93 | 42% |
| Penhook | 18 | $5,675 | $678.75 | 37% |
| Sherrills Ford | 107 | $5,615 | $547.26 | 41% |
| Troutman | 49 | $5,587 | $467.90 | 42% |
| Lake Norman of Catawba | 51 | $4,972 | $513.30 | 43% |
| Rockbridge Baths | 12 | $4,144 | $298.35 | 45% |
| Blacksburg | 297 | $4,116 | $509.14 | 40% |
| Goodview | 31 | $3,953 | $401.90 | 44% |