Faber Airbnb Market Analysis 2026: Short Term Rental Data & Vacation Rental Statistics in Virginia, United States
Is Airbnb profitable in Faber in 2026? Explore comprehensive Airbnb analytics for Faber, Virginia, United States to uncover income potential. This 2026 STR market report for Faber, based on AirROI data from February 2025 to January 2026, reveals key trends in the niche market of 25 active listings.
Whether you're considering an Airbnb investment in Faber, optimizing your existing vacation rental, or exploring rental arbitrage opportunities, understanding the Faber Airbnb data is crucial. Leveraging the low regulation environment is key to maximizing your short term rental income potential. Let's dive into the specifics.
Key Faber Airbnb Performance Metrics Overview
Monthly Airbnb Revenue Variations & Income Potential in Faber (2026)
Understanding the monthly revenue variations for Airbnb listings in Faber is key to maximizing your short term rental income potential. Seasonality significantly impacts earnings. Our analysis, based on data from the past 12 months, shows that the peak revenue month for STRs in Faber is typically October, while February often presents the lowest earnings, highlighting opportunities for strategic pricing adjustments during shoulder and low seasons. Explore the typical Airbnb income in Faber across different performance tiers:
- Best-in-class properties (Top 10%) achieve $8,658+ monthly, often utilizing dynamic pricing and superior guest experiences.
- Strong performing properties (Top 25%) earn $6,245 or more, indicating effective management and desirable locations/amenities.
- Typical properties (Median) generate around $3,825 per month, representing the average market performance.
- Entry-level properties (Bottom 25%) see earnings around $2,204, often with potential for optimization.
Average Monthly Airbnb Earnings Trend in Faber
Faber Airbnb Occupancy Rate Trends (2026)
Maximize your bookings by understanding the Faber STR occupancy trends. Seasonal demand shifts significantly influence how often properties are booked. Typically, Octobersees the highest demand (peak season occupancy), while February experiences the lowest (low season). Effective strategies, like adjusting minimum stays or offering promotions, can boost occupancy during slower periods. Here's how different property tiers perform in Faber:
- Best-in-class properties (Top 10%) achieve 70%+ occupancy, indicating high desirability and potentially optimized availability.
- Strong performing properties (Top 25%) maintain 59% or higher occupancy, suggesting good market fit and guest satisfaction.
- Typical properties (Median) have an occupancy rate around 43%.
- Entry-level properties (Bottom 25%) average 28% occupancy, potentially facing higher vacancy.
Average Monthly Occupancy Rate Trend in Faber
Average Daily Rate (ADR) Airbnb Trends in Faber (2026)
Effective short term rental pricing strategy in Faber involves understanding monthly ADR fluctuations. The Average Daily Rate (ADR) for Airbnb in Faber typically peaks in December and dips lowest during March. Leveraging Airbnb dynamic pricing tools or strategies based on this seasonality can significantly boost revenue. Here's a look at the typical nightly rates achieved:
- Best-in-class properties (Top 10%) command rates of $669+ per night, often due to premium features or locations.
- Strong performing properties (Top 25%) achieve nightly rates of $390 or more.
- Typical properties (Median) charge around $287 per night.
- Entry-level properties (Bottom 25%) earn around $183 per night.
Average Daily Rate (ADR) Trend by Month in Faber
Get Live Faber Market Intelligence 👇

Explore Real-time Analytics
Airbnb Seasonality Analysis & Trends in Faber (2026)
Peak Season (October, August, July)
- Revenue averages $6,106 per month
- Occupancy rates average 51.8%
- Daily rates average $353
Shoulder Season
- Revenue averages $4,845 per month
- Occupancy maintains around 46.7%
- Daily rates hold near $356
Low Season (January, February, March)
- Revenue drops to average $3,002 per month
- Occupancy decreases to average 33.3%
- Daily rates adjust to average $332
Seasonality Insights for Faber
- The Airbnb seasonality in Faber shows highly seasonal trends requiring careful strategy. While the sections above show seasonal averages, it's also insightful to look at the extremes:
- During the high season, the absolute peak month showcases Faber's highest earning potential, with monthly revenues capable of climbing to $6,516, occupancy reaching a high of 54.7%, and ADRs peaking at $415.
- Conversely, the slowest single month of the year, typically falling within the low season, marks the market's lowest point. In this month, revenue might dip to $2,429, occupancy could drop to 32.8%, and ADRs may adjust down to $304.
- Understanding both the seasonal averages and these monthly peaks and troughs in revenue, occupancy, and ADR is crucial for maximizing your Airbnb profit potential in Faber.
Seasonal Strategies for Maximizing Profit
- Peak Season: Maximize revenue through premium pricing and potentially longer minimum stays. Ensure high availability.
- Low Season: Offer competitive pricing, special promotions (e.g., extended stay discounts), and flexible cancellation policies. Target off-season travelers like remote workers or budget-conscious guests.
- Shoulder Seasons: Implement dynamic pricing that balances peak and low rates. Target weekend travelers or specific events. Offer slightly more flexible terms than peak season.
- Regularly analyze your own performance against these Faber seasonality benchmarks and adjust your pricing and availability strategy accordingly.
Best Areas for Airbnb Investment in Faber (2026)
Exploring the top neighborhoods for short-term rentals in Faber? This section highlights key areas, outlining why they are attractive for hosts and guests, along with notable local attractions. Consider these locations based on your target guest profile and investment strategy.
| Neighborhood / Area | Why Host Here? (Target Guests & Appeal) | Key Attractions & Landmarks |
|---|---|---|
| Lake Monticello | A large, picturesque community with a beautiful lake, ideal for vacationers seeking relaxation and nature. It offers a range of outdoor activities and is close to wineries and outdoor attractions. | Lake Monticello, Fishing and boating, Hiking trails, Picnic areas, Local wineries |
| Charlottesville | A vibrant city with rich history, culture, and a lively downtown area. Known for its proximity to the University of Virginia, it's a great location for attracting families, students, and tourists. | University of Virginia, Downtown Mall, Monticello, Virginia Discovery Museum, Historic Garden Week |
| Shenandoah National Park | A stunning national park with breathtaking views and a variety of hiking trails. Perfect for nature lovers looking to escape the hustle and bustle of everyday life. | Skyline Drive, Hiking trails, Waterfalls, Scenic overlooks, Wildlife viewing |
| Richmond | Virginia's capital, rich in history and culture, with a variety of museums, parks, and a growing culinary scene. Attracts both tourists and business travelers. | Virginia State Capitol, Virginia Museum of Fine Arts, Canal Walk, Hollywood Cemetery, Byrd Park |
| Farmville | A charming small town with historical significance and a growing arts scene. Attracts visitors for events and nearby outdoor activities. | Longwood University, High Bridge Trail, Farmville Downtown Historic District, Wineries, Local artisan shops |
| Appomattox | Historic site and location of the Appomattox Court House, where the Civil War ended. Attracts history enthusiasts and tourists. | Appomattox Court House National Historical Park, McLean House, Confederate Cemetery, Visitor Center, Local shops |
| Williamsburg | A historic city known for its colonial history and attractions. A popular destination for families and history buffs. | Colonial Williamsburg, Busch Gardens, Jamestown Settlement, Yorktown Battlefield, Shopping at Merchants Square |
| Natural Bridge | Home of the famous Natural Bridge, this area attracts visitors looking for unique natural wonders and outdoor activities. | Natural Bridge, Natural Bridge Caverns, Monacan Indian Living History Museum, Hiking trails, Horseback riding |
Understanding Airbnb License Requirements & STR Laws in Faber (2026)
While Faber, Virginia, United States currently shows low STR regulations, specific Airbnb license requirements might still exist or change. Always verify the latest short term rental regulations and Airbnb license requirements directly with local government authorities for Faber to ensure full compliance before hosting.
(Source: AirROI data, 2026, finding no licensed listings among those analyzed)
Top Performing Airbnb Properties in Faber (2026)
Benchmark your potential! Explore examples of top-performing Airbnb properties in Faberbased on Trailing Twelve Month (TTM) revenue. Analyze their characteristics, revenue, occupancy rate, and ADR to understand what drives success in this market.
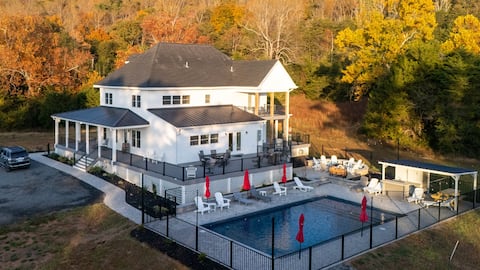
New! Farmhouse w/ Wrap-Around Porch, Pool
Entire Place • 7 bedrooms
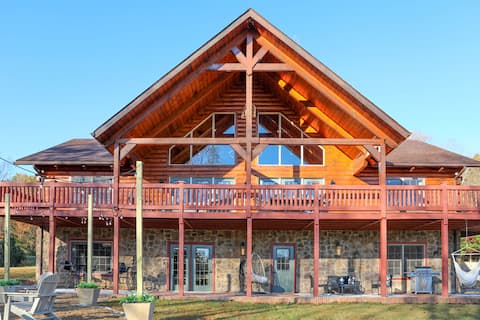
Lakefront Cabin w Stunning Curated Decor & Hot Tub
Entire Place • 5 bedrooms

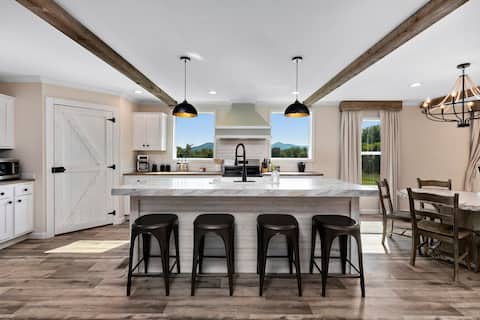
New! Farmhouse Epic Views Fire-Pit 12ppl
Entire Place • 6 bedrooms
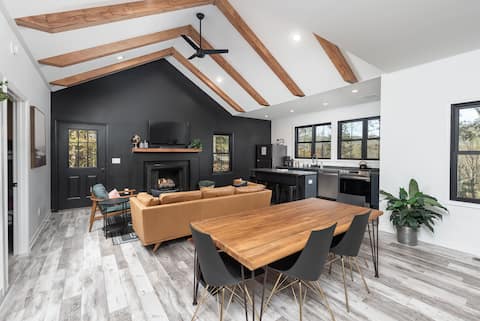
Mountain Home in Nelson County
Entire Place • 3 bedrooms

Rated a top River Cabin in Va. Heart of Nelson Co.
Entire Place • 2 bedrooms
Modern cabin, hot tub, mtn views, fireplace
Entire Place • 3 bedrooms
Note: Performance varies based on location, size, amenities, seasonality, and management quality. Data reflects the past 12 months.
Top Performing Airbnb Hosts in Faber (2026)
Learn from the best! This table showcases top-performing Airbnb hosts in Faber based on the number of properties managed and estimated total revenue over the past year. Analyze their scale and performance metrics.
| Host Name | Properties | Grossing Revenue | Stay Reviews | Avg Rating |
|---|---|---|---|---|
| Randy & Halie | 2 | $244,444 | 93 | 5.00/5.0 |
| John | 2 | $130,253 | 219 | 4.99/5.0 |
| Lauren | 1 | $112,612 | 159 | 4.95/5.0 |
| Jamie | 2 | $102,047 | 119 | 4.88/5.0 |
| Carl | 1 | $94,317 | 39 | 4.95/5.0 |
| Reagan | 2 | $91,741 | 185 | 5.00/5.0 |
| Anthony And Trew | 3 | $85,716 | 378 | 4.99/5.0 |
| Bradley | 1 | $77,368 | 245 | 4.93/5.0 |
| Jerry | 1 | $74,403 | 89 | 4.89/5.0 |
| Michael | 1 | $66,480 | 79 | 4.94/5.0 |
Analyzing the strategies of top hosts, such as their property selection, pricing, and guest communication, can offer valuable lessons for optimizing your own Airbnb operations in Faber.
Dive Deeper: Advanced Faber STR Market Data (2026)
Ready to unlock more insights? AirROI provides access to advanced metrics and comprehensive Airbnb data for Faber. Explore detailed analytics beyond this report to refine your investment strategy, optimize pricing, and maximize your vacation rental profits.
Explore Advanced MetricsFaber Short-Term Rental Market Composition (2026): Property & Room Types
Room Type Distribution
Property Type Distribution
Market Composition Insights for Faber
- The Faber Airbnb market composition is heavily skewed towards Entire Home/Apt listings, which make up 100% of the 25 active rentals. This indicates strong guest preference for privacy and space.
- Looking at the property type distribution in Faber, House properties are the most common (52%), reflecting the local real estate landscape.
- Houses represent a significant 52% portion, catering likely to families or larger groups.
- The presence of 8% Hotel/Boutique listings indicates integration with traditional hospitality.
Faber Airbnb Room Capacity Analysis (2026): Bedroom Distribution
Distribution of Listings by Number of Bedrooms
Room Capacity Insights for Faber
- The dominant room capacity in Faber is 5+ bedrooms listings, making up 20% of the market. This suggests a strong demand for properties suitable for families or small groups.
- Together, 5+ bedrooms and 2 bedrooms properties represent 40.0% of the active Airbnb listings in Faber, indicating a high concentration in these sizes.
- A significant 52.0% of listings offer 3+ bedrooms, catering to larger groups and families seeking more space in Faber.
Faber Vacation Rental Guest Capacity Trends (2026)
Distribution of Listings by Guest Capacity
Guest Capacity Insights for Faber
- The most common guest capacity trend in Faber vacation rentals is listings accommodating 8+ guests (44%). This suggests the primary traveler segment is likely larger groups.
- Properties designed for 8+ guests and 2 guests dominate the Faber STR market, accounting for 64.0% of listings.
- 60.0% of properties accommodate 6+ guests, serving the market segment for larger families or group travel in Faber.
- On average, properties in Faber are equipped to host 5.6 guests.
Faber Airbnb Booking Patterns (2026): Available vs. Booked Days
Available Days Distribution
Booked Days Distribution
Booking Pattern Insights for Faber
- The most common availability pattern in Faber falls within the 181-270 days range, representing 48% of listings. This suggests many properties have significant open periods on their calendars.
- Approximately 68.0% of listings show high availability (181+ days open annually), indicating potential for increased bookings or specific owner usage patterns.
- For booked days, the 91-180 days range is most frequent in Faber (44%), reflecting common guest stay durations or potential owner blocking patterns.
- A notable 36.0% of properties secure long booking periods (181+ days booked per year), highlighting successful long-term rental strategies or significant owner usage.
Faber Airbnb Minimum Stay Requirements Analysis
Distribution of Listings by Minimum Night Requirement
1 Night
5 listings
20% of total
2 Nights
13 listings
52% of total
30+ Nights
7 listings
28% of total
Key Insights
- The most prevalent minimum stay requirement in Faber is 2 Nights, adopted by 52% of listings. This highlights the market's preference for shorter, flexible bookings.
- A strong majority (72.0%) of the Faber Airbnb data shows acceptance of very short stays (1-2 nights), indicating a dynamic, high-turnover market.
- A significant segment (28%) caters to monthly stays (30+ nights) in Faber, pointing to opportunities in the extended-stay market.
Recommendations
- Align with the market by considering a 2 Nights minimum stay, as 52% of Faber hosts use this setting.
- If feasible, allowing 1-night stays, especially midweek or during low season, could capture last-minute bookings, as only 20% currently do.
- Explore offering discounts for stays of 30+ nights to attract the 28% of the market seeking extended stays.
- Adjust minimum nights based on seasonality – potentially shorter during low season and longer during peak demand periods in Faber.
Faber Airbnb Cancellation Policy Trends Analysis (2026)
Super Strict 60 Days
2 listings
8% of total
Flexible
5 listings
20% of total
Moderate
4 listings
16% of total
Firm
10 listings
40% of total
Strict
4 listings
16% of total
Cancellation Policy Insights for Faber
- The prevailing Airbnb cancellation policy trend in Faber is Firm, used by 40% of listings.
- A majority (56.0%) of hosts in Faber utilize Firm or Strict policies, indicating a market where hosts prioritize booking security.
Recommendations for Hosts
- Consider adopting a Firm policy to align with the 40% market standard in Faber.
- Regularly review your cancellation policy against competitors and market demand shifts in Faber.
Faber STR Booking Lead Time Analysis (2026)
Average Booking Lead Time by Month
Booking Lead Time Insights for Faber
- The overall average booking lead time for vacation rentals in Faber is 65 days.
- Guests book furthest in advance for stays during May (average 105 days), likely coinciding with peak travel demand or local events.
- The shortest booking windows occur for stays in January (average 23 days), indicating more last-minute travel plans during this time.
- Seasonally, Fall (84 days avg.) sees the longest lead times, while Winter (38 days avg.) has the shortest, reflecting typical travel planning cycles.
Recommendations for Hosts
- Use the overall average lead time (65 days) as a baseline for your pricing and availability strategy in Faber.
- For May stays, consider implementing length-of-stay discounts or slightly higher rates for bookings made less than 105 days out to capitalize on advance planning.
- Target marketing efforts for the Fall season well in advance (at least 84 days) to capture early planners.
- Monitor your own booking lead times against these Faber averages to identify opportunities for dynamic pricing adjustments.
Popular & Essential Airbnb Amenities in Faber (2026)
Amenity Prevalence
No amenities with partial availability (less than 100%) were found to display in the chart. All essential amenities might be present in all listings. Check insights below.
Amenity Insights for Faber
- Essential amenities in Faber that guests expect include: Cooking basics, Kitchen, Bed linens, Wifi, Air conditioning, Smoke alarm, Free parking on premises, Heating, Dishes and silverware, Hot water. Lacking these (any) could significantly impact bookings.
Recommendations for Hosts
- Ensure your listing includes all essential amenities for Faber: Cooking basics, Kitchen, Bed linens, Wifi, Air conditioning, Smoke alarm, Free parking on premises, Heating, Dishes and silverware, Hot water.
- Highlight unique or less common amenities you offer (e.g., hot tub, dedicated workspace, EV charger) in your listing description and photos.
- Regularly check competitor amenities in Faber to stay competitive.
Faber Airbnb Guest Demographics & Profile Analysis (2026)
Guest Profile Summary for Faber
- The typical guest profile for Airbnb in Faber consists of primarily domestic travelers (94%), often arriving from nearby Virginia Beach, typically belonging to the Post-2000s (Gen Z/Alpha) group (50%), primarily speaking English or Spanish.
- Domestic travelers account for 93.9% of guests.
- Key international markets include United States (93.9%) and DC (3.3%).
- Top languages spoken are English (73.6%) followed by Spanish (9.7%).
- A significant demographic segment is the Post-2000s (Gen Z/Alpha) group, representing 50% of guests.
Recommendations for Hosts
- Target domestic marketing efforts towards travelers from Virginia Beach and Richmond.
- Tailor amenities and listing descriptions to appeal to the dominant Post-2000s (Gen Z/Alpha) demographic (e.g., highlight fast WiFi, smart home features, local guides).
- Highlight unique local experiences or amenities relevant to the primary guest profile.
- Consider seasonal promotions aligned with peak travel times for key origin markets.
Nearby Short-Term Rental Market Comparison
How does the Faber Airbnb market stack up against its neighbors? Compare key performance metrics like average monthly revenue, ADR, and occupancy rates in surrounding areas to understand the broader regional STR landscape.
| Market | Active Properties | Monthly Revenue | Daily Rate | Avg. Occupancy |
|---|---|---|---|---|
| McGaheysville | 83 | $6,156 | $431.72 | 45% |
| Penhook | 18 | $5,675 | $678.75 | 37% |
| Bentonville | 23 | $5,372 | $420.82 | 51% |
| Nellysford | 62 | $5,276 | $426.33 | 39% |
| Bumpass | 120 | $4,851 | $553.01 | 33% |
| Mineral | 231 | $4,800 | $474.55 | 36% |
| Shenandoah | 104 | $4,778 | $354.44 | 47% |
| Middleburg | 39 | $4,681 | $485.11 | 41% |
| Skyland Estates | 14 | $4,649 | $280.30 | 55% |
| Castleton | 11 | $4,646 | $528.43 | 30% |