Draper Airbnb Market Analysis 2026: Short Term Rental Data & Vacation Rental Statistics in Virginia, United States
Is Airbnb profitable in Draper in 2026? Explore comprehensive Airbnb analytics for Draper, Virginia, United States to uncover income potential. This 2026 STR market report for Draper, based on AirROI data from February 2025 to January 2026, reveals key trends in the niche market of 20 active listings.
Whether you're considering an Airbnb investment in Draper, optimizing your existing vacation rental, or exploring rental arbitrage opportunities, understanding the Draper Airbnb data is crucial. Leveraging the low regulation environment is key to maximizing your short term rental income potential. Let's dive into the specifics.
Key Draper Airbnb Performance Metrics Overview
Monthly Airbnb Revenue Variations & Income Potential in Draper (2026)
Understanding the monthly revenue variations for Airbnb listings in Draper is key to maximizing your short term rental income potential. Seasonality significantly impacts earnings. Our analysis, based on data from the past 12 months, shows that the peak revenue month for STRs in Draper is typically July, while February often presents the lowest earnings, highlighting opportunities for strategic pricing adjustments during shoulder and low seasons. Explore the typical Airbnb income in Draper across different performance tiers:
- Best-in-class properties (Top 10%) achieve $5,479+ monthly, often utilizing dynamic pricing and superior guest experiences.
- Strong performing properties (Top 25%) earn $3,870 or more, indicating effective management and desirable locations/amenities.
- Typical properties (Median) generate around $2,332 per month, representing the average market performance.
- Entry-level properties (Bottom 25%) see earnings around $1,484, often with potential for optimization.
Average Monthly Airbnb Earnings Trend in Draper
Draper Airbnb Occupancy Rate Trends (2026)
Maximize your bookings by understanding the Draper STR occupancy trends. Seasonal demand shifts significantly influence how often properties are booked. Typically, Julysees the highest demand (peak season occupancy), while February experiences the lowest (low season). Effective strategies, like adjusting minimum stays or offering promotions, can boost occupancy during slower periods. Here's how different property tiers perform in Draper:
- Best-in-class properties (Top 10%) achieve 73%+ occupancy, indicating high desirability and potentially optimized availability.
- Strong performing properties (Top 25%) maintain 56% or higher occupancy, suggesting good market fit and guest satisfaction.
- Typical properties (Median) have an occupancy rate around 40%.
- Entry-level properties (Bottom 25%) average 26% occupancy, potentially facing higher vacancy.
Average Monthly Occupancy Rate Trend in Draper
Average Daily Rate (ADR) Airbnb Trends in Draper (2026)
Effective short term rental pricing strategy in Draper involves understanding monthly ADR fluctuations. The Average Daily Rate (ADR) for Airbnb in Draper typically peaks in May and dips lowest during January. Leveraging Airbnb dynamic pricing tools or strategies based on this seasonality can significantly boost revenue. Here's a look at the typical nightly rates achieved:
- Best-in-class properties (Top 10%) command rates of $337+ per night, often due to premium features or locations.
- Strong performing properties (Top 25%) achieve nightly rates of $277 or more.
- Typical properties (Median) charge around $193 per night.
- Entry-level properties (Bottom 25%) earn around $160 per night.
Average Daily Rate (ADR) Trend by Month in Draper
Get Live Draper Market Intelligence 👇

Explore Real-time Analytics
Airbnb Seasonality Analysis & Trends in Draper (2026)
Peak Season (July, August, June)
- Revenue averages $4,018 per month
- Occupancy rates average 58.8%
- Daily rates average $220
Shoulder Season
- Revenue averages $2,770 per month
- Occupancy maintains around 40.1%
- Daily rates hold near $223
Low Season (January, February, March)
- Revenue drops to average $1,766 per month
- Occupancy decreases to average 29.0%
- Daily rates adjust to average $204
Seasonality Insights for Draper
- The Airbnb seasonality in Draper shows highly seasonal trends requiring careful strategy. While the sections above show seasonal averages, it's also insightful to look at the extremes:
- During the high season, the absolute peak month showcases Draper's highest earning potential, with monthly revenues capable of climbing to $4,239, occupancy reaching a high of 62.3%, and ADRs peaking at $235.
- Conversely, the slowest single month of the year, typically falling within the low season, marks the market's lowest point. In this month, revenue might dip to $1,448, occupancy could drop to 26.5%, and ADRs may adjust down to $198.
- Understanding both the seasonal averages and these monthly peaks and troughs in revenue, occupancy, and ADR is crucial for maximizing your Airbnb profit potential in Draper.
Seasonal Strategies for Maximizing Profit
- Peak Season: Maximize revenue through premium pricing and potentially longer minimum stays. Ensure high availability.
- Low Season: Offer competitive pricing, special promotions (e.g., extended stay discounts), and flexible cancellation policies. Target off-season travelers like remote workers or budget-conscious guests.
- Shoulder Seasons: Implement dynamic pricing that balances peak and low rates. Target weekend travelers or specific events. Offer slightly more flexible terms than peak season.
- Regularly analyze your own performance against these Draper seasonality benchmarks and adjust your pricing and availability strategy accordingly.
Best Areas for Airbnb Investment in Draper (2026)
Exploring the top neighborhoods for short-term rentals in Draper? This section highlights key areas, outlining why they are attractive for hosts and guests, along with notable local attractions. Consider these locations based on your target guest profile and investment strategy.
| Neighborhood / Area | Why Host Here? (Target Guests & Appeal) | Key Attractions & Landmarks |
|---|---|---|
| Blue Ridge Parkway | A scenic drive known for its stunning views, hiking trails, and outdoor activities. Attracts nature lovers and tourists seeking adventure and relaxation in the mountains. | Blue Ridge Parkway, Hiking Trails, Waterfalls, Scenic Overlooks, Picnic Areas |
| Draper Town Center | The heart of Draper with shops, restaurants, and community events. Perfect for visitors wanting to experience local culture and dining. | Draper City Park, Draper Historical Society, Restaurants, Shopping Centers |
| Corner Canyon | A beautiful area known for its trails and outdoor recreation. Great for those who enjoy mountain biking and hiking. | Corner Canyon Trails, Hiking, Mountain Biking, Picnic Areas, Wildlife Viewing |
| South Mountain | A residential neighborhood with stunning views, perfect for families or travelers seeking peace in nature while being close to city amenities. | Park access, Hiking trails, Viewpoints |
| Winged Foot Park | A recreational area in Draper providing park facilities and sports fields, appealing to families and outdoor lovers. | Sports Fields, Walking Trails, Playgrounds, Picnic Areas |
| Draper Historic Park | A park that showcases the history of Draper with historic buildings and beautiful scenery, perfect for history buffs and families. | Historic Buildings, Trails, Grass Areas for picnics, Community Events |
| The Loveland Living Planet Aquarium | A family-friendly attraction in nearby Draper known for interactive exhibits and marine life displays. Attractive to families and school trips. | Aquarium, Interactive Exhibits, Educational Programs, Gift Shop |
| Nearby Ski Resorts | Proximity to skiing areas like Snowbird, Alta, and Brighton Mountains makes it attractive for winter sports enthusiasts. | Skiing, Snowboarding, Apres Ski Activities, Winter Hiking |
Understanding Airbnb License Requirements & STR Laws in Draper (2026)
While Draper, Virginia, United States currently shows low STR regulations, specific Airbnb license requirements might still exist or change. Always verify the latest short term rental regulations and Airbnb license requirements directly with local government authorities for Draper to ensure full compliance before hosting.
(Source: AirROI data, 2026, finding no licensed listings among those analyzed)
Top Performing Airbnb Properties in Draper (2026)
Benchmark your potential! Explore examples of top-performing Airbnb properties in Draperbased on Trailing Twelve Month (TTM) revenue. Analyze their characteristics, revenue, occupancy rate, and ADR to understand what drives success in this market.
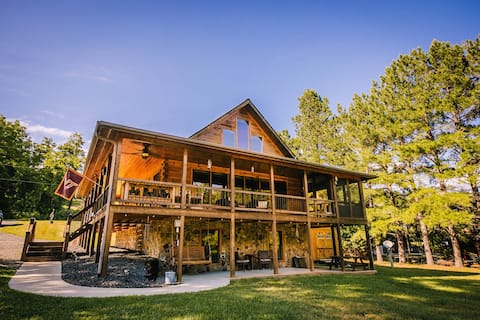
Luxury Waterfront/Sauna on New River! 2BS6
Entire Place • 2 bedrooms
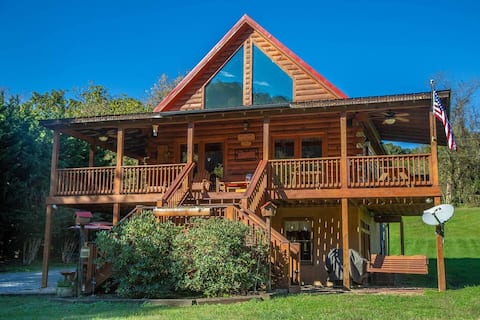
Riverfront Log Cabin/Pet Friendly/Family Fun! 3BS8
Entire Place • 3 bedrooms
In The Clouds
Entire Place • 4 bedrooms

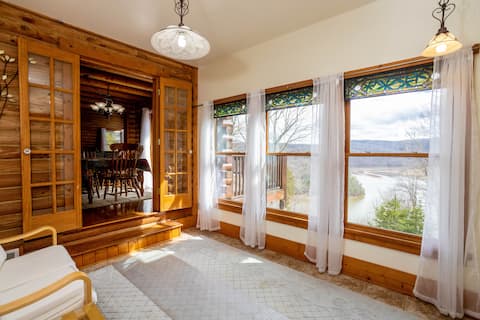
Spacious & Stylish Waterfront Home on New River! 3
Entire Place • 3 bedrooms
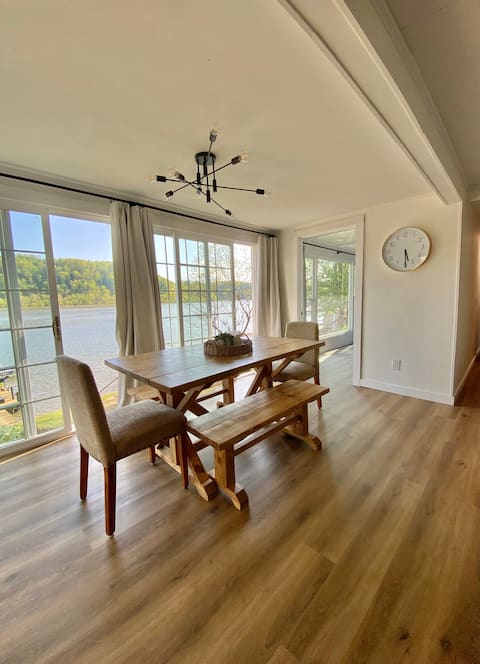
Cozy Lakefront Cottage at Claytor Lake/ New River
Entire Place • 3 bedrooms
Cozy, Romantic, River & Trail Access, Great Views
Entire Place • 1 bedroom
Note: Performance varies based on location, size, amenities, seasonality, and management quality. Data reflects the past 12 months.
Top Performing Airbnb Hosts in Draper (2026)
Learn from the best! This table showcases top-performing Airbnb hosts in Draper based on the number of properties managed and estimated total revenue over the past year. Analyze their scale and performance metrics.
| Host Name | Properties | Grossing Revenue | Stay Reviews | Avg Rating |
|---|---|---|---|---|
| New River Retreat | 9 | $282,119 | 247 | 4.84/5.0 |
| Blue Ridge Escapes | 3 | $90,270 | 97 | 4.92/5.0 |
| Michael | 4 | $81,407 | 616 | 4.89/5.0 |
| Lindsay | 1 | $37,229 | 82 | 4.99/5.0 |
| Jennifer | 2 | $24,318 | 174 | 4.92/5.0 |
| Davin | 1 | $22,605 | 26 | 4.88/5.0 |
Analyzing the strategies of top hosts, such as their property selection, pricing, and guest communication, can offer valuable lessons for optimizing your own Airbnb operations in Draper.
Dive Deeper: Advanced Draper STR Market Data (2026)
Ready to unlock more insights? AirROI provides access to advanced metrics and comprehensive Airbnb data for Draper. Explore detailed analytics beyond this report to refine your investment strategy, optimize pricing, and maximize your vacation rental profits.
Explore Advanced MetricsDraper Short-Term Rental Market Composition (2026): Property & Room Types
Room Type Distribution
Property Type Distribution
Market Composition Insights for Draper
- The Draper Airbnb market composition is heavily skewed towards Entire Home/Apt listings, which make up 100% of the 20 active rentals. This indicates strong guest preference for privacy and space.
- Looking at the property type distribution in Draper, House properties are the most common (55%), reflecting the local real estate landscape.
- Houses represent a significant 55% portion, catering likely to families or larger groups.
Draper Airbnb Room Capacity Analysis (2026): Bedroom Distribution
Distribution of Listings by Number of Bedrooms
Room Capacity Insights for Draper
- The dominant room capacity in Draper is 3 bedrooms listings, making up 35% of the market. This suggests a strong demand for properties suitable for families or small groups.
- Together, 3 bedrooms and 2 bedrooms properties represent 60.0% of the active Airbnb listings in Draper, indicating a high concentration in these sizes.
- A significant 45.0% of listings offer 3+ bedrooms, catering to larger groups and families seeking more space in Draper.
Draper Vacation Rental Guest Capacity Trends (2026)
Distribution of Listings by Guest Capacity
Guest Capacity Insights for Draper
- The most common guest capacity trend in Draper vacation rentals is listings accommodating 2 guests (25%). This suggests the primary traveler segment is likely couples or solo travelers.
- Properties designed for 2 guests and 4 guests dominate the Draper STR market, accounting for 50.0% of listings.
- 50.0% of properties accommodate 6+ guests, serving the market segment for larger families or group travel in Draper.
- On average, properties in Draper are equipped to host 5.0 guests.
Draper Airbnb Booking Patterns (2026): Available vs. Booked Days
Available Days Distribution
Booked Days Distribution
Booking Pattern Insights for Draper
- The most common availability pattern in Draper falls within the 181-270 days range, representing 55% of listings. This suggests many properties have significant open periods on their calendars.
- Approximately 85.0% of listings show high availability (181+ days open annually), indicating potential for increased bookings or specific owner usage patterns.
- For booked days, the 91-180 days range is most frequent in Draper (50%), reflecting common guest stay durations or potential owner blocking patterns.
- A notable 20.0% of properties secure long booking periods (181+ days booked per year), highlighting successful long-term rental strategies or significant owner usage.
Draper Airbnb Minimum Stay Requirements Analysis
Distribution of Listings by Minimum Night Requirement
1 Night
1 listings
5% of total
2 Nights
7 listings
35% of total
30+ Nights
12 listings
60% of total
Key Insights
- The most prevalent minimum stay requirement in Draper is 30+ Nights, adopted by 60% of listings. This highlights the market's preference for longer commitments.
- A significant segment (60%) caters to monthly stays (30+ nights) in Draper, pointing to opportunities in the extended-stay market.
Recommendations
- Align with the market by considering a 30+ Nights minimum stay, as 60% of Draper hosts use this setting.
- If feasible, allowing 1-night stays, especially midweek or during low season, could capture last-minute bookings, as only 5% currently do.
- A 2-night minimum appears standard (35%). Consider this for weekends or peak periods.
- Explore offering discounts for stays of 30+ nights to attract the 60% of the market seeking extended stays.
- Adjust minimum nights based on seasonality – potentially shorter during low season and longer during peak demand periods in Draper.
Draper Airbnb Cancellation Policy Trends Analysis (2026)
Flexible
3 listings
15% of total
Moderate
1 listings
5% of total
Firm
16 listings
80% of total
Cancellation Policy Insights for Draper
- The prevailing Airbnb cancellation policy trend in Draper is Firm, used by 80% of listings.
- A majority (80.0%) of hosts in Draper utilize Firm or Strict policies, indicating a market where hosts prioritize booking security.
Recommendations for Hosts
- Consider adopting a Firm policy to align with the 80% market standard in Draper.
- Regularly review your cancellation policy against competitors and market demand shifts in Draper.
Draper STR Booking Lead Time Analysis (2026)
Average Booking Lead Time by Month
Booking Lead Time Insights for Draper
- The overall average booking lead time for vacation rentals in Draper is 34 days.
- Guests book furthest in advance for stays during May (average 59 days), likely coinciding with peak travel demand or local events.
- The shortest booking windows occur for stays in December (average 21 days), indicating more last-minute travel plans during this time.
- Seasonally, Spring (40 days avg.) sees the longest lead times, while Winter (31 days avg.) has the shortest, reflecting typical travel planning cycles.
Recommendations for Hosts
- Use the overall average lead time (34 days) as a baseline for your pricing and availability strategy in Draper.
- For May stays, consider implementing length-of-stay discounts or slightly higher rates for bookings made less than 59 days out to capitalize on advance planning.
- Target marketing efforts for the Spring season well in advance (at least 40 days) to capture early planners.
- Monitor your own booking lead times against these Draper averages to identify opportunities for dynamic pricing adjustments.
Popular & Essential Airbnb Amenities in Draper (2026)
Amenity Prevalence
No amenities with partial availability (less than 100%) were found to display in the chart. All essential amenities might be present in all listings. Check insights below.
Amenity Insights for Draper
- Essential amenities in Draper that guests expect include: Kitchen, Bed linens, Air conditioning, Coffee maker, Stove, BBQ grill, TV, Hot water, Cooking basics, Wifi. Lacking these (any) could significantly impact bookings.
Recommendations for Hosts
- Ensure your listing includes all essential amenities for Draper: Kitchen, Bed linens, Air conditioning, Coffee maker, Stove, BBQ grill, TV, Hot water, Cooking basics, Wifi.
- Highlight unique or less common amenities you offer (e.g., hot tub, dedicated workspace, EV charger) in your listing description and photos.
- Regularly check competitor amenities in Draper to stay competitive.
Draper Airbnb Guest Demographics & Profile Analysis (2026)
Guest Profile Summary for Draper
- The typical guest profile for Airbnb in Draper consists of primarily domestic travelers (98%), often arriving from nearby Greenville, typically belonging to the Post-2000s (Gen Z/Alpha) group (50%), primarily speaking English or Spanish.
- Domestic travelers account for 98.2% of guests.
- Key international markets include United States (98.2%) and France (1.2%).
- Top languages spoken are English (77.3%) followed by Spanish (12%).
- A significant demographic segment is the Post-2000s (Gen Z/Alpha) group, representing 50% of guests.
Recommendations for Hosts
- Target domestic marketing efforts towards travelers from Greenville and Lynchburg.
- Tailor amenities and listing descriptions to appeal to the dominant Post-2000s (Gen Z/Alpha) demographic (e.g., highlight fast WiFi, smart home features, local guides).
- Highlight unique local experiences or amenities relevant to the primary guest profile.
- Consider seasonal promotions aligned with peak travel times for key origin markets.
Nearby Short-Term Rental Market Comparison
How does the Draper Airbnb market stack up against its neighbors? Compare key performance metrics like average monthly revenue, ADR, and occupancy rates in surrounding areas to understand the broader regional STR landscape.
| Market | Active Properties | Monthly Revenue | Daily Rate | Avg. Occupancy |
|---|---|---|---|---|
| Denver | 109 | $6,309 | $590.96 | 45% |
| Catawba | 16 | $6,093 | $582.49 | 38% |
| Mooresville | 369 | $5,702 | $559.93 | 42% |
| Penhook | 18 | $5,675 | $678.75 | 37% |
| Sherrills Ford | 107 | $5,615 | $547.26 | 41% |
| Troutman | 49 | $5,587 | $467.90 | 42% |
| Lake Norman of Catawba | 51 | $4,972 | $513.30 | 43% |
| Rockbridge Baths | 12 | $4,144 | $298.35 | 45% |
| Blacksburg | 297 | $4,116 | $509.14 | 40% |
| Goodview | 31 | $3,953 | $401.90 | 44% |