Bentonville Airbnb Market Analysis 2026: Short Term Rental Data & Vacation Rental Statistics in Virginia, United States
Is Airbnb profitable in Bentonville in 2026? Explore comprehensive Airbnb analytics for Bentonville, Virginia, United States to uncover income potential. This 2026 STR market report for Bentonville, based on AirROI data from February 2025 to January 2026, reveals key trends in the niche market of 23 active listings.
Whether you're considering an Airbnb investment in Bentonville, optimizing your existing vacation rental, or exploring rental arbitrage opportunities, understanding the Bentonville Airbnb data is crucial. Leveraging the low regulation environment is key to maximizing your short term rental income potential. Let's dive into the specifics.
Key Bentonville Airbnb Performance Metrics Overview
Monthly Airbnb Revenue Variations & Income Potential in Bentonville (2026)
Understanding the monthly revenue variations for Airbnb listings in Bentonville is key to maximizing your short term rental income potential. Seasonality significantly impacts earnings. Our analysis, based on data from the past 12 months, shows that the peak revenue month for STRs in Bentonville is typically October, while February often presents the lowest earnings, highlighting opportunities for strategic pricing adjustments during shoulder and low seasons. Explore the typical Airbnb income in Bentonville across different performance tiers:
- Best-in-class properties (Top 10%) achieve $12,235+ monthly, often utilizing dynamic pricing and superior guest experiences.
- Strong performing properties (Top 25%) earn $8,895 or more, indicating effective management and desirable locations/amenities.
- Typical properties (Median) generate around $5,187 per month, representing the average market performance.
- Entry-level properties (Bottom 25%) see earnings around $3,241, often with potential for optimization.
Average Monthly Airbnb Earnings Trend in Bentonville
Bentonville Airbnb Occupancy Rate Trends (2026)
Maximize your bookings by understanding the Bentonville STR occupancy trends. Seasonal demand shifts significantly influence how often properties are booked. Typically, Aprilsees the highest demand (peak season occupancy), while September experiences the lowest (low season). Effective strategies, like adjusting minimum stays or offering promotions, can boost occupancy during slower periods. Here's how different property tiers perform in Bentonville:
- Best-in-class properties (Top 10%) achieve 85%+ occupancy, indicating high desirability and potentially optimized availability.
- Strong performing properties (Top 25%) maintain 72% or higher occupancy, suggesting good market fit and guest satisfaction.
- Typical properties (Median) have an occupancy rate around 49%.
- Entry-level properties (Bottom 25%) average 33% occupancy, potentially facing higher vacancy.
Average Monthly Occupancy Rate Trend in Bentonville
Average Daily Rate (ADR) Airbnb Trends in Bentonville (2026)
Effective short term rental pricing strategy in Bentonville involves understanding monthly ADR fluctuations. The Average Daily Rate (ADR) for Airbnb in Bentonville typically peaks in October and dips lowest during March. Leveraging Airbnb dynamic pricing tools or strategies based on this seasonality can significantly boost revenue. Here's a look at the typical nightly rates achieved:
- Best-in-class properties (Top 10%) command rates of $859+ per night, often due to premium features or locations.
- Strong performing properties (Top 25%) achieve nightly rates of $452 or more.
- Typical properties (Median) charge around $355 per night.
- Entry-level properties (Bottom 25%) earn around $281 per night.
Average Daily Rate (ADR) Trend by Month in Bentonville
Get Live Bentonville Market Intelligence 👇

Explore Real-time Analytics
Airbnb Seasonality Analysis & Trends in Bentonville (2026)
Peak Season (October, August, November)
- Revenue averages $7,288 per month
- Occupancy rates average 53.7%
- Daily rates average $455
Shoulder Season
- Revenue averages $6,292 per month
- Occupancy maintains around 52.3%
- Daily rates hold near $429
Low Season (January, February, June)
- Revenue drops to average $5,621 per month
- Occupancy decreases to average 49.7%
- Daily rates adjust to average $419
Seasonality Insights for Bentonville
- The Airbnb seasonality in Bentonville shows moderate seasonality with distinct peak and low periods. While the sections above show seasonal averages, it's also insightful to look at the extremes:
- During the high season, the absolute peak month showcases Bentonville's highest earning potential, with monthly revenues capable of climbing to $7,636, occupancy reaching a high of 56.9%, and ADRs peaking at $461.
- Conversely, the slowest single month of the year, typically falling within the low season, marks the market's lowest point. In this month, revenue might dip to $5,348, occupancy could drop to 46.9%, and ADRs may adjust down to $393.
- Understanding both the seasonal averages and these monthly peaks and troughs in revenue, occupancy, and ADR is crucial for maximizing your Airbnb profit potential in Bentonville.
Seasonal Strategies for Maximizing Profit
- Peak Season: Maximize revenue through premium pricing and potentially longer minimum stays. Ensure high availability.
- Low Season: Offer competitive pricing, special promotions (e.g., extended stay discounts), and flexible cancellation policies. Target off-season travelers like remote workers or budget-conscious guests.
- Shoulder Seasons: Implement dynamic pricing that balances peak and low rates. Target weekend travelers or specific events. Offer slightly more flexible terms than peak season.
- Regularly analyze your own performance against these Bentonville seasonality benchmarks and adjust your pricing and availability strategy accordingly.
Best Areas for Airbnb Investment in Bentonville (2026)
Exploring the top neighborhoods for short-term rentals in Bentonville? This section highlights key areas, outlining why they are attractive for hosts and guests, along with notable local attractions. Consider these locations based on your target guest profile and investment strategy.
| Neighborhood / Area | Why Host Here? (Target Guests & Appeal) | Key Attractions & Landmarks |
|---|---|---|
| Bentonville Downtown | The heart of Bentonville featuring a vibrant mix of shops, restaurants, and cultural experiences. Ideal for travelers who want to explore local arts and the culinary scene. | Crystal Bridges Museum of American Art, The Momentary, Bentonville Square, Walton’s 5&10, Bentonville City Park |
| Slaughter Pen Trail | Popular for outdoor enthusiasts and cyclists, this area offers access to beautiful trails and nature. A great pick for those seeking an active vacation. | Slaughter Pen Trailhead, Bentonville Bike Park, Bentonville Community Center, Pinnacle Hills Promenade |
| Lake Bella Vista | A serene area that appeals to nature lovers and families, featuring beautiful lakeside views and outdoor activities. | Bella Vista Lake, Hiking Trails, Fishing Spots, Picnic Areas |
| Bentonville Arts District | Known for its cultural venues and public art installations, this area attracts art lovers and those interested in local events and festivals. | Theatre Squared, Bentonville Community Post, Art on the Square |
| Bentonville Historic District | Rich in history and charm, this area showcases beautiful architecture and historical sites, perfect for guests interested in the heritage of Bentonville. | Historic Benton County Courthouse, Museum of Native American History, Wilderness Road Park |
| Pea Ridge National Military Park | A significant Civil War site providing educational opportunities and historical tours, ideal for history buffs and travelers interested in exploring the past. | Pea Ridge National Military Park, Walking Trails, Visitor Center Exhibits |
| Ozark Mountain Region | Close to natural attractions and gorgeous scenery, perfect for travelers looking for adventure and outdoor activities. | Ozark National Forest, Caves and Waterfalls, Scenic Hiking Areas |
| Crystal Bridges Park | Surrounding the famous Crystal Bridges Museum, this park offers a beautiful setting for relaxation and cultural experiences, attracting art enthusiasts and families alike. | Walking Trails, Picnic Areas, Art Trails around the Museum |
Understanding Airbnb License Requirements & STR Laws in Bentonville (2026)
While Bentonville, Virginia, United States currently shows low STR regulations, specific Airbnb license requirements might still exist or change. Always verify the latest short term rental regulations and Airbnb license requirements directly with local government authorities for Bentonville to ensure full compliance before hosting.
(Source: AirROI data, 2026, finding no licensed listings among those analyzed)
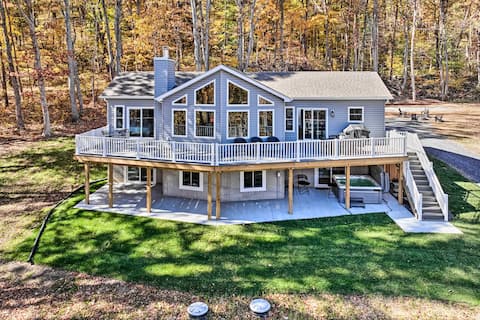
Top Performing Airbnb Properties in Bentonville (2026)
Benchmark your potential! Explore examples of top-performing Airbnb properties in Bentonvillebased on Trailing Twelve Month (TTM) revenue. Analyze their characteristics, revenue, occupancy rate, and ADR to understand what drives success in this market.
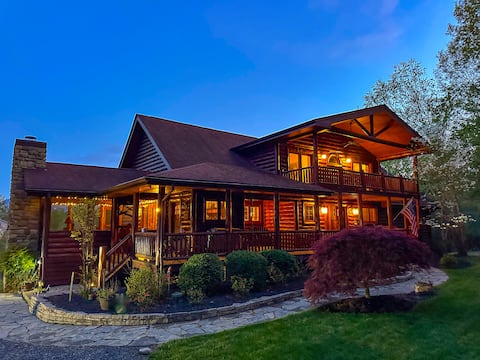
Stunning Log Cabin *Mtn Views* Gym-Sauna*Saloon
Entire Place • 4 bedrooms

Spacious Gathering~Firepit~Waterfront~WiFi
Entire Place • 5 bedrooms
Be Present Chalet - 15 Acres - Hot Tub
Entire Place • 5 bedrooms
River Woods Retreat HotTub L2EV Trails 10min2River
Entire Place • 3 bedrooms

Timber Creek: Falls - A Shenandoah Cabin
Entire Place • 1 bedroom
Great Group Outdoor Get-Away!
Entire Place • 7 bedrooms
Note: Performance varies based on location, size, amenities, seasonality, and management quality. Data reflects the past 12 months.
Top Performing Airbnb Hosts in Bentonville (2026)
Learn from the best! This table showcases top-performing Airbnb hosts in Bentonville based on the number of properties managed and estimated total revenue over the past year. Analyze their scale and performance metrics.
| Host Name | Properties | Grossing Revenue | Stay Reviews | Avg Rating |
|---|---|---|---|---|
| Ey Man | 3 | $253,921 | 252 | 4.82/5.0 |
| Jean | 1 | $174,331 | 41 | 5.00/5.0 |
| Dana | 1 | $118,573 | 51 | 5.00/5.0 |
| Mark | 1 | $102,393 | 194 | 4.97/5.0 |
| Zoë | 1 | $101,563 | 208 | 4.96/5.0 |
| Amir | 1 | $86,784 | 108 | 4.90/5.0 |
| Lisa | 1 | $78,586 | 51 | 5.00/5.0 |
| Olivia | 1 | $71,138 | 50 | 5.00/5.0 |
| William | 1 | $65,822 | 99 | 4.99/5.0 |
| Mike And Judy | 2 | $64,420 | 520 | 4.92/5.0 |
Analyzing the strategies of top hosts, such as their property selection, pricing, and guest communication, can offer valuable lessons for optimizing your own Airbnb operations in Bentonville.
Dive Deeper: Advanced Bentonville STR Market Data (2026)
Ready to unlock more insights? AirROI provides access to advanced metrics and comprehensive Airbnb data for Bentonville. Explore detailed analytics beyond this report to refine your investment strategy, optimize pricing, and maximize your vacation rental profits.
Explore Advanced MetricsBentonville Short-Term Rental Market Composition (2026): Property & Room Types
Room Type Distribution
Property Type Distribution
Market Composition Insights for Bentonville
- The Bentonville Airbnb market composition is heavily skewed towards Entire Home/Apt listings, which make up 100% of the 23 active rentals. This indicates strong guest preference for privacy and space.
- Looking at the property type distribution in Bentonville, House properties are the most common (47.8%), reflecting the local real estate landscape.
- Houses represent a significant 47.8% portion, catering likely to families or larger groups.
- Smaller segments like apartment/condo (combined 4.3%) offer potential for unique stay experiences.
Bentonville Airbnb Room Capacity Analysis (2026): Bedroom Distribution
Distribution of Listings by Number of Bedrooms
Room Capacity Insights for Bentonville
- The dominant room capacity in Bentonville is 3 bedrooms listings, making up 52.2% of the market. This suggests a strong demand for properties suitable for families or small groups.
- Together, 3 bedrooms and 2 bedrooms properties represent 69.6% of the active Airbnb listings in Bentonville, indicating a high concentration in these sizes.
- A significant 73.9% of listings offer 3+ bedrooms, catering to larger groups and families seeking more space in Bentonville.
Bentonville Vacation Rental Guest Capacity Trends (2026)
Distribution of Listings by Guest Capacity
Guest Capacity Insights for Bentonville
- The most common guest capacity trend in Bentonville vacation rentals is listings accommodating 6 guests (47.8%). This suggests the primary traveler segment is likely larger groups.
- Properties designed for 6 guests and 8+ guests dominate the Bentonville STR market, accounting for 73.9% of listings.
- 82.6% of properties accommodate 6+ guests, serving the market segment for larger families or group travel in Bentonville.
- On average, properties in Bentonville are equipped to host 6.2 guests.
Bentonville Airbnb Booking Patterns (2026): Available vs. Booked Days
Available Days Distribution
Booked Days Distribution
Booking Pattern Insights for Bentonville
- The most common availability pattern in Bentonville falls within the 181-270 days range, representing 39.1% of listings. This suggests many properties have significant open periods on their calendars.
- Approximately 56.5% of listings show high availability (181+ days open annually), indicating potential for increased bookings or specific owner usage patterns.
- For booked days, the 181-270 days range is most frequent in Bentonville (39.1%), reflecting common guest stay durations or potential owner blocking patterns.
- A notable 47.8% of properties secure long booking periods (181+ days booked per year), highlighting successful long-term rental strategies or significant owner usage.
Bentonville Airbnb Minimum Stay Requirements Analysis
Distribution of Listings by Minimum Night Requirement
1 Night
3 listings
13% of total
2 Nights
9 listings
39.1% of total
3 Nights
1 listings
4.3% of total
30+ Nights
10 listings
43.5% of total
Key Insights
- The most prevalent minimum stay requirement in Bentonville is 30+ Nights, adopted by 43.5% of listings. This highlights the market's preference for longer commitments.
- A significant segment (43.5%) caters to monthly stays (30+ nights) in Bentonville, pointing to opportunities in the extended-stay market.
Recommendations
- Align with the market by considering a 30+ Nights minimum stay, as 43.5% of Bentonville hosts use this setting.
- If feasible, allowing 1-night stays, especially midweek or during low season, could capture last-minute bookings, as only 13% currently do.
- A 2-night minimum appears standard (39.1%). Consider this for weekends or peak periods.
- Explore offering discounts for stays of 30+ nights to attract the 43.5% of the market seeking extended stays.
- Adjust minimum nights based on seasonality – potentially shorter during low season and longer during peak demand periods in Bentonville.
Bentonville Airbnb Cancellation Policy Trends Analysis (2026)
Super Strict 30 Days
1 listings
4.3% of total
Limited
2 listings
8.7% of total
Flexible
4 listings
17.4% of total
Moderate
4 listings
17.4% of total
Firm
11 listings
47.8% of total
Strict
1 listings
4.3% of total
Cancellation Policy Insights for Bentonville
- The prevailing Airbnb cancellation policy trend in Bentonville is Firm, used by 47.8% of listings.
- A majority (52.1%) of hosts in Bentonville utilize Firm or Strict policies, indicating a market where hosts prioritize booking security.
- Strict cancellation policies are quite rare (4.3%), potentially making listings with this policy less competitive unless justified by high demand or property type.
Recommendations for Hosts
- Consider adopting a Firm policy to align with the 47.8% market standard in Bentonville.
- Using a Strict policy might deter some guests, as only 4.3% of listings use it. Evaluate if potential revenue protection outweighs possible lower booking rates.
- Regularly review your cancellation policy against competitors and market demand shifts in Bentonville.
Bentonville STR Booking Lead Time Analysis (2026)
Average Booking Lead Time by Month
Booking Lead Time Insights for Bentonville
- The overall average booking lead time for vacation rentals in Bentonville is 50 days.
- Guests book furthest in advance for stays during November (average 64 days), likely coinciding with peak travel demand or local events.
- The shortest booking windows occur for stays in March (average 28 days), indicating more last-minute travel plans during this time.
- Seasonally, Fall (57 days avg.) sees the longest lead times, while Spring (46 days avg.) has the shortest, reflecting typical travel planning cycles.
Recommendations for Hosts
- Use the overall average lead time (50 days) as a baseline for your pricing and availability strategy in Bentonville.
- For November stays, consider implementing length-of-stay discounts or slightly higher rates for bookings made less than 64 days out to capitalize on advance planning.
- Target marketing efforts for the Fall season well in advance (at least 57 days) to capture early planners.
- Monitor your own booking lead times against these Bentonville averages to identify opportunities for dynamic pricing adjustments.
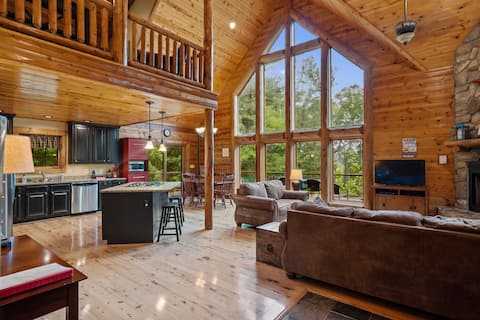
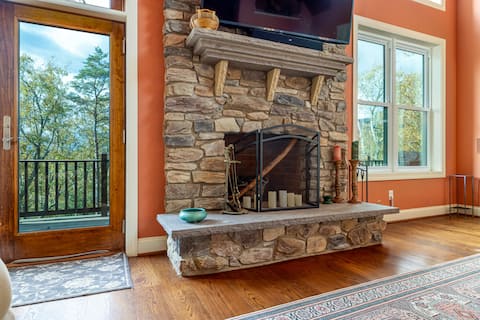
Popular & Essential Airbnb Amenities in Bentonville (2026)
Amenity Prevalence
No amenities with partial availability (less than 100%) were found to display in the chart. All essential amenities might be present in all listings. Check insights below.
Amenity Insights for Bentonville
- Essential amenities in Bentonville that guests expect include: Smoke alarm, Oven, Hot water, Air conditioning, Heating, Free parking on premises, Stove, Microwave, Kitchen, Wifi. Lacking these (any) could significantly impact bookings.
Recommendations for Hosts
- Ensure your listing includes all essential amenities for Bentonville: Smoke alarm, Oven, Hot water, Air conditioning, Heating, Free parking on premises, Stove, Microwave, Kitchen, Wifi.
- Highlight unique or less common amenities you offer (e.g., hot tub, dedicated workspace, EV charger) in your listing description and photos.
- Regularly check competitor amenities in Bentonville to stay competitive.
Bentonville Airbnb Guest Demographics & Profile Analysis (2026)
Guest Profile Summary for Bentonville
- The typical guest profile for Airbnb in Bentonville consists of primarily domestic travelers (81%), often arriving from nearby Washington, typically belonging to the Post-2000s (Gen Z/Alpha) group (50%), primarily speaking English or Spanish.
- Domestic travelers account for 80.5% of guests.
- Key international markets include United States (80.5%) and DC (14.2%).
- Top languages spoken are English (67.3%) followed by Spanish (14%).
- A significant demographic segment is the Post-2000s (Gen Z/Alpha) group, representing 50% of guests.
Recommendations for Hosts
- Target domestic marketing efforts towards travelers from Washington and Alexandria.
- Tailor amenities and listing descriptions to appeal to the dominant Post-2000s (Gen Z/Alpha) demographic (e.g., highlight fast WiFi, smart home features, local guides).
- Highlight unique local experiences or amenities relevant to the primary guest profile.
- Consider seasonal promotions aligned with peak travel times for key origin markets.
Nearby Short-Term Rental Market Comparison
How does the Bentonville Airbnb market stack up against its neighbors? Compare key performance metrics like average monthly revenue, ADR, and occupancy rates in surrounding areas to understand the broader regional STR landscape.
| Market | Active Properties | Monthly Revenue | Daily Rate | Avg. Occupancy |
|---|---|---|---|---|
| McGaheysville | 83 | $6,156 | $431.72 | 45% |
| Shannondale | 45 | $5,808 | $337.30 | 54% |
| Penhook | 18 | $5,675 | $678.75 | 37% |
| Nellysford | 62 | $5,276 | $426.33 | 39% |
| Bumpass | 120 | $4,851 | $553.01 | 33% |
| Mineral | 231 | $4,800 | $474.55 | 36% |
| Shenandoah | 104 | $4,778 | $354.44 | 47% |
| Middleburg | 39 | $4,681 | $485.11 | 41% |
| Skyland Estates | 14 | $4,649 | $280.30 | 55% |
| Castleton | 11 | $4,646 | $528.43 | 30% |