Annandale Airbnb Market Analysis 2026: Short Term Rental Data & Vacation Rental Statistics in Virginia, United States
Is Airbnb profitable in Annandale in 2026? Explore comprehensive Airbnb analytics for Annandale, Virginia, United States to uncover income potential. This 2026 STR market report for Annandale, based on AirROI data from February 2025 to January 2026, reveals key trends in the niche market of 67 active listings.
Whether you're considering an Airbnb investment in Annandale, optimizing your existing vacation rental, or exploring rental arbitrage opportunities, understanding the Annandale Airbnb data is crucial. Leveraging the low regulation environment is key to maximizing your short term rental income potential. Let's dive into the specifics.
Key Annandale Airbnb Performance Metrics Overview
Monthly Airbnb Revenue Variations & Income Potential in Annandale (2026)
Understanding the monthly revenue variations for Airbnb listings in Annandale is key to maximizing your short term rental income potential. Seasonality significantly impacts earnings. Our analysis, based on data from the past 12 months, shows that the peak revenue month for STRs in Annandale is typically July, while February often presents the lowest earnings, highlighting opportunities for strategic pricing adjustments during shoulder and low seasons. Explore the typical Airbnb income in Annandale across different performance tiers:
- Best-in-class properties (Top 10%) achieve $6,880+ monthly, often utilizing dynamic pricing and superior guest experiences.
- Strong performing properties (Top 25%) earn $3,498 or more, indicating effective management and desirable locations/amenities.
- Typical properties (Median) generate around $1,752 per month, representing the average market performance.
- Entry-level properties (Bottom 25%) see earnings around $947, often with potential for optimization.
Average Monthly Airbnb Earnings Trend in Annandale
Annandale Airbnb Occupancy Rate Trends (2026)
Maximize your bookings by understanding the Annandale STR occupancy trends. Seasonal demand shifts significantly influence how often properties are booked. Typically, Junesees the highest demand (peak season occupancy), while January experiences the lowest (low season). Effective strategies, like adjusting minimum stays or offering promotions, can boost occupancy during slower periods. Here's how different property tiers perform in Annandale:
- Best-in-class properties (Top 10%) achieve 86%+ occupancy, indicating high desirability and potentially optimized availability.
- Strong performing properties (Top 25%) maintain 73% or higher occupancy, suggesting good market fit and guest satisfaction.
- Typical properties (Median) have an occupancy rate around 52%.
- Entry-level properties (Bottom 25%) average 31% occupancy, potentially facing higher vacancy.
Average Monthly Occupancy Rate Trend in Annandale
Average Daily Rate (ADR) Airbnb Trends in Annandale (2026)
Effective short term rental pricing strategy in Annandale involves understanding monthly ADR fluctuations. The Average Daily Rate (ADR) for Airbnb in Annandale typically peaks in May and dips lowest during February. Leveraging Airbnb dynamic pricing tools or strategies based on this seasonality can significantly boost revenue. Here's a look at the typical nightly rates achieved:
- Best-in-class properties (Top 10%) command rates of $327+ per night, often due to premium features or locations.
- Strong performing properties (Top 25%) achieve nightly rates of $154 or more.
- Typical properties (Median) charge around $96 per night.
- Entry-level properties (Bottom 25%) earn around $61 per night.
Average Daily Rate (ADR) Trend by Month in Annandale
Get Live Annandale Market Intelligence 👇

Explore Real-time Analytics
Airbnb Seasonality Analysis & Trends in Annandale (2026)
Peak Season (July, December, April)
- Revenue averages $3,517 per month
- Occupancy rates average 54.2%
- Daily rates average $156
Shoulder Season
- Revenue averages $3,118 per month
- Occupancy maintains around 56.1%
- Daily rates hold near $155
Low Season (January, February, November)
- Revenue drops to average $2,136 per month
- Occupancy decreases to average 42.7%
- Daily rates adjust to average $143
Seasonality Insights for Annandale
- The Airbnb seasonality in Annandale shows moderate seasonality with distinct peak and low periods. While the sections above show seasonal averages, it's also insightful to look at the extremes:
- During the high season, the absolute peak month showcases Annandale's highest earning potential, with monthly revenues capable of climbing to $3,773, occupancy reaching a high of 63.0%, and ADRs peaking at $166.
- Conversely, the slowest single month of the year, typically falling within the low season, marks the market's lowest point. In this month, revenue might dip to $2,031, occupancy could drop to 37.5%, and ADRs may adjust down to $139.
- Understanding both the seasonal averages and these monthly peaks and troughs in revenue, occupancy, and ADR is crucial for maximizing your Airbnb profit potential in Annandale.
Seasonal Strategies for Maximizing Profit
- Peak Season: Maximize revenue through premium pricing and potentially longer minimum stays. Ensure high availability.
- Low Season: Offer competitive pricing, special promotions (e.g., extended stay discounts), and flexible cancellation policies. Target off-season travelers like remote workers or budget-conscious guests.
- Shoulder Seasons: Implement dynamic pricing that balances peak and low rates. Target weekend travelers or specific events. Offer slightly more flexible terms than peak season.
- Regularly analyze your own performance against these Annandale seasonality benchmarks and adjust your pricing and availability strategy accordingly.
Best Areas for Airbnb Investment in Annandale (2026)
Exploring the top neighborhoods for short-term rentals in Annandale? This section highlights key areas, outlining why they are attractive for hosts and guests, along with notable local attractions. Consider these locations based on your target guest profile and investment strategy.
| Neighborhood / Area | Why Host Here? (Target Guests & Appeal) | Key Attractions & Landmarks |
|---|---|---|
| Patterson Park | A vibrant neighborhood that offers a mix of historic charm and modern amenities. It's popular for those looking for outdoor activities and is close to local attractions and restaurants. | Patterson Park, Union Market, National Arboretum, H Street Corridor, Baltimore Museum of Art, Fort McHenry National Monument |
| Ballston | A bustling urban neighborhood in Arlington, Ballston is known for its shopping, dining, and proximity to the Metro. Ideal for both business travelers and families visiting Washington D.C. | Ballston Quarter, Virginia Square, Washington-Liberty High School, Mary Mount University, Lyon Village, Golden Triangle |
| Shirlington | A charming, walkable neighborhood full of dining options and entertainment. Shirlington is also home to a performing arts theater and is popular with both tourists and locals. | Signature Theatre, Shirlington Village, Dog Parks, Cameron Run Regional Park, The Village at Shirlington, W & OD Trail |
| Old Town Alexandria | Historic waterfront community with cobblestone streets and 18th-century architecture. It attracts visitors for its rich history and is only a short ride from D.C. | Old Town Historic District, King Street, George Washington Masonic Memorial, Torpedo Factory Art Center, Carlyle House, Alexandria Waterfront |
| Clarendon | A vivacious community in Arlington that offers an array of restaurants and nightlife. It's known for its strong sense of community and is a short Metro ride from D.C. | Clarendon Market, Four Mile Run Park, Local Parks, The Colonial Theatre, The Arlington Arts Center, Clara Barton National Historic Site |
| Georgetown | This historic area is famous for its shopping, dining, and beautiful waterfront views. It's a prime destination for tourists looking to explore Washington D.C. | Georgetown University, C&O Canal, Georgetown Waterfront Park, M Street, Dumbarton Oaks, The Old Stone House |
| Dupont Circle | A vibrant neighborhood known for its historic architecture, museums, and cultural landmarks. It's popular with tourists for its unique blend of history and modern urban life. | Dupont Circle Fountain, The Phillips Collection, The Dupont Circle Hotel, The Textile Museum, Comet Ping Pong, The Sit Room |
| Crystal City | Strategically located near the airport and with easy access to D.C., Crystal City is a bustling area with a range of shopping and dining. Ideal for business travelers and tourists. | Crystal City Shops, Amazon HQ2, Crystal City Water Park, Barcroft Park, The Fashion Centre at Pentagon City, The U.S. Marine Corps War Memorial |
Understanding Airbnb License Requirements & STR Laws in Annandale (2026)
While Annandale, Virginia, United States currently shows low STR regulations, specific Airbnb license requirements might still exist or change. Always verify the latest short term rental regulations and Airbnb license requirements directly with local government authorities for Annandale to ensure full compliance before hosting.
(Source: AirROI data, 2026, finding no licensed listings among those analyzed)
Top Performing Airbnb Properties in Annandale (2026)
Benchmark your potential! Explore examples of top-performing Airbnb properties in Annandalebased on Trailing Twelve Month (TTM) revenue. Analyze their characteristics, revenue, occupancy rate, and ADR to understand what drives success in this market.

Family Ready Dogs OK Ping Pong Backyard EV Charger
Entire Place • 7 bedrooms
Luxury HUGE 8 Bedroom Villa 15 min to WAS. D.C.
Entire Place • 8 bedrooms

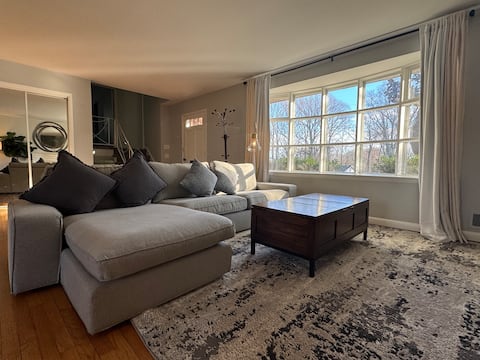
Divine Getaway- King Bed Master Suite Near DC
Entire Place • 6 bedrooms
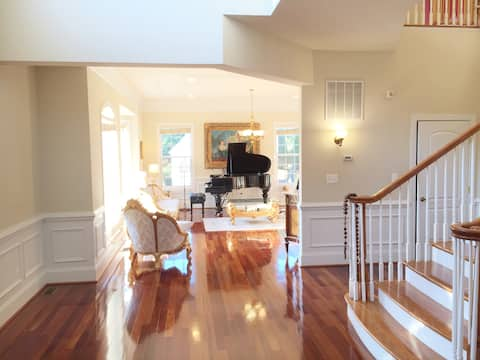
Beautiful 5BR/3.5BA Cape Cod Home + Park Views ❤
Entire Place • 5 bedrooms
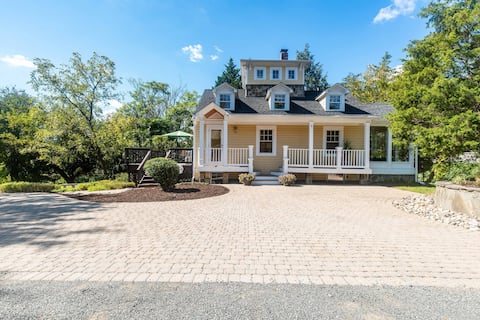
SUPER HOST! - Cozy Family Cottage
Entire Place • 3 bedrooms
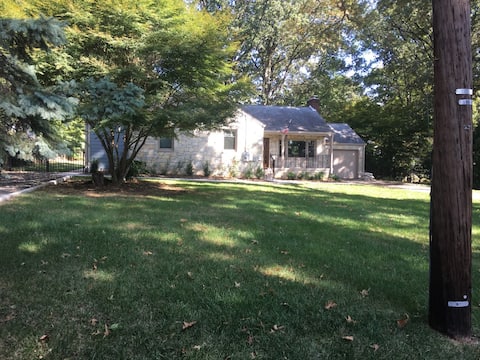
Cozy Annandale Escape Near DC!
Entire Place • 4 bedrooms
Note: Performance varies based on location, size, amenities, seasonality, and management quality. Data reflects the past 12 months.
Top Performing Airbnb Hosts in Annandale (2026)
Learn from the best! This table showcases top-performing Airbnb hosts in Annandale based on the number of properties managed and estimated total revenue over the past year. Analyze their scale and performance metrics.
| Host Name | Properties | Grossing Revenue | Stay Reviews | Avg Rating |
|---|---|---|---|---|
| Stay Bubo | 1 | $178,897 | 43 | 4.98/5.0 |
| Nemeh | 1 | $167,018 | 219 | 4.83/5.0 |
| Kelly | 2 | $124,792 | 62 | 4.89/5.0 |
| Maria | 1 | $92,807 | 150 | 4.94/5.0 |
| Jasmine And Martin | 1 | $85,327 | 211 | 4.97/5.0 |
| Andrew | 1 | $81,338 | 194 | 4.94/5.0 |
| Hannah | 3 | $50,618 | 10 | 4.90/5.0 |
| Jay | 2 | $46,729 | 45 | 4.72/5.0 |
| Burke | 2 | $44,022 | 257 | 4.87/5.0 |
| Emily | 1 | $42,721 | 95 | 4.95/5.0 |
Analyzing the strategies of top hosts, such as their property selection, pricing, and guest communication, can offer valuable lessons for optimizing your own Airbnb operations in Annandale.
Dive Deeper: Advanced Annandale STR Market Data (2026)
Ready to unlock more insights? AirROI provides access to advanced metrics and comprehensive Airbnb data for Annandale. Explore detailed analytics beyond this report to refine your investment strategy, optimize pricing, and maximize your vacation rental profits.
Explore Advanced MetricsAnnandale Short-Term Rental Market Composition (2026): Property & Room Types
Room Type Distribution
Property Type Distribution
Market Composition Insights for Annandale
- The Annandale Airbnb market composition is heavily skewed towards Private Room listings, which make up 52.2% of the 67 active rentals. This indicates strong guest preference for privacy and space.
- Looking at the property type distribution in Annandale, House properties are the most common (68.7%), reflecting the local real estate landscape.
- Houses represent a significant 68.7% portion, catering likely to families or larger groups.
- Smaller segments like hotel/boutique (combined 4.5%) offer potential for unique stay experiences.
Annandale Airbnb Room Capacity Analysis (2026): Bedroom Distribution
Distribution of Listings by Number of Bedrooms
Room Capacity Insights for Annandale
- The dominant room capacity in Annandale is 1 bedroom listings, making up 28.4% of the market. This suggests a strong demand for properties suitable for couples or solo travelers.
- Together, 1 bedroom and 5+ bedrooms properties represent 37.4% of the active Airbnb listings in Annandale, indicating a high concentration in these sizes.
- A significant 22.5% of listings offer 3+ bedrooms, catering to larger groups and families seeking more space in Annandale.
Annandale Vacation Rental Guest Capacity Trends (2026)
Distribution of Listings by Guest Capacity
Guest Capacity Insights for Annandale
- The most common guest capacity trend in Annandale vacation rentals is listings accommodating 8+ guests (14.9%). This suggests the primary traveler segment is likely larger groups.
- Properties designed for 8+ guests and 2 guests dominate the Annandale STR market, accounting for 26.8% of listings.
- 20.9% of properties accommodate 6+ guests, serving the market segment for larger families or group travel in Annandale.
- On average, properties in Annandale are equipped to host 2.5 guests.
Annandale Airbnb Booking Patterns (2026): Available vs. Booked Days
Available Days Distribution
Booked Days Distribution
Booking Pattern Insights for Annandale
- The most common availability pattern in Annandale falls within the 271-366 days range, representing 37.3% of listings. This suggests many properties have significant open periods on their calendars.
- Approximately 70.1% of listings show high availability (181+ days open annually), indicating potential for increased bookings or specific owner usage patterns.
- For booked days, the 91-180 days range is most frequent in Annandale (31.3%), reflecting common guest stay durations or potential owner blocking patterns.
- A notable 32.9% of properties secure long booking periods (181+ days booked per year), highlighting successful long-term rental strategies or significant owner usage.
Annandale Airbnb Minimum Stay Requirements Analysis
Distribution of Listings by Minimum Night Requirement
1 Night
16 listings
23.9% of total
2 Nights
9 listings
13.4% of total
3 Nights
4 listings
6% of total
4-6 Nights
7 listings
10.4% of total
7-29 Nights
13 listings
19.4% of total
30+ Nights
18 listings
26.9% of total
Key Insights
- The most prevalent minimum stay requirement in Annandale is 30+ Nights, adopted by 26.9% of listings. This highlights the market's preference for longer commitments.
- A significant segment (26.9%) caters to monthly stays (30+ nights) in Annandale, pointing to opportunities in the extended-stay market.
Recommendations
- Align with the market by considering a 30+ Nights minimum stay, as 26.9% of Annandale hosts use this setting.
- If feasible, allowing 1-night stays, especially midweek or during low season, could capture last-minute bookings, as only 23.9% currently do.
- Explore offering discounts for stays of 30+ nights to attract the 26.9% of the market seeking extended stays.
- Adjust minimum nights based on seasonality – potentially shorter during low season and longer during peak demand periods in Annandale.
Annandale Airbnb Cancellation Policy Trends Analysis (2026)
Flexible
14 listings
20.9% of total
Moderate
21 listings
31.3% of total
Firm
21 listings
31.3% of total
Strict
11 listings
16.4% of total
Cancellation Policy Insights for Annandale
- The prevailing Airbnb cancellation policy trend in Annandale is Moderate, used by 31.3% of listings.
- There's a relatively balanced mix between guest-friendly (52.2%) and stricter (47.7%) policies, offering choices for different guest needs.
Recommendations for Hosts
- Consider adopting a Moderate policy to align with the 31.3% market standard in Annandale.
- Regularly review your cancellation policy against competitors and market demand shifts in Annandale.
Annandale STR Booking Lead Time Analysis (2026)
Average Booking Lead Time by Month
Booking Lead Time Insights for Annandale
- The overall average booking lead time for vacation rentals in Annandale is 29 days.
- Guests book furthest in advance for stays during June (average 46 days), likely coinciding with peak travel demand or local events.
- The shortest booking windows occur for stays in January (average 18 days), indicating more last-minute travel plans during this time.
- Seasonally, Summer (40 days avg.) sees the longest lead times, while Winter (24 days avg.) has the shortest, reflecting typical travel planning cycles.
Recommendations for Hosts
- Use the overall average lead time (29 days) as a baseline for your pricing and availability strategy in Annandale.
- For June stays, consider implementing length-of-stay discounts or slightly higher rates for bookings made less than 46 days out to capitalize on advance planning.
- Target marketing efforts for the Summer season well in advance (at least 40 days) to capture early planners.
- Monitor your own booking lead times against these Annandale averages to identify opportunities for dynamic pricing adjustments.
Popular & Essential Airbnb Amenities in Annandale (2026)
Amenity Prevalence
Amenity Insights for Annandale
- Essential amenities in Annandale that guests expect include: Air conditioning, Wifi, Smoke alarm, Heating. Lacking these (any) could significantly impact bookings.
- Popular amenities like Hot water, Free parking on premises, TV are common but not universal. Offering these can provide a competitive edge.
Recommendations for Hosts
- Ensure your listing includes all essential amenities for Annandale: Air conditioning, Wifi, Smoke alarm, Heating.
- Prioritize adding missing essentials: Heating.
- Consider adding popular differentiators like Hot water or Free parking on premises to increase appeal.
- Highlight unique or less common amenities you offer (e.g., hot tub, dedicated workspace, EV charger) in your listing description and photos.
- Regularly check competitor amenities in Annandale to stay competitive.
Annandale Airbnb Guest Demographics & Profile Analysis (2026)
Guest Profile Summary for Annandale
- The typical guest profile for Airbnb in Annandale consists of primarily domestic travelers (91%), often arriving from nearby New York, typically belonging to the Post-2000s (Gen Z/Alpha) group (50%), primarily speaking English or Spanish.
- Domestic travelers account for 91.2% of guests.
- Key international markets include United States (91.2%) and South Korea (1.5%).
- Top languages spoken are English (65.3%) followed by Spanish (14.4%).
- A significant demographic segment is the Post-2000s (Gen Z/Alpha) group, representing 50% of guests.
Recommendations for Hosts
- Target domestic marketing efforts towards travelers from New York and Fairfax.
- Tailor amenities and listing descriptions to appeal to the dominant Post-2000s (Gen Z/Alpha) demographic (e.g., highlight fast WiFi, smart home features, local guides).
- Highlight unique local experiences or amenities relevant to the primary guest profile.
- Consider seasonal promotions aligned with peak travel times for key origin markets.
Nearby Short-Term Rental Market Comparison
How does the Annandale Airbnb market stack up against its neighbors? Compare key performance metrics like average monthly revenue, ADR, and occupancy rates in surrounding areas to understand the broader regional STR landscape.
| Market | Active Properties | Monthly Revenue | Daily Rate | Avg. Occupancy |
|---|---|---|---|---|
| Centreville | 17 | $6,298 | $565.66 | 45% |
| McGaheysville | 83 | $6,156 | $431.72 | 45% |
| Mayo | 13 | $5,915 | $447.58 | 51% |
| Shannondale | 45 | $5,808 | $337.30 | 54% |
| Stevensville | 80 | $5,412 | $556.79 | 41% |
| Bentonville | 23 | $5,372 | $420.82 | 51% |
| Nellysford | 62 | $5,276 | $426.33 | 39% |
| Weems | 11 | $5,077 | $417.22 | 47% |
| Lower Windsor Township | 14 | $5,062 | $428.71 | 45% |
| Arundel on the Bay | 29 | $5,043 | $486.96 | 40% |