Westmore Airbnb Market Analysis 2026: Short Term Rental Data & Vacation Rental Statistics in Vermont, United States
Is Airbnb profitable in Westmore in 2026? Explore comprehensive Airbnb analytics for Westmore, Vermont, United States to uncover income potential. This 2026 STR market report for Westmore, based on AirROI data from February 2025 to January 2026, reveals key trends in the niche market of 47 active listings.
Whether you're considering an Airbnb investment in Westmore, optimizing your existing vacation rental, or exploring rental arbitrage opportunities, understanding the Westmore Airbnb data is crucial. Leveraging the low regulation environment is key to maximizing your short term rental income potential. Let's dive into the specifics.
Key Westmore Airbnb Performance Metrics Overview
Monthly Airbnb Revenue Variations & Income Potential in Westmore (2026)
Understanding the monthly revenue variations for Airbnb listings in Westmore is key to maximizing your short term rental income potential. Seasonality significantly impacts earnings. Our analysis, based on data from the past 12 months, shows that the peak revenue month for STRs in Westmore is typically July, while April often presents the lowest earnings, highlighting opportunities for strategic pricing adjustments during shoulder and low seasons. Explore the typical Airbnb income in Westmore across different performance tiers:
- Best-in-class properties (Top 10%) achieve $7,267+ monthly, often utilizing dynamic pricing and superior guest experiences.
- Strong performing properties (Top 25%) earn $4,732 or more, indicating effective management and desirable locations/amenities.
- Typical properties (Median) generate around $2,422 per month, representing the average market performance.
- Entry-level properties (Bottom 25%) see earnings around $1,262, often with potential for optimization.
Average Monthly Airbnb Earnings Trend in Westmore
Westmore Airbnb Occupancy Rate Trends (2026)
Maximize your bookings by understanding the Westmore STR occupancy trends. Seasonal demand shifts significantly influence how often properties are booked. Typically, Julysees the highest demand (peak season occupancy), while January experiences the lowest (low season). Effective strategies, like adjusting minimum stays or offering promotions, can boost occupancy during slower periods. Here's how different property tiers perform in Westmore:
- Best-in-class properties (Top 10%) achieve 70%+ occupancy, indicating high desirability and potentially optimized availability.
- Strong performing properties (Top 25%) maintain 51% or higher occupancy, suggesting good market fit and guest satisfaction.
- Typical properties (Median) have an occupancy rate around 31%.
- Entry-level properties (Bottom 25%) average 18% occupancy, potentially facing higher vacancy.
Average Monthly Occupancy Rate Trend in Westmore
Average Daily Rate (ADR) Airbnb Trends in Westmore (2026)
Effective short term rental pricing strategy in Westmore involves understanding monthly ADR fluctuations. The Average Daily Rate (ADR) for Airbnb in Westmore typically peaks in October and dips lowest during April. Leveraging Airbnb dynamic pricing tools or strategies based on this seasonality can significantly boost revenue. Here's a look at the typical nightly rates achieved:
- Best-in-class properties (Top 10%) command rates of $473+ per night, often due to premium features or locations.
- Strong performing properties (Top 25%) achieve nightly rates of $348 or more.
- Typical properties (Median) charge around $219 per night.
- Entry-level properties (Bottom 25%) earn around $162 per night.
Average Daily Rate (ADR) Trend by Month in Westmore
Get Live Westmore Market Intelligence 👇

Explore Real-time Analytics
Airbnb Seasonality Analysis & Trends in Westmore (2026)
Peak Season (July, August, October)
- Revenue averages $5,287 per month
- Occupancy rates average 54.6%
- Daily rates average $283
Shoulder Season
- Revenue averages $2,937 per month
- Occupancy maintains around 31.8%
- Daily rates hold near $278
Low Season (April, May, December)
- Revenue drops to average $2,148 per month
- Occupancy decreases to average 26.6%
- Daily rates adjust to average $272
Seasonality Insights for Westmore
- The Airbnb seasonality in Westmore shows highly seasonal trends requiring careful strategy. While the sections above show seasonal averages, it's also insightful to look at the extremes:
- During the high season, the absolute peak month showcases Westmore's highest earning potential, with monthly revenues capable of climbing to $6,046, occupancy reaching a high of 61.4%, and ADRs peaking at $296.
- Conversely, the slowest single month of the year, typically falling within the low season, marks the market's lowest point. In this month, revenue might dip to $1,979, occupancy could drop to 21.1%, and ADRs may adjust down to $257.
- Understanding both the seasonal averages and these monthly peaks and troughs in revenue, occupancy, and ADR is crucial for maximizing your Airbnb profit potential in Westmore.
Seasonal Strategies for Maximizing Profit
- Peak Season: Maximize revenue through premium pricing and potentially longer minimum stays. Ensure high availability.
- Low Season: Offer competitive pricing, special promotions (e.g., extended stay discounts), and flexible cancellation policies. Target off-season travelers like remote workers or budget-conscious guests.
- Shoulder Seasons: Implement dynamic pricing that balances peak and low rates. Target weekend travelers or specific events. Offer slightly more flexible terms than peak season.
- Regularly analyze your own performance against these Westmore seasonality benchmarks and adjust your pricing and availability strategy accordingly.
Best Areas for Airbnb Investment in Westmore (2026)
Exploring the top neighborhoods for short-term rentals in Westmore? This section highlights key areas, outlining why they are attractive for hosts and guests, along with notable local attractions. Consider these locations based on your target guest profile and investment strategy.
| Neighborhood / Area | Why Host Here? (Target Guests & Appeal) | Key Attractions & Landmarks |
|---|---|---|
| Stowe | Popular ski resort area known for its picturesque scenery and outdoor activities year-round. Attractive to tourists seeking both winter sports and summer hiking. | Stowe Mountain Resort, Smugglers' Notch, Trapp Family Lodge, Stowe Recreation Path, Cabbot Creamery |
| Lake Memphremagog | A beautiful wildlife area that offers a peaceful retreat with opportunities for water sports and fishing. Draws visitors looking for a serene getaway. | Lake Memphremagog, Newport City Marina, Memphremagog Ski & Snowboard, Trestle View Park, Old Stone House Museum |
| Lyndon | Quaint town with a rich history and close proximity to the Kingdom Trails and Burke Mountain, attracting outdoor enthusiasts year-round. | Kingdom Trails, Burke Mountain, Lyndon State College, Lyndon Village, Fairbanks Museum |
| Montpelier | The capital city of Vermont, known for its historic buildings and vibrant local culture. Appeals to those interested in politics, history, and local arts. | Vermont State House, Kismet Movie Theater, Montpelier Historical Society, Lost Nation Theater, Hubbard Park |
| Barre | A city known for its granite industry and vibrant arts scene. Attracts visitors interested in history and the local arts community. | Hope Cemetery, Barre Opera House, Vermont Granite Museum, Millstone Hill Touring Center, Sunset Lake |
| Berlin | Conveniently located near Montpelier, Berlin offers shopping and dining options, suitable for business travelers and tourists alike. | Montpelier Village, Berlin Mall, Cedar Creek Room, New England Culinary Institute, Central Vermont Medical Center |
| Woodstock | Charming small town known for its scenic views and covered bridges. Popular with tourists for its historic charm and outdoor activities. | Billings Farm & Museum, Marsh-Billings-Rockefeller National Historical Park, Woodstock Village, Hang Gliding at Killington, Woodstock Inn & Resort |
| South Burlington | A vibrant city with easy access to Lake Champlain and numerous recreational activities. Attractive for families and outdoor enthusiasts. | Red Rocks Park, Lakeside Park, Barker Park, University Mall, Oakledge Park |
Understanding Airbnb License Requirements & STR Laws in Westmore (2026)
While Westmore, Vermont, United States currently shows low STR regulations, specific Airbnb license requirements might still exist or change. Always verify the latest short term rental regulations and Airbnb license requirements directly with local government authorities for Westmore to ensure full compliance before hosting.
(Source: AirROI data, 2026, based on 9% licensed listings)
Top Performing Airbnb Properties in Westmore (2026)
Benchmark your potential! Explore examples of top-performing Airbnb properties in Westmorebased on Trailing Twelve Month (TTM) revenue. Analyze their characteristics, revenue, occupancy rate, and ADR to understand what drives success in this market.
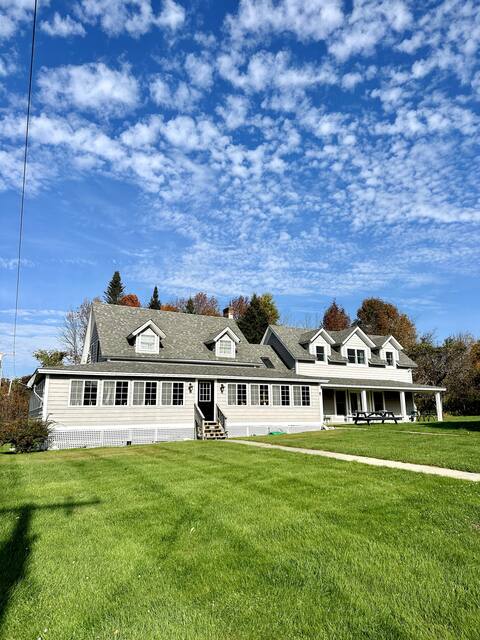
Green Acres Cabins - The Lake House!
Entire Place • 4 bedrooms
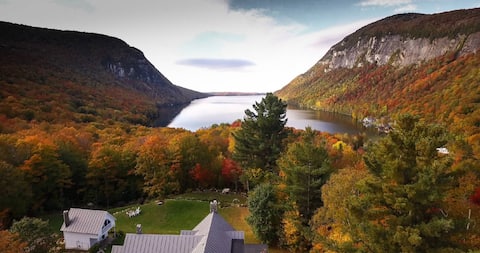
The Notch House, Willoughby Lake VT
Entire Place • 8 bedrooms
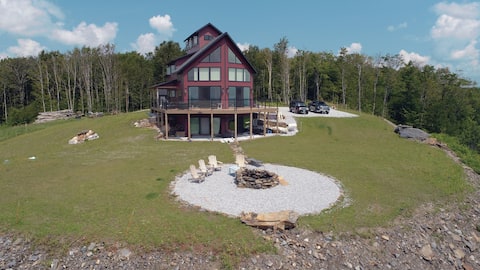
Top Of The World
Entire Place • 4 bedrooms

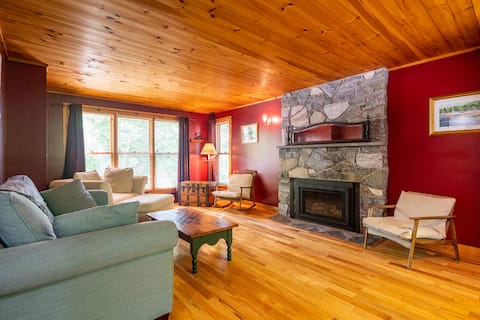
HGTV Cabin Lake Willoughby/Burke/Jaypeak EV Chrgr
Entire Place • 4 bedrooms
4bd 3bth house near Burke Mtn @ Lake Willoughby
Entire Place • 4 bedrooms

Nod Away on Lake Willoughby
Entire Place • 3 bedrooms
Note: Performance varies based on location, size, amenities, seasonality, and management quality. Data reflects the past 12 months.
Top Performing Airbnb Hosts in Westmore (2026)
Learn from the best! This table showcases top-performing Airbnb hosts in Westmore based on the number of properties managed and estimated total revenue over the past year. Analyze their scale and performance metrics.
| Host Name | Properties | Grossing Revenue | Stay Reviews | Avg Rating |
|---|---|---|---|---|
| Matt | 5 | $179,081 | 76 | 4.87/5.0 |
| Patricia A | 6 | $158,704 | 281 | 4.91/5.0 |
| Jamie | 1 | $82,613 | 9 | 5.00/5.0 |
| Rowena | 1 | $71,353 | 123 | 4.93/5.0 |
| Joe | 1 | $59,835 | 32 | 4.84/5.0 |
| Tim | 1 | $57,441 | 45 | 4.91/5.0 |
| Claudia | 1 | $56,829 | 10 | 4.80/5.0 |
| Alexandria | 1 | $51,030 | 10 | 4.90/5.0 |
| Joshua | 1 | $44,587 | 3 | 5.00/5.0 |
| Marlana | 1 | $41,322 | 25 | 4.92/5.0 |
Analyzing the strategies of top hosts, such as their property selection, pricing, and guest communication, can offer valuable lessons for optimizing your own Airbnb operations in Westmore.
Dive Deeper: Advanced Westmore STR Market Data (2026)
Ready to unlock more insights? AirROI provides access to advanced metrics and comprehensive Airbnb data for Westmore. Explore detailed analytics beyond this report to refine your investment strategy, optimize pricing, and maximize your vacation rental profits.
Explore Advanced MetricsWestmore Short-Term Rental Market Composition (2026): Property & Room Types
Room Type Distribution
Property Type Distribution
Market Composition Insights for Westmore
- The Westmore Airbnb market composition is heavily skewed towards Entire Home/Apt listings, which make up 93.6% of the 47 active rentals. This indicates strong guest preference for privacy and space.
- Looking at the property type distribution in Westmore, House properties are the most common (63.8%), reflecting the local real estate landscape.
- Houses represent a significant 63.8% portion, catering likely to families or larger groups.
- Smaller segments like others, unique stays, apartment/condo (combined 8.5%) offer potential for unique stay experiences.
Westmore Airbnb Room Capacity Analysis (2026): Bedroom Distribution
Distribution of Listings by Number of Bedrooms
Room Capacity Insights for Westmore
- The dominant room capacity in Westmore is 2 bedrooms listings, making up 34% of the market. This suggests a strong demand for properties suitable for couples or solo travelers.
- Together, 2 bedrooms and 4 bedrooms properties represent 55.3% of the active Airbnb listings in Westmore, indicating a high concentration in these sizes.
- A significant 40.4% of listings offer 3+ bedrooms, catering to larger groups and families seeking more space in Westmore.
Westmore Vacation Rental Guest Capacity Trends (2026)
Distribution of Listings by Guest Capacity
Guest Capacity Insights for Westmore
- The most common guest capacity trend in Westmore vacation rentals is listings accommodating 8+ guests (27.7%). This suggests the primary traveler segment is likely larger groups.
- Properties designed for 8+ guests and 4 guests dominate the Westmore STR market, accounting for 49.0% of listings.
- 48.9% of properties accommodate 6+ guests, serving the market segment for larger families or group travel in Westmore.
- On average, properties in Westmore are equipped to host 5.0 guests.
Westmore Airbnb Booking Patterns (2026): Available vs. Booked Days
Available Days Distribution
Booked Days Distribution
Booking Pattern Insights for Westmore
- The most common availability pattern in Westmore falls within the 271-366 days range, representing 59.6% of listings. This suggests many properties have significant open periods on their calendars.
- Approximately 93.6% of listings show high availability (181+ days open annually), indicating potential for increased bookings or specific owner usage patterns.
- For booked days, the 31-90 days range is most frequent in Westmore (46.8%), reflecting common guest stay durations or potential owner blocking patterns.
- A notable 8.5% of properties secure long booking periods (181+ days booked per year), highlighting successful long-term rental strategies or significant owner usage.
Westmore Airbnb Minimum Stay Requirements Analysis
Distribution of Listings by Minimum Night Requirement
1 Night
3 listings
6.4% of total
2 Nights
16 listings
34% of total
3 Nights
10 listings
21.3% of total
4-6 Nights
3 listings
6.4% of total
30+ Nights
15 listings
31.9% of total
Key Insights
- The most prevalent minimum stay requirement in Westmore is 2 Nights, adopted by 34% of listings. This highlights the market's preference for shorter, flexible bookings.
- A significant segment (31.9%) caters to monthly stays (30+ nights) in Westmore, pointing to opportunities in the extended-stay market.
Recommendations
- Align with the market by considering a 2 Nights minimum stay, as 34% of Westmore hosts use this setting.
- If feasible, allowing 1-night stays, especially midweek or during low season, could capture last-minute bookings, as only 6.4% currently do.
- A 2-night minimum appears standard (34%). Consider this for weekends or peak periods.
- Explore offering discounts for stays of 30+ nights to attract the 31.9% of the market seeking extended stays.
- Adjust minimum nights based on seasonality – potentially shorter during low season and longer during peak demand periods in Westmore.
Westmore Airbnb Cancellation Policy Trends Analysis (2026)
Flexible
3 listings
6.4% of total
Moderate
8 listings
17% of total
Firm
23 listings
48.9% of total
Strict
13 listings
27.7% of total
Cancellation Policy Insights for Westmore
- The prevailing Airbnb cancellation policy trend in Westmore is Firm, used by 48.9% of listings.
- A majority (76.6%) of hosts in Westmore utilize Firm or Strict policies, indicating a market where hosts prioritize booking security.
Recommendations for Hosts
- Consider adopting a Firm policy to align with the 48.9% market standard in Westmore.
- Regularly review your cancellation policy against competitors and market demand shifts in Westmore.
Westmore STR Booking Lead Time Analysis (2026)
Average Booking Lead Time by Month
Booking Lead Time Insights for Westmore
- The overall average booking lead time for vacation rentals in Westmore is 76 days.
- Guests book furthest in advance for stays during June (average 97 days), likely coinciding with peak travel demand or local events.
- The shortest booking windows occur for stays in January (average 21 days), indicating more last-minute travel plans during this time.
- Seasonally, Summer (96 days avg.) sees the longest lead times, while Winter (28 days avg.) has the shortest, reflecting typical travel planning cycles.
Recommendations for Hosts
- Use the overall average lead time (76 days) as a baseline for your pricing and availability strategy in Westmore.
- For June stays, consider implementing length-of-stay discounts or slightly higher rates for bookings made less than 97 days out to capitalize on advance planning.
- Target marketing efforts for the Summer season well in advance (at least 96 days) to capture early planners.
- Monitor your own booking lead times against these Westmore averages to identify opportunities for dynamic pricing adjustments.
Popular & Essential Airbnb Amenities in Westmore (2026)
Amenity Prevalence
Amenity Insights for Westmore
- Essential amenities in Westmore that guests expect include: Free parking on premises, Smoke alarm. Lacking these (any) could significantly impact bookings.
- Popular amenities like Wifi, Carbon monoxide alarm, Heating are common but not universal. Offering these can provide a competitive edge.
- Warning: Wifi is not universally provided but is considered essential globally. Ensure reliable Wifi is offered.
Recommendations for Hosts
- Ensure your listing includes all essential amenities for Westmore: Free parking on premises, Smoke alarm.
- Prioritize adding missing essentials: Smoke alarm.
- Consider adding popular differentiators like Wifi or Carbon monoxide alarm to increase appeal.
- Highlight unique or less common amenities you offer (e.g., hot tub, dedicated workspace, EV charger) in your listing description and photos.
- Regularly check competitor amenities in Westmore to stay competitive.
Westmore Airbnb Guest Demographics & Profile Analysis (2026)
Guest Profile Summary for Westmore
- The typical guest profile for Airbnb in Westmore consists of primarily domestic travelers (96%), often arriving from nearby Boston, typically belonging to the Post-2000s (Gen Z/Alpha) group (50%), primarily speaking English or Spanish.
- Domestic travelers account for 96.1% of guests.
- Key international markets include United States (96.1%) and Canada (2.2%).
- Top languages spoken are English (71.2%) followed by Spanish (10.6%).
- A significant demographic segment is the Post-2000s (Gen Z/Alpha) group, representing 50% of guests.
Recommendations for Hosts
- Target domestic marketing efforts towards travelers from Boston and Burlington.
- Tailor amenities and listing descriptions to appeal to the dominant Post-2000s (Gen Z/Alpha) demographic (e.g., highlight fast WiFi, smart home features, local guides).
- Highlight unique local experiences or amenities relevant to the primary guest profile.
- Consider seasonal promotions aligned with peak travel times for key origin markets.
Nearby Short-Term Rental Market Comparison
How does the Westmore Airbnb market stack up against its neighbors? Compare key performance metrics like average monthly revenue, ADR, and occupancy rates in surrounding areas to understand the broader regional STR landscape.
| Market | Active Properties | Monthly Revenue | Daily Rate | Avg. Occupancy |
|---|---|---|---|---|
| Middletown Springs | 13 | $6,843 | $507.55 | 32% |
| Pomfret | 15 | $6,549 | $502.74 | 45% |
| Fort Ann | 35 | $6,238 | $790.41 | 37% |
| Hanover | 33 | $5,826 | $1189.51 | 41% |
| Barnstead | 36 | $5,090 | $477.12 | 42% |
| Goffstown | 13 | $5,066 | $343.72 | 53% |
| Malletts Bay | 51 | $4,842 | $444.86 | 41% |
| Town of Wilton | 103 | $4,841 | $862.83 | 38% |
| Jefferson | 28 | $4,793 | $474.72 | 40% |
| Wilmot | 11 | $4,667 | $334.67 | 51% |