Westfield Airbnb Market Analysis 2026: Short Term Rental Data & Vacation Rental Statistics in Vermont, United States
Is Airbnb profitable in Westfield in 2026? Explore comprehensive Airbnb analytics for Westfield, Vermont, United States to uncover income potential. This 2026 STR market report for Westfield, based on AirROI data from February 2025 to January 2026, reveals key trends in the niche market of 33 active listings.
Whether you're considering an Airbnb investment in Westfield, optimizing your existing vacation rental, or exploring rental arbitrage opportunities, understanding the Westfield Airbnb data is crucial. Leveraging the low regulation environment is key to maximizing your short term rental income potential. Let's dive into the specifics.
Key Westfield Airbnb Performance Metrics Overview
Monthly Airbnb Revenue Variations & Income Potential in Westfield (2026)
Understanding the monthly revenue variations for Airbnb listings in Westfield is key to maximizing your short term rental income potential. Seasonality significantly impacts earnings. Our analysis, based on data from the past 12 months, shows that the peak revenue month for STRs in Westfield is typically January, while May often presents the lowest earnings, highlighting opportunities for strategic pricing adjustments during shoulder and low seasons. Explore the typical Airbnb income in Westfield across different performance tiers:
- Best-in-class properties (Top 10%) achieve $6,719+ monthly, often utilizing dynamic pricing and superior guest experiences.
- Strong performing properties (Top 25%) earn $4,691 or more, indicating effective management and desirable locations/amenities.
- Typical properties (Median) generate around $2,758 per month, representing the average market performance.
- Entry-level properties (Bottom 25%) see earnings around $1,430, often with potential for optimization.
Average Monthly Airbnb Earnings Trend in Westfield
Westfield Airbnb Occupancy Rate Trends (2026)
Maximize your bookings by understanding the Westfield STR occupancy trends. Seasonal demand shifts significantly influence how often properties are booked. Typically, Februarysees the highest demand (peak season occupancy), while September experiences the lowest (low season). Effective strategies, like adjusting minimum stays or offering promotions, can boost occupancy during slower periods. Here's how different property tiers perform in Westfield:
- Best-in-class properties (Top 10%) achieve 68%+ occupancy, indicating high desirability and potentially optimized availability.
- Strong performing properties (Top 25%) maintain 54% or higher occupancy, suggesting good market fit and guest satisfaction.
- Typical properties (Median) have an occupancy rate around 37%.
- Entry-level properties (Bottom 25%) average 17% occupancy, potentially facing higher vacancy.
Average Monthly Occupancy Rate Trend in Westfield
Average Daily Rate (ADR) Airbnb Trends in Westfield (2026)
Effective short term rental pricing strategy in Westfield involves understanding monthly ADR fluctuations. The Average Daily Rate (ADR) for Airbnb in Westfield typically peaks in January and dips lowest during May. Leveraging Airbnb dynamic pricing tools or strategies based on this seasonality can significantly boost revenue. Here's a look at the typical nightly rates achieved:
- Best-in-class properties (Top 10%) command rates of $504+ per night, often due to premium features or locations.
- Strong performing properties (Top 25%) achieve nightly rates of $365 or more.
- Typical properties (Median) charge around $280 per night.
- Entry-level properties (Bottom 25%) earn around $191 per night.
Average Daily Rate (ADR) Trend by Month in Westfield
Get Live Westfield Market Intelligence 👇

Explore Real-time Analytics
Airbnb Seasonality Analysis & Trends in Westfield (2026)
Peak Season (January, February, March)
- Revenue averages $5,289 per month
- Occupancy rates average 56.7%
- Daily rates average $319
Shoulder Season
- Revenue averages $3,152 per month
- Occupancy maintains around 34.0%
- Daily rates hold near $297
Low Season (May, June, September)
- Revenue drops to average $2,053 per month
- Occupancy decreases to average 26.2%
- Daily rates adjust to average $277
Seasonality Insights for Westfield
- The Airbnb seasonality in Westfield shows highly seasonal trends requiring careful strategy. While the sections above show seasonal averages, it's also insightful to look at the extremes:
- During the high season, the absolute peak month showcases Westfield's highest earning potential, with monthly revenues capable of climbing to $5,951, occupancy reaching a high of 60.9%, and ADRs peaking at $352.
- Conversely, the slowest single month of the year, typically falling within the low season, marks the market's lowest point. In this month, revenue might dip to $1,848, occupancy could drop to 24.3%, and ADRs may adjust down to $262.
- Understanding both the seasonal averages and these monthly peaks and troughs in revenue, occupancy, and ADR is crucial for maximizing your Airbnb profit potential in Westfield.
Seasonal Strategies for Maximizing Profit
- Peak Season: Maximize revenue through premium pricing and potentially longer minimum stays. Ensure high availability.
- Low Season: Offer competitive pricing, special promotions (e.g., extended stay discounts), and flexible cancellation policies. Target off-season travelers like remote workers or budget-conscious guests.
- Shoulder Seasons: Implement dynamic pricing that balances peak and low rates. Target weekend travelers or specific events. Offer slightly more flexible terms than peak season.
- Regularly analyze your own performance against these Westfield seasonality benchmarks and adjust your pricing and availability strategy accordingly.
Best Areas for Airbnb Investment in Westfield (2026)
Exploring the top neighborhoods for short-term rentals in Westfield? This section highlights key areas, outlining why they are attractive for hosts and guests, along with notable local attractions. Consider these locations based on your target guest profile and investment strategy.
| Neighborhood / Area | Why Host Here? (Target Guests & Appeal) | Key Attractions & Landmarks |
|---|---|---|
| Stowe | Renowned for its skiing and charm, Stowe attracts adventure seekers and families looking for a quintessential New England experience. It's a year-round destination with winter sports, summer hikes, and a picturesque village atmosphere. | Stowe Mountain Resort, Smugglers Notch State Park, Stowe Recreation Path, Ben & Jerry's Factory, Cold Hollow Cider Mill, Stowe Village |
| Killington | Home to the largest ski area in the Eastern U.S., Killington is a haven for winter sports enthusiasts. With a variety of lodging options and a lively après-ski scene, it’s perfect for those looking to experience the great outdoors. | Killington Ski Resort, Pico Mountain, Killington Golf Course, Thundering Falls Trail, Killington Adventure Center |
| Winooski | A vibrant town with a growing arts and culinary scene, Winooski offers a mix of old-world charm and modern amenities. It attracts young professionals and visitors who enjoy local dining and shopping experiences. | Winooski Falls, O'Brien Community Center, The Champlain Mill, Local restaurants and breweries |
| Burlington | As a cultural hub in Vermont, Burlington offers vibrant nightlife, arts, and ample outdoor activities. Its scenic waterfront and lively downtown make it an appealing spot for travelers of all kinds. | Church Street Marketplace, Waterfront Park, Burlington Bike Path, ECHO, Leahy Center for Lake Champlain, Frog Hollow Vermont State Craft Center |
| Montpelier | The charming capital city of Vermont, Montpelier is known for its historic downtown, vibrant community events, and access to nature. It attracts visitors interested in local history and government activities. | Vermont State House, Capital City Farmers Market, Turtle Head Park, Lost Nation Brewing, Montpelier Civic Center |
| Middlebury | Home to Middlebury College, this town is filled with cultural experiences and beautiful scenery. It attracts visitors seeking education, history, and picturesque landscapes. | Middlebury College, Otter Creek Brewing, Henry Sheldon Museum, Middlebury Greenway |
| Brattleboro | Known for its artsy vibe and historic downtown, Brattleboro attracts a diverse crowd interested in arts, music, and local culture. It's particularly popular for weekend getaways. | Brattleboro Museum & Art Center, The Latchis Theatre, Harris Hill Ski Jump, Eat by Chloe, Local artisan shops |
| Woodstock | A quintessential New England town with beautiful architecture and rich history, Woodstock is a popular tourist destination for those seeking a relaxing escape in the heart of Vermont. | Billings Farm & Museum, Woodstock History Center, Marsh-Billings-Rockefeller National Historical Park, Quechee Gorge, Local boutiques and cafes |
Understanding Airbnb License Requirements & STR Laws in Westfield (2026)
While Westfield, Vermont, United States currently shows low STR regulations, specific Airbnb license requirements might still exist or change. Always verify the latest short term rental regulations and Airbnb license requirements directly with local government authorities for Westfield to ensure full compliance before hosting.
(Source: AirROI data, 2026, based on 3% licensed listings)
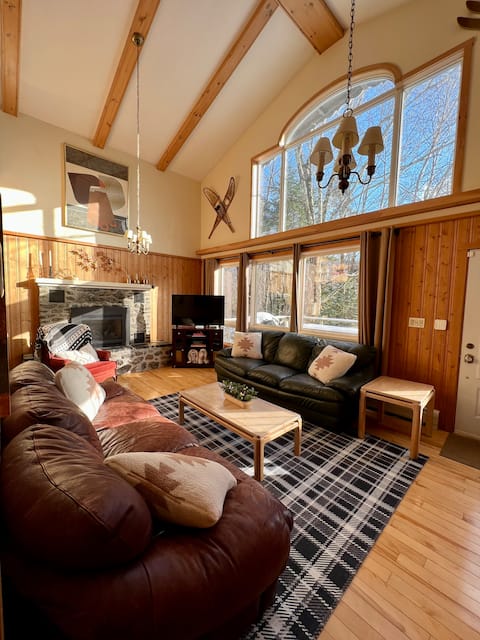
Top Performing Airbnb Properties in Westfield (2026)
Benchmark your potential! Explore examples of top-performing Airbnb properties in Westfieldbased on Trailing Twelve Month (TTM) revenue. Analyze their characteristics, revenue, occupancy rate, and ADR to understand what drives success in this market.
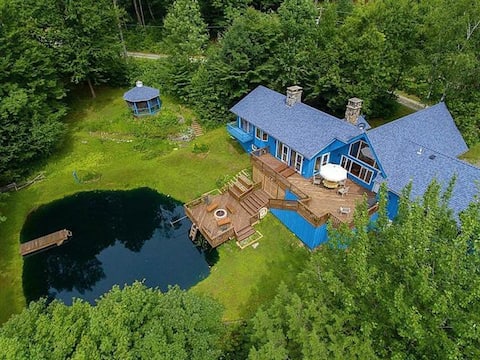
The Blue Mountain Lodge, 6 bedroom, 4 bathrooms...
Entire Place • 6 bedrooms
Cozy Chalet at Jay Peak
Entire Place • 5 bedrooms

Jay Peak 3 miles - ski home via Big Jay!
Entire Place • 2 bedrooms

Edelweiss! Ski Chalet: 5 Bed, 5 Mins to Jay Peak!
Entire Place • 5 bedrooms

North Hill Cabin - Minutes from Jay Peak!
Entire Place • 4 bedrooms

Pet-Friendly Home w/ Deck: 4 Mi to Jay Peak Resort
Entire Place • 4 bedrooms
Note: Performance varies based on location, size, amenities, seasonality, and management quality. Data reflects the past 12 months.
Top Performing Airbnb Hosts in Westfield (2026)
Learn from the best! This table showcases top-performing Airbnb hosts in Westfield based on the number of properties managed and estimated total revenue over the past year. Analyze their scale and performance metrics.
| Host Name | Properties | Grossing Revenue | Stay Reviews | Avg Rating |
|---|---|---|---|---|
| Mike | 2 | $126,032 | 160 | 4.84/5.0 |
| Danny | 3 | $120,228 | 387 | 4.92/5.0 |
| Derek | 2 | $67,150 | 282 | 4.89/5.0 |
| Rich | 1 | $65,757 | 124 | 4.96/5.0 |
| Nick | 1 | $55,242 | 44 | 4.98/5.0 |
| Teresa | 1 | $52,466 | 84 | 4.94/5.0 |
| Evolve | 1 | $46,267 | 31 | 4.90/5.0 |
| Cheryl | 1 | $45,324 | 40 | 4.98/5.0 |
| Pete | 1 | $44,273 | 5 | 4.40/5.0 |
| Daniel & Kristin | 1 | $43,330 | 64 | 4.89/5.0 |
Analyzing the strategies of top hosts, such as their property selection, pricing, and guest communication, can offer valuable lessons for optimizing your own Airbnb operations in Westfield.
Dive Deeper: Advanced Westfield STR Market Data (2026)
Ready to unlock more insights? AirROI provides access to advanced metrics and comprehensive Airbnb data for Westfield. Explore detailed analytics beyond this report to refine your investment strategy, optimize pricing, and maximize your vacation rental profits.
Explore Advanced MetricsWestfield Short-Term Rental Market Composition (2026): Property & Room Types
Room Type Distribution
Property Type Distribution
Market Composition Insights for Westfield
- The Westfield Airbnb market composition is heavily skewed towards Entire Home/Apt listings, which make up 84.8% of the 33 active rentals. This indicates strong guest preference for privacy and space.
- Looking at the property type distribution in Westfield, House properties are the most common (51.5%), reflecting the local real estate landscape.
- Houses represent a significant 51.5% portion, catering likely to families or larger groups.
- The presence of 15.2% Hotel/Boutique listings indicates integration with traditional hospitality.
- Smaller segments like unique stays (combined 3.0%) offer potential for unique stay experiences.
Westfield Airbnb Room Capacity Analysis (2026): Bedroom Distribution
Distribution of Listings by Number of Bedrooms
Room Capacity Insights for Westfield
- The dominant room capacity in Westfield is 4 bedrooms listings, making up 27.3% of the market. This suggests a strong demand for properties suitable for families or small groups.
- Together, 4 bedrooms and 2 bedrooms properties represent 45.5% of the active Airbnb listings in Westfield, indicating a high concentration in these sizes.
- A significant 54.6% of listings offer 3+ bedrooms, catering to larger groups and families seeking more space in Westfield.
Westfield Vacation Rental Guest Capacity Trends (2026)
Distribution of Listings by Guest Capacity
Guest Capacity Insights for Westfield
- The most common guest capacity trend in Westfield vacation rentals is listings accommodating 8+ guests (57.6%). This suggests the primary traveler segment is likely larger groups.
- Properties designed for 8+ guests and 4 guests dominate the Westfield STR market, accounting for 72.8% of listings.
- 63.6% of properties accommodate 6+ guests, serving the market segment for larger families or group travel in Westfield.
- On average, properties in Westfield are equipped to host 5.8 guests.
Westfield Airbnb Booking Patterns (2026): Available vs. Booked Days
Available Days Distribution
Booked Days Distribution
Booking Pattern Insights for Westfield
- The most common availability pattern in Westfield falls within the 181-270 days range, representing 48.5% of listings. This suggests many properties have significant open periods on their calendars.
- Approximately 87.9% of listings show high availability (181+ days open annually), indicating potential for increased bookings or specific owner usage patterns.
- For booked days, the 91-180 days range is most frequent in Westfield (45.5%), reflecting common guest stay durations or potential owner blocking patterns.
- A notable 15.2% of properties secure long booking periods (181+ days booked per year), highlighting successful long-term rental strategies or significant owner usage.
Westfield Airbnb Minimum Stay Requirements Analysis
Distribution of Listings by Minimum Night Requirement
1 Night
8 listings
24.2% of total
2 Nights
5 listings
15.2% of total
3 Nights
7 listings
21.2% of total
30+ Nights
13 listings
39.4% of total
Key Insights
- The most prevalent minimum stay requirement in Westfield is 30+ Nights, adopted by 39.4% of listings. This highlights the market's preference for longer commitments.
- A significant segment (39.4%) caters to monthly stays (30+ nights) in Westfield, pointing to opportunities in the extended-stay market.
Recommendations
- Align with the market by considering a 30+ Nights minimum stay, as 39.4% of Westfield hosts use this setting.
- If feasible, allowing 1-night stays, especially midweek or during low season, could capture last-minute bookings, as only 24.2% currently do.
- Explore offering discounts for stays of 30+ nights to attract the 39.4% of the market seeking extended stays.
- Adjust minimum nights based on seasonality – potentially shorter during low season and longer during peak demand periods in Westfield.
Westfield Airbnb Cancellation Policy Trends Analysis (2026)
Limited
3 listings
9.1% of total
Flexible
7 listings
21.2% of total
Moderate
4 listings
12.1% of total
Firm
15 listings
45.5% of total
Strict
4 listings
12.1% of total
Cancellation Policy Insights for Westfield
- The prevailing Airbnb cancellation policy trend in Westfield is Firm, used by 45.5% of listings.
- A majority (57.6%) of hosts in Westfield utilize Firm or Strict policies, indicating a market where hosts prioritize booking security.
Recommendations for Hosts
- Consider adopting a Firm policy to align with the 45.5% market standard in Westfield.
- Using a Strict policy might deter some guests, as only 12.1% of listings use it. Evaluate if potential revenue protection outweighs possible lower booking rates.
- Regularly review your cancellation policy against competitors and market demand shifts in Westfield.
Westfield STR Booking Lead Time Analysis (2026)
Average Booking Lead Time by Month
Booking Lead Time Insights for Westfield
- The overall average booking lead time for vacation rentals in Westfield is 54 days.
- Guests book furthest in advance for stays during February (average 70 days), likely coinciding with peak travel demand or local events.
- The shortest booking windows occur for stays in May (average 25 days), indicating more last-minute travel plans during this time.
- Seasonally, Winter (64 days avg.) sees the longest lead times, while Spring (44 days avg.) has the shortest, reflecting typical travel planning cycles.
Recommendations for Hosts
- Use the overall average lead time (54 days) as a baseline for your pricing and availability strategy in Westfield.
- For February stays, consider implementing length-of-stay discounts or slightly higher rates for bookings made less than 70 days out to capitalize on advance planning.
- Target marketing efforts for the Winter season well in advance (at least 64 days) to capture early planners.
- Monitor your own booking lead times against these Westfield averages to identify opportunities for dynamic pricing adjustments.
Popular & Essential Airbnb Amenities in Westfield (2026)
Amenity Prevalence
Amenity Insights for Westfield
- Essential amenities in Westfield that guests expect include: Smoke alarm, Wifi, Hot water, Carbon monoxide alarm, Essentials, Heating. Lacking these (any) could significantly impact bookings.
- Popular amenities like Free parking on premises, Coffee maker, Bed linens are common but not universal. Offering these can provide a competitive edge.
Recommendations for Hosts
- Ensure your listing includes all essential amenities for Westfield: Smoke alarm, Wifi, Hot water, Carbon monoxide alarm, Essentials, Heating.
- Prioritize adding missing essentials: Wifi, Hot water, Carbon monoxide alarm, Essentials, Heating.
- Consider adding popular differentiators like Free parking on premises or Coffee maker to increase appeal.
- Highlight unique or less common amenities you offer (e.g., hot tub, dedicated workspace, EV charger) in your listing description and photos.
- Regularly check competitor amenities in Westfield to stay competitive.
Westfield Airbnb Guest Demographics & Profile Analysis (2026)
Guest Profile Summary for Westfield
- The typical guest profile for Airbnb in Westfield consists of primarily domestic travelers (90%), often arriving from nearby New York, typically belonging to the Post-2000s (Gen Z/Alpha) group (50%), primarily speaking English or French.
- Domestic travelers account for 90.2% of guests.
- Key international markets include United States (90.2%) and Canada (7.6%).
- Top languages spoken are English (67.7%) followed by French (8.3%).
- A significant demographic segment is the Post-2000s (Gen Z/Alpha) group, representing 50% of guests.
Recommendations for Hosts
- Target domestic marketing efforts towards travelers from New York and Boston.
- Tailor amenities and listing descriptions to appeal to the dominant Post-2000s (Gen Z/Alpha) demographic (e.g., highlight fast WiFi, smart home features, local guides).
- Highlight unique local experiences or amenities relevant to the primary guest profile.
- Consider seasonal promotions aligned with peak travel times for key origin markets.
Nearby Short-Term Rental Market Comparison
How does the Westfield Airbnb market stack up against its neighbors? Compare key performance metrics like average monthly revenue, ADR, and occupancy rates in surrounding areas to understand the broader regional STR landscape.
| Market | Active Properties | Monthly Revenue | Daily Rate | Avg. Occupancy |
|---|---|---|---|---|
| Middletown Springs | 13 | $6,843 | $507.55 | 32% |
| Pomfret | 15 | $6,549 | $502.74 | 45% |
| Fort Ann | 35 | $6,238 | $790.41 | 37% |
| Hanover | 33 | $5,826 | $1189.51 | 41% |
| Barnstead | 36 | $5,090 | $477.12 | 42% |
| Goffstown | 13 | $5,066 | $343.72 | 53% |
| Malletts Bay | 51 | $4,842 | $444.86 | 41% |
| Town of Wilton | 103 | $4,841 | $862.83 | 38% |
| Jefferson | 28 | $4,793 | $474.72 | 40% |
| Wilmot | 11 | $4,667 | $334.67 | 51% |