Wells Airbnb Market Analysis 2026: Short Term Rental Data & Vacation Rental Statistics in Vermont, United States
Is Airbnb profitable in Wells in 2026? Explore comprehensive Airbnb analytics for Wells, Vermont, United States to uncover income potential. This 2026 STR market report for Wells, based on AirROI data from February 2025 to January 2026, reveals key trends in the niche market of 21 active listings.
Whether you're considering an Airbnb investment in Wells, optimizing your existing vacation rental, or exploring rental arbitrage opportunities, understanding the Wells Airbnb data is crucial. Leveraging the low regulation environment is key to maximizing your short term rental income potential. Let's dive into the specifics.
Key Wells Airbnb Performance Metrics Overview
Monthly Airbnb Revenue Variations & Income Potential in Wells (2026)
Understanding the monthly revenue variations for Airbnb listings in Wells is key to maximizing your short term rental income potential. Seasonality significantly impacts earnings. Our analysis, based on data from the past 12 months, shows that the peak revenue month for STRs in Wells is typically August, while April often presents the lowest earnings, highlighting opportunities for strategic pricing adjustments during shoulder and low seasons. Explore the typical Airbnb income in Wells across different performance tiers:
- Best-in-class properties (Top 10%) achieve $7,873+ monthly, often utilizing dynamic pricing and superior guest experiences.
- Strong performing properties (Top 25%) earn $4,809 or more, indicating effective management and desirable locations/amenities.
- Typical properties (Median) generate around $3,174 per month, representing the average market performance.
- Entry-level properties (Bottom 25%) see earnings around $1,780, often with potential for optimization.
Average Monthly Airbnb Earnings Trend in Wells
Wells Airbnb Occupancy Rate Trends (2026)
Maximize your bookings by understanding the Wells STR occupancy trends. Seasonal demand shifts significantly influence how often properties are booked. Typically, Augustsees the highest demand (peak season occupancy), while April experiences the lowest (low season). Effective strategies, like adjusting minimum stays or offering promotions, can boost occupancy during slower periods. Here's how different property tiers perform in Wells:
- Best-in-class properties (Top 10%) achieve 80%+ occupancy, indicating high desirability and potentially optimized availability.
- Strong performing properties (Top 25%) maintain 62% or higher occupancy, suggesting good market fit and guest satisfaction.
- Typical properties (Median) have an occupancy rate around 40%.
- Entry-level properties (Bottom 25%) average 21% occupancy, potentially facing higher vacancy.
Average Monthly Occupancy Rate Trend in Wells
Average Daily Rate (ADR) Airbnb Trends in Wells (2026)
Effective short term rental pricing strategy in Wells involves understanding monthly ADR fluctuations. The Average Daily Rate (ADR) for Airbnb in Wells typically peaks in August and dips lowest during April. Leveraging Airbnb dynamic pricing tools or strategies based on this seasonality can significantly boost revenue. Here's a look at the typical nightly rates achieved:
- Best-in-class properties (Top 10%) command rates of $416+ per night, often due to premium features or locations.
- Strong performing properties (Top 25%) achieve nightly rates of $351 or more.
- Typical properties (Median) charge around $278 per night.
- Entry-level properties (Bottom 25%) earn around $153 per night.
Average Daily Rate (ADR) Trend by Month in Wells
Get Live Wells Market Intelligence 👇

Explore Real-time Analytics
Airbnb Seasonality Analysis & Trends in Wells (2026)
Peak Season (August, July, June)
- Revenue averages $5,815 per month
- Occupancy rates average 57.2%
- Daily rates average $291
Shoulder Season
- Revenue averages $3,536 per month
- Occupancy maintains around 39.5%
- Daily rates hold near $282
Low Season (April, May, November)
- Revenue drops to average $2,572 per month
- Occupancy decreases to average 36.8%
- Daily rates adjust to average $277
Seasonality Insights for Wells
- The Airbnb seasonality in Wells shows highly seasonal trends requiring careful strategy. While the sections above show seasonal averages, it's also insightful to look at the extremes:
- During the high season, the absolute peak month showcases Wells's highest earning potential, with monthly revenues capable of climbing to $6,333, occupancy reaching a high of 61.3%, and ADRs peaking at $292.
- Conversely, the slowest single month of the year, typically falling within the low season, marks the market's lowest point. In this month, revenue might dip to $1,708, occupancy could drop to 31.5%, and ADRs may adjust down to $271.
- Understanding both the seasonal averages and these monthly peaks and troughs in revenue, occupancy, and ADR is crucial for maximizing your Airbnb profit potential in Wells.
Seasonal Strategies for Maximizing Profit
- Peak Season: Maximize revenue through premium pricing and potentially longer minimum stays. Ensure high availability.
- Low Season: Offer competitive pricing, special promotions (e.g., extended stay discounts), and flexible cancellation policies. Target off-season travelers like remote workers or budget-conscious guests.
- Shoulder Seasons: Implement dynamic pricing that balances peak and low rates. Target weekend travelers or specific events. Offer slightly more flexible terms than peak season.
- Regularly analyze your own performance against these Wells seasonality benchmarks and adjust your pricing and availability strategy accordingly.
Best Areas for Airbnb Investment in Wells (2026)
Exploring the top neighborhoods for short-term rentals in Wells? This section highlights key areas, outlining why they are attractive for hosts and guests, along with notable local attractions. Consider these locations based on your target guest profile and investment strategy.
| Neighborhood / Area | Why Host Here? (Target Guests & Appeal) | Key Attractions & Landmarks |
|---|---|---|
| Wells Beach | Wells Beach is known for its beautiful sandy shores and family-friendly atmosphere, making it a prime location for tourists during the summer months. | Wells Beach, Drakes Island, Rachel Carson National Wildlife Refuge, Meadowmere Park, Wells Reserve at Laudholm |
| Kennebunkport | Just a short drive from Wells, this charming seaside town is popular with visitors looking for quaint shops, restaurants, and picturesque harbor views. | Dock Square, Goose Rocks Beach, Cape Porpoise, The Bush Family Estate, Kennebunkport Historical Society |
| Ogunquit | Famous for its stunning Marginal Way coastal walk and vibrant arts scene, Ogunquit draws many tourists seeking both relaxation and culture. | Ogunquit Beach, Marginal Way, Perkins Cove, Ogunquit Playhouse, Footbridge Beach |
| York | Known for its scenic views and historical sites, York attracts families and couples looking for a coastal getaway. | York Beach, Nubble Lighthouse, York's Wild Kingdom, Cape Neddick, Short Sands Beach |
| Portland | Maine's largest city offers a mix of urban life, dining, and waterfront activities, popular with both tourists and business travelers. | Old Port, Portland Head Light, Victoria Mansion, Casco Bay Islands, Food and drink scene |
| Bar Harbor | A gateway to Acadia National Park, Bar Harbor attracts outdoor enthusiasts and nature lovers year-round, boosting its appeal for short-term rentals. | Acadia National Park, Cadillac Mountain, Bar Harbor Whale Watch Company, Shore Path, Abbe Museum |
| Burlington | Vermont's largest city known for its vibrant arts scene and access to Lake Champlain, attracting visitors seeking a mix of urban and rural experiences. | Church Street Marketplace, Waterfront Park, Ethan Allen Park, Burlington's breweries, Shelburne Farms |
| Stowe | A year-round resort town, Stowe is known for its skiing in winter and hiking in summer, making it a popular destination for outdoor enthusiasts. | Stowe Mountain Resort, Mount Mansfield, Stowe Recreation Path, Smugglers' Notch, Trapp Family Lodge |
Understanding Airbnb License Requirements & STR Laws in Wells (2026)
While Wells, Vermont, United States currently shows low STR regulations, specific Airbnb license requirements might still exist or change. Always verify the latest short term rental regulations and Airbnb license requirements directly with local government authorities for Wells to ensure full compliance before hosting.
(Source: AirROI data, 2026, based on 10% licensed listings)
Top Performing Airbnb Properties in Wells (2026)
Benchmark your potential! Explore examples of top-performing Airbnb properties in Wellsbased on Trailing Twelve Month (TTM) revenue. Analyze their characteristics, revenue, occupancy rate, and ADR to understand what drives success in this market.
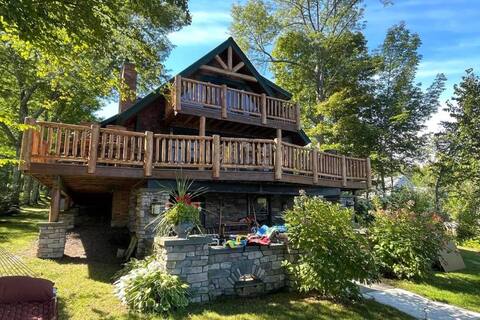
Breathtaking Lakeside Retreat!
Entire Place • 4 bedrooms

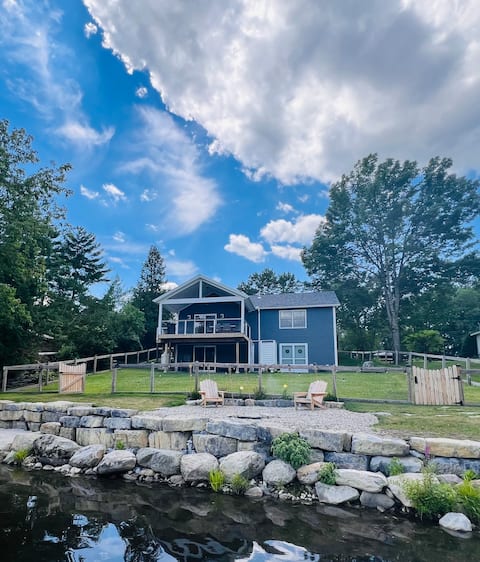
Chalet on a Hill w/ Mountain & Lake View, Hot Tub
Entire Place • 3 bedrooms
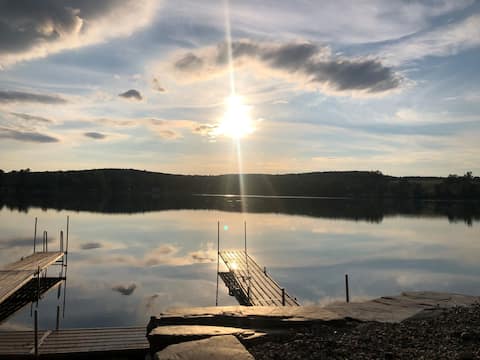
Lakefront cottage Lake Saint Catherine, VT!
Entire Place • 2 bedrooms

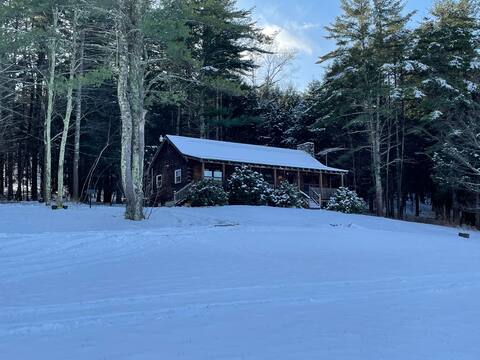
Views! Entire Chalet, FAST Wi-Fi, All 18 Acres
Entire Place • 3 bedrooms
Lakeside Cabin Retreat!
Entire Place • 1 bedroom
Rustic Retreat: Cozy Cabin in the Woods
Entire Place • 2 bedrooms
Note: Performance varies based on location, size, amenities, seasonality, and management quality. Data reflects the past 12 months.
Top Performing Airbnb Hosts in Wells (2026)
Learn from the best! This table showcases top-performing Airbnb hosts in Wells based on the number of properties managed and estimated total revenue over the past year. Analyze their scale and performance metrics.
| Host Name | Properties | Grossing Revenue | Stay Reviews | Avg Rating |
|---|---|---|---|---|
| Brooke | 1 | $110,884 | 21 | 5.00/5.0 |
| Mark | 1 | $99,462 | 110 | 4.98/5.0 |
| Alison | 1 | $59,410 | 14 | 5.00/5.0 |
| Kim | 2 | $58,927 | 168 | 4.75/5.0 |
| Rita Bee | 1 | $40,767 | 153 | 4.90/5.0 |
| Bekki | 1 | $40,150 | 70 | 4.96/5.0 |
| Karen | 1 | $36,545 | 50 | 4.96/5.0 |
| Lauri | 1 | $35,092 | 15 | 4.93/5.0 |
| Kiki | 1 | $34,138 | 221 | 4.93/5.0 |
| Paul | 1 | $32,616 | 15 | 5.00/5.0 |
Analyzing the strategies of top hosts, such as their property selection, pricing, and guest communication, can offer valuable lessons for optimizing your own Airbnb operations in Wells.
Dive Deeper: Advanced Wells STR Market Data (2026)
Ready to unlock more insights? AirROI provides access to advanced metrics and comprehensive Airbnb data for Wells. Explore detailed analytics beyond this report to refine your investment strategy, optimize pricing, and maximize your vacation rental profits.
Explore Advanced MetricsWells Short-Term Rental Market Composition (2026): Property & Room Types
Room Type Distribution
Property Type Distribution
Market Composition Insights for Wells
- The Wells Airbnb market composition is heavily skewed towards Entire Home/Apt listings, which make up 85.7% of the 21 active rentals. This indicates strong guest preference for privacy and space.
- Looking at the property type distribution in Wells, House properties are the most common (61.9%), reflecting the local real estate landscape.
- Houses represent a significant 61.9% portion, catering likely to families or larger groups.
Wells Airbnb Room Capacity Analysis (2026): Bedroom Distribution
Distribution of Listings by Number of Bedrooms
Room Capacity Insights for Wells
- The dominant room capacity in Wells is 2 bedrooms listings, making up 28.6% of the market. This suggests a strong demand for properties suitable for couples or solo travelers.
- Together, 2 bedrooms and 4 bedrooms properties represent 57.2% of the active Airbnb listings in Wells, indicating a high concentration in these sizes.
- A significant 52.4% of listings offer 3+ bedrooms, catering to larger groups and families seeking more space in Wells.
Wells Vacation Rental Guest Capacity Trends (2026)
Distribution of Listings by Guest Capacity
Guest Capacity Insights for Wells
- The most common guest capacity trend in Wells vacation rentals is listings accommodating 8+ guests (47.6%). This suggests the primary traveler segment is likely larger groups.
- Properties designed for 8+ guests and 2 guests dominate the Wells STR market, accounting for 61.9% of listings.
- 61.9% of properties accommodate 6+ guests, serving the market segment for larger families or group travel in Wells.
- On average, properties in Wells are equipped to host 5.5 guests.
Wells Airbnb Booking Patterns (2026): Available vs. Booked Days
Available Days Distribution
Booked Days Distribution
Booking Pattern Insights for Wells
- The most common availability pattern in Wells falls within the 271-366 days range, representing 47.6% of listings. This suggests many properties have significant open periods on their calendars.
- Approximately 76.2% of listings show high availability (181+ days open annually), indicating potential for increased bookings or specific owner usage patterns.
- For booked days, the 31-90 days range is most frequent in Wells (38.1%), reflecting common guest stay durations or potential owner blocking patterns.
- A notable 23.8% of properties secure long booking periods (181+ days booked per year), highlighting successful long-term rental strategies or significant owner usage.
Wells Airbnb Minimum Stay Requirements Analysis
Distribution of Listings by Minimum Night Requirement
1 Night
3 listings
14.3% of total
2 Nights
11 listings
52.4% of total
7-29 Nights
2 listings
9.5% of total
30+ Nights
5 listings
23.8% of total
Key Insights
- The most prevalent minimum stay requirement in Wells is 2 Nights, adopted by 52.4% of listings. This highlights the market's preference for shorter, flexible bookings.
- A strong majority (66.7%) of the Wells Airbnb data shows acceptance of very short stays (1-2 nights), indicating a dynamic, high-turnover market.
- A significant segment (23.8%) caters to monthly stays (30+ nights) in Wells, pointing to opportunities in the extended-stay market.
Recommendations
- Align with the market by considering a 2 Nights minimum stay, as 52.4% of Wells hosts use this setting.
- If feasible, allowing 1-night stays, especially midweek or during low season, could capture last-minute bookings, as only 14.3% currently do.
- A 2-night minimum appears standard (52.4%). Consider this for weekends or peak periods.
- Explore offering discounts for stays of 30+ nights to attract the 23.8% of the market seeking extended stays.
- Adjust minimum nights based on seasonality – potentially shorter during low season and longer during peak demand periods in Wells.
Wells Airbnb Cancellation Policy Trends Analysis (2026)
Flexible
5 listings
23.8% of total
Moderate
5 listings
23.8% of total
Firm
10 listings
47.6% of total
Strict
1 listings
4.8% of total
Cancellation Policy Insights for Wells
- The prevailing Airbnb cancellation policy trend in Wells is Firm, used by 47.6% of listings.
- A majority (52.4%) of hosts in Wells utilize Firm or Strict policies, indicating a market where hosts prioritize booking security.
- Strict cancellation policies are quite rare (4.8%), potentially making listings with this policy less competitive unless justified by high demand or property type.
Recommendations for Hosts
- Consider adopting a Firm policy to align with the 47.6% market standard in Wells.
- Using a Strict policy might deter some guests, as only 4.8% of listings use it. Evaluate if potential revenue protection outweighs possible lower booking rates.
- Regularly review your cancellation policy against competitors and market demand shifts in Wells.
Wells STR Booking Lead Time Analysis (2026)
Average Booking Lead Time by Month
Booking Lead Time Insights for Wells
- The overall average booking lead time for vacation rentals in Wells is 75 days.
- Guests book furthest in advance for stays during July (average 102 days), likely coinciding with peak travel demand or local events.
- The shortest booking windows occur for stays in March (average 37 days), indicating more last-minute travel plans during this time.
- Seasonally, Summer (85 days avg.) sees the longest lead times, while Winter (56 days avg.) has the shortest, reflecting typical travel planning cycles.
Recommendations for Hosts
- Use the overall average lead time (75 days) as a baseline for your pricing and availability strategy in Wells.
- For July stays, consider implementing length-of-stay discounts or slightly higher rates for bookings made less than 102 days out to capitalize on advance planning.
- Target marketing efforts for the Summer season well in advance (at least 85 days) to capture early planners.
- Monitor your own booking lead times against these Wells averages to identify opportunities for dynamic pricing adjustments.
Popular & Essential Airbnb Amenities in Wells (2026)
Amenity Prevalence
Amenity Insights for Wells
- Essential amenities in Wells that guests expect include: Smoke alarm, Hair dryer, Wifi, Dishes and silverware, Hot water, Free parking on premises, Heating, Cooking basics, Oven, Refrigerator. Lacking these (any) could significantly impact bookings.
Recommendations for Hosts
- Ensure your listing includes all essential amenities for Wells: Smoke alarm, Hair dryer, Wifi, Dishes and silverware, Hot water, Free parking on premises, Heating, Cooking basics, Oven, Refrigerator.
- Prioritize adding missing essentials: Heating, Cooking basics, Oven, Refrigerator.
- Highlight unique or less common amenities you offer (e.g., hot tub, dedicated workspace, EV charger) in your listing description and photos.
- Regularly check competitor amenities in Wells to stay competitive.
Wells Airbnb Guest Demographics & Profile Analysis (2026)
Guest Profile Summary for Wells
- The typical guest profile for Airbnb in Wells consists of primarily domestic travelers (98%), often arriving from nearby New York, typically belonging to the Post-2000s (Gen Z/Alpha) group (50%), primarily speaking English or Spanish.
- Domestic travelers account for 97.6% of guests.
- Key international markets include United States (97.6%) and DC (0.8%).
- Top languages spoken are English (61.8%) followed by Spanish (14.7%).
- A significant demographic segment is the Post-2000s (Gen Z/Alpha) group, representing 50% of guests.
Recommendations for Hosts
- Target domestic marketing efforts towards travelers from New York and Boston.
- Tailor amenities and listing descriptions to appeal to the dominant Post-2000s (Gen Z/Alpha) demographic (e.g., highlight fast WiFi, smart home features, local guides).
- Highlight unique local experiences or amenities relevant to the primary guest profile.
- Consider seasonal promotions aligned with peak travel times for key origin markets.
Nearby Short-Term Rental Market Comparison
How does the Wells Airbnb market stack up against its neighbors? Compare key performance metrics like average monthly revenue, ADR, and occupancy rates in surrounding areas to understand the broader regional STR landscape.
| Market | Active Properties | Monthly Revenue | Daily Rate | Avg. Occupancy |
|---|---|---|---|---|
| Middletown Springs | 13 | $6,843 | $507.55 | 32% |
| Pomfret | 15 | $6,549 | $502.74 | 45% |
| Fort Ann | 35 | $6,238 | $790.41 | 37% |
| Hanover | 33 | $5,826 | $1189.51 | 41% |
| Town of Ancram | 22 | $5,616 | $512.55 | 38% |
| Town of Schodack | 11 | $5,158 | $555.89 | 29% |
| Town of Stillwater | 55 | $5,153 | $564.54 | 42% |
| Monterey | 41 | $5,089 | $470.60 | 44% |
| Malletts Bay | 51 | $4,842 | $444.86 | 41% |
| Town of Wilton | 103 | $4,841 | $862.83 | 38% |