Tunbridge Airbnb Market Analysis 2026: Short Term Rental Data & Vacation Rental Statistics in Vermont, United States
Is Airbnb profitable in Tunbridge in 2026? Explore comprehensive Airbnb analytics for Tunbridge, Vermont, United States to uncover income potential. This 2026 STR market report for Tunbridge, based on AirROI data from February 2025 to January 2026, reveals key trends in the niche market of 27 active listings.
Whether you're considering an Airbnb investment in Tunbridge, optimizing your existing vacation rental, or exploring rental arbitrage opportunities, understanding the Tunbridge Airbnb data is crucial. Leveraging the low regulation environment is key to maximizing your short term rental income potential. Let's dive into the specifics.
Key Tunbridge Airbnb Performance Metrics Overview
Monthly Airbnb Revenue Variations & Income Potential in Tunbridge (2026)
Understanding the monthly revenue variations for Airbnb listings in Tunbridge is key to maximizing your short term rental income potential. Seasonality significantly impacts earnings. Our analysis, based on data from the past 12 months, shows that the peak revenue month for STRs in Tunbridge is typically July, while April often presents the lowest earnings, highlighting opportunities for strategic pricing adjustments during shoulder and low seasons. Explore the typical Airbnb income in Tunbridge across different performance tiers:
- Best-in-class properties (Top 10%) achieve $5,500+ monthly, often utilizing dynamic pricing and superior guest experiences.
- Strong performing properties (Top 25%) earn $2,482 or more, indicating effective management and desirable locations/amenities.
- Typical properties (Median) generate around $1,164 per month, representing the average market performance.
- Entry-level properties (Bottom 25%) see earnings around $645, often with potential for optimization.
Average Monthly Airbnb Earnings Trend in Tunbridge
Tunbridge Airbnb Occupancy Rate Trends (2026)
Maximize your bookings by understanding the Tunbridge STR occupancy trends. Seasonal demand shifts significantly influence how often properties are booked. Typically, Octobersees the highest demand (peak season occupancy), while May experiences the lowest (low season). Effective strategies, like adjusting minimum stays or offering promotions, can boost occupancy during slower periods. Here's how different property tiers perform in Tunbridge:
- Best-in-class properties (Top 10%) achieve 73%+ occupancy, indicating high desirability and potentially optimized availability.
- Strong performing properties (Top 25%) maintain 54% or higher occupancy, suggesting good market fit and guest satisfaction.
- Typical properties (Median) have an occupancy rate around 34%.
- Entry-level properties (Bottom 25%) average 15% occupancy, potentially facing higher vacancy.
Average Monthly Occupancy Rate Trend in Tunbridge
Average Daily Rate (ADR) Airbnb Trends in Tunbridge (2026)
Effective short term rental pricing strategy in Tunbridge involves understanding monthly ADR fluctuations. The Average Daily Rate (ADR) for Airbnb in Tunbridge typically peaks in September and dips lowest during April. Leveraging Airbnb dynamic pricing tools or strategies based on this seasonality can significantly boost revenue. Here's a look at the typical nightly rates achieved:
- Best-in-class properties (Top 10%) command rates of $367+ per night, often due to premium features or locations.
- Strong performing properties (Top 25%) achieve nightly rates of $245 or more.
- Typical properties (Median) charge around $161 per night.
- Entry-level properties (Bottom 25%) earn around $81 per night.
Average Daily Rate (ADR) Trend by Month in Tunbridge
Get Live Tunbridge Market Intelligence 👇

Explore Real-time Analytics
Airbnb Seasonality Analysis & Trends in Tunbridge (2026)
Peak Season (July, September, June)
- Revenue averages $2,377 per month
- Occupancy rates average 37.9%
- Daily rates average $193
Shoulder Season
- Revenue averages $2,053 per month
- Occupancy maintains around 38.4%
- Daily rates hold near $182
Low Season (April, November, December)
- Revenue drops to average $1,538 per month
- Occupancy decreases to average 34.0%
- Daily rates adjust to average $180
Seasonality Insights for Tunbridge
- The Airbnb seasonality in Tunbridge shows moderate seasonality with distinct peak and low periods. While the sections above show seasonal averages, it's also insightful to look at the extremes:
- During the high season, the absolute peak month showcases Tunbridge's highest earning potential, with monthly revenues capable of climbing to $2,496, occupancy reaching a high of 47.1%, and ADRs peaking at $198.
- Conversely, the slowest single month of the year, typically falling within the low season, marks the market's lowest point. In this month, revenue might dip to $1,414, occupancy could drop to 30.7%, and ADRs may adjust down to $177.
- Understanding both the seasonal averages and these monthly peaks and troughs in revenue, occupancy, and ADR is crucial for maximizing your Airbnb profit potential in Tunbridge.
Seasonal Strategies for Maximizing Profit
- Peak Season: Maximize revenue through premium pricing and potentially longer minimum stays. Ensure high availability.
- Low Season: Offer competitive pricing, special promotions (e.g., extended stay discounts), and flexible cancellation policies. Target off-season travelers like remote workers or budget-conscious guests.
- Shoulder Seasons: Implement dynamic pricing that balances peak and low rates. Target weekend travelers or specific events. Offer slightly more flexible terms than peak season.
- Regularly analyze your own performance against these Tunbridge seasonality benchmarks and adjust your pricing and availability strategy accordingly.
Best Areas for Airbnb Investment in Tunbridge (2026)
Exploring the top neighborhoods for short-term rentals in Tunbridge? This section highlights key areas, outlining why they are attractive for hosts and guests, along with notable local attractions. Consider these locations based on your target guest profile and investment strategy.
| Neighborhood / Area | Why Host Here? (Target Guests & Appeal) | Key Attractions & Landmarks |
|---|---|---|
| Downtown Tunbridge | A charming area with historical buildings and local restaurants. Perfect for travelers looking to experience small-town Vermont culture. | Tunbridge World's Fair, Tunbridge Baptist Church, local artisan shops, scenic backroads, Lamoille Valley Rail Trail |
| Skyline Drive | Stunning views and access to outdoor activities, ideal for travelers who enjoy nature and scenic landscapes. | Skyline Drive Scenic Overlook, hiking trails, wildlife observation, leaf peeping in fall, close to the White River |
| Upper Village | A cozy village atmosphere close to local farms and markets, great for families and those seeking a relaxing getaway. | Tunbridge Farm Stand, local orchards, community events, family-friendly parks |
| East Tunbridge | A tranquil, rural area that offers a peaceful retreat from city life, attractive to visitors seeking solitude. | East Tunbridge Church, nature trails, Vermont countryside, local farms |
| West Tunbridge | A quiet area with beautiful landscapes, ideal for outdoor enthusiasts and those wanting to explore Vermont's natural beauty. | West Tunbridge Cemetery, hiking paths, mountain biking, near the Green Mountain National Forest |
| The Junction | An emerging hub for tourists with new developments and amenities, appealing to modern travelers looking for convenience. | local eateries, new shops, community spaces, outdoor sports facilities |
| Tunbridge Village | Historic and picturesque, perfect for guests interested in history and local culture with easy access to various attractions. | Tunbridge Historical Society, local galleries, vintage shops, town common |
| Vermont Route 110 | A scenic highway that attracts leaf peepers and outdoor adventurers, providing easy access to state parks and recreational areas. | Gifford Woods State Park, Green Mountain Forest, Ludlow Mountain |
Understanding Airbnb License Requirements & STR Laws in Tunbridge (2026)
While Tunbridge, Vermont, United States currently shows low STR regulations, specific Airbnb license requirements might still exist or change. Always verify the latest short term rental regulations and Airbnb license requirements directly with local government authorities for Tunbridge to ensure full compliance before hosting.
(Source: AirROI data, 2026, finding no licensed listings among those analyzed)
Top Performing Airbnb Properties in Tunbridge (2026)
Benchmark your potential! Explore examples of top-performing Airbnb properties in Tunbridgebased on Trailing Twelve Month (TTM) revenue. Analyze their characteristics, revenue, occupancy rate, and ADR to understand what drives success in this market.

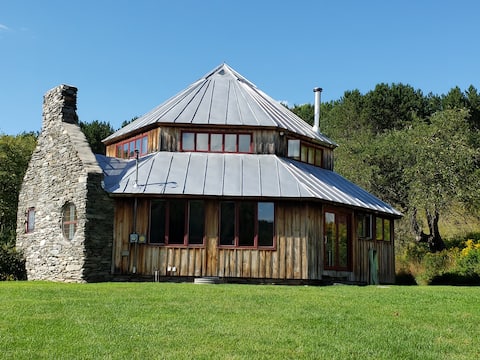
Town’s End, a Private Retreat with Mountain Views
Entire Place • 6 bedrooms
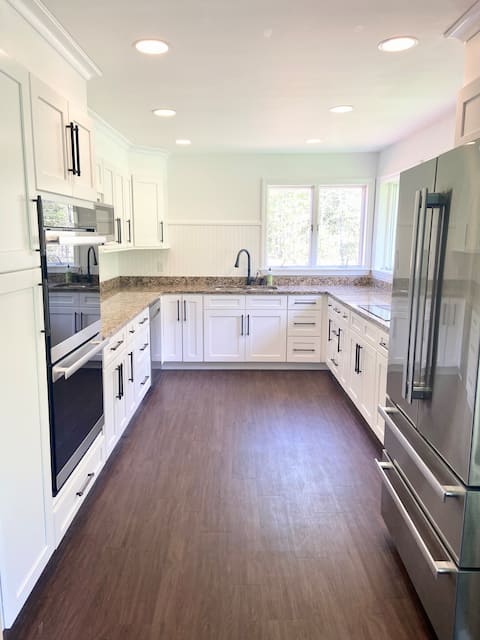
The Barnbrook House
Entire Place • 4 bedrooms
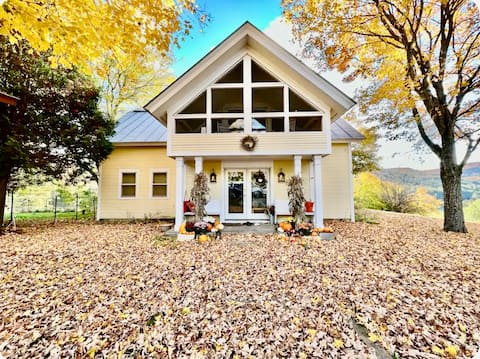
Spacious country home, beautiful sunsets, 40 acres
Entire Place • 3 bedrooms
Vermont Farm Animal Sanctuary 6 bdrm farmhouse Inn
Entire Place • 5 bedrooms
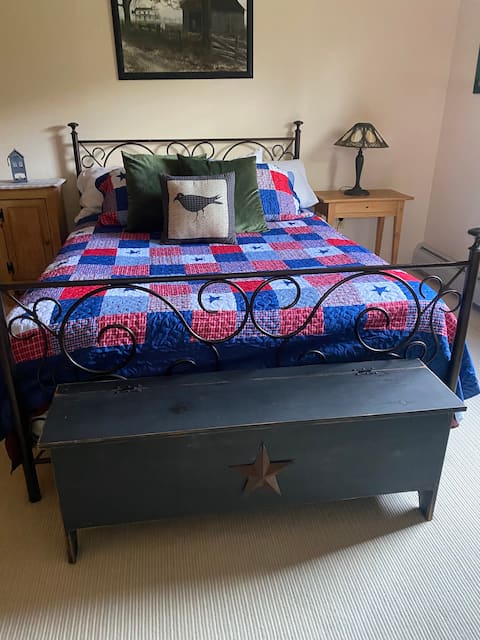
4 bdrm suite in Vermont Farm Animal Sanctuary Inn
Private Room • 4 bedrooms
2 bdrm Vt Farm animal Getaway
Private Room • 2 bedrooms
Note: Performance varies based on location, size, amenities, seasonality, and management quality. Data reflects the past 12 months.
Top Performing Airbnb Hosts in Tunbridge (2026)
Learn from the best! This table showcases top-performing Airbnb hosts in Tunbridge based on the number of properties managed and estimated total revenue over the past year. Analyze their scale and performance metrics.
| Host Name | Properties | Grossing Revenue | Stay Reviews | Avg Rating |
|---|---|---|---|---|
| Steven & Missy | 6 | $111,930 | 296 | 4.99/5.0 |
| Dana | 3 | $77,454 | 510 | 4.96/5.0 |
| India | 1 | $76,330 | 107 | 4.94/5.0 |
| Lindsay | 1 | $47,736 | 55 | 4.84/5.0 |
| Bob | 5 | $47,531 | 972 | 4.89/5.0 |
| Janet | 1 | $20,567 | 339 | 4.94/5.0 |
| Pura | 1 | $17,322 | 184 | 4.86/5.0 |
| David & Beth | 1 | $16,932 | 102 | 4.94/5.0 |
| Calen | 2 | $16,931 | 104 | 4.89/5.0 |
| Elizabeth Christina | 1 | $9,172 | 15 | 4.80/5.0 |
Analyzing the strategies of top hosts, such as their property selection, pricing, and guest communication, can offer valuable lessons for optimizing your own Airbnb operations in Tunbridge.
Dive Deeper: Advanced Tunbridge STR Market Data (2026)
Ready to unlock more insights? AirROI provides access to advanced metrics and comprehensive Airbnb data for Tunbridge. Explore detailed analytics beyond this report to refine your investment strategy, optimize pricing, and maximize your vacation rental profits.
Explore Advanced MetricsTunbridge Short-Term Rental Market Composition (2026): Property & Room Types
Room Type Distribution
Property Type Distribution
Market Composition Insights for Tunbridge
- The Tunbridge Airbnb market composition is heavily skewed towards Entire Home/Apt listings, which make up 66.7% of the 27 active rentals. This indicates strong guest preference for privacy and space.
- However, a notable 29.6% share for Private Rooms suggests opportunities for budget-conscious travelers or hosts renting out spare rooms.
- Looking at the property type distribution in Tunbridge, Outdoor/Unique properties are the most common (37%), reflecting the local real estate landscape.
- Houses represent a significant 37% portion, catering likely to families or larger groups.
- Smaller segments like unique stays, hotel/boutique (combined 7.4%) offer potential for unique stay experiences.
Tunbridge Airbnb Room Capacity Analysis (2026): Bedroom Distribution
Distribution of Listings by Number of Bedrooms
Room Capacity Insights for Tunbridge
- The dominant room capacity in Tunbridge is 1 bedroom listings, making up 22.2% of the market. This suggests a strong demand for properties suitable for couples or solo travelers.
- Together, 1 bedroom and 2 bedrooms properties represent 40.7% of the active Airbnb listings in Tunbridge, indicating a high concentration in these sizes.
- A significant 29.6% of listings offer 3+ bedrooms, catering to larger groups and families seeking more space in Tunbridge.
Tunbridge Vacation Rental Guest Capacity Trends (2026)
Distribution of Listings by Guest Capacity
Guest Capacity Insights for Tunbridge
- The most common guest capacity trend in Tunbridge vacation rentals is listings accommodating 2 guests (22.2%). This suggests the primary traveler segment is likely couples or solo travelers.
- Properties designed for 2 guests and 8+ guests dominate the Tunbridge STR market, accounting for 40.7% of listings.
- 37.0% of properties accommodate 6+ guests, serving the market segment for larger families or group travel in Tunbridge.
- On average, properties in Tunbridge are equipped to host 3.7 guests.
Tunbridge Airbnb Booking Patterns (2026): Available vs. Booked Days
Available Days Distribution
Booked Days Distribution
Booking Pattern Insights for Tunbridge
- The most common availability pattern in Tunbridge falls within the 271-366 days range, representing 59.3% of listings. This suggests many properties have significant open periods on their calendars.
- Approximately 81.5% of listings show high availability (181+ days open annually), indicating potential for increased bookings or specific owner usage patterns.
- For booked days, the 31-90 days range is most frequent in Tunbridge (40.7%), reflecting common guest stay durations or potential owner blocking patterns.
- A notable 18.5% of properties secure long booking periods (181+ days booked per year), highlighting successful long-term rental strategies or significant owner usage.
Tunbridge Airbnb Minimum Stay Requirements Analysis
Distribution of Listings by Minimum Night Requirement
1 Night
18 listings
66.7% of total
2 Nights
5 listings
18.5% of total
4-6 Nights
2 listings
7.4% of total
30+ Nights
2 listings
7.4% of total
Key Insights
- The most prevalent minimum stay requirement in Tunbridge is 1 Night, adopted by 66.7% of listings. This highlights the market's preference for shorter, flexible bookings.
- A strong majority (85.2%) of the Tunbridge Airbnb data shows acceptance of very short stays (1-2 nights), indicating a dynamic, high-turnover market.
Recommendations
- Align with the market by considering a 1 Night minimum stay, as 66.7% of Tunbridge hosts use this setting.
- Explore offering discounts for stays of 30+ nights to attract the 7.4% of the market seeking extended stays.
- Adjust minimum nights based on seasonality – potentially shorter during low season and longer during peak demand periods in Tunbridge.
Tunbridge Airbnb Cancellation Policy Trends Analysis (2026)
Flexible
8 listings
29.6% of total
Moderate
6 listings
22.2% of total
Firm
12 listings
44.4% of total
Strict
1 listings
3.7% of total
Cancellation Policy Insights for Tunbridge
- The prevailing Airbnb cancellation policy trend in Tunbridge is Firm, used by 44.4% of listings.
- There's a relatively balanced mix between guest-friendly (51.8%) and stricter (48.1%) policies, offering choices for different guest needs.
- Strict cancellation policies are quite rare (3.7%), potentially making listings with this policy less competitive unless justified by high demand or property type.
Recommendations for Hosts
- Consider adopting a Firm policy to align with the 44.4% market standard in Tunbridge.
- Using a Strict policy might deter some guests, as only 3.7% of listings use it. Evaluate if potential revenue protection outweighs possible lower booking rates.
- Regularly review your cancellation policy against competitors and market demand shifts in Tunbridge.
Tunbridge STR Booking Lead Time Analysis (2026)
Average Booking Lead Time by Month
Booking Lead Time Insights for Tunbridge
- The overall average booking lead time for vacation rentals in Tunbridge is 61 days.
- Guests book furthest in advance for stays during September (average 94 days), likely coinciding with peak travel demand or local events.
- The shortest booking windows occur for stays in January (average 28 days), indicating more last-minute travel plans during this time.
- Seasonally, Fall (70 days avg.) sees the longest lead times, while Winter (31 days avg.) has the shortest, reflecting typical travel planning cycles.
Recommendations for Hosts
- Use the overall average lead time (61 days) as a baseline for your pricing and availability strategy in Tunbridge.
- For September stays, consider implementing length-of-stay discounts or slightly higher rates for bookings made less than 94 days out to capitalize on advance planning.
- Target marketing efforts for the Fall season well in advance (at least 70 days) to capture early planners.
- Monitor your own booking lead times against these Tunbridge averages to identify opportunities for dynamic pricing adjustments.
Popular & Essential Airbnb Amenities in Tunbridge (2026)
Amenity Prevalence
Amenity Insights for Tunbridge
- Popular amenities like Free parking on premises, Fire extinguisher, Wifi are common but not universal. Offering these can provide a competitive edge.
- Warning: Wifi is not universally provided but is considered essential globally. Ensure reliable Wifi is offered.
Recommendations for Hosts
- Consider adding popular differentiators like Free parking on premises or Fire extinguisher to increase appeal.
- Highlight unique or less common amenities you offer (e.g., hot tub, dedicated workspace, EV charger) in your listing description and photos.
- Regularly check competitor amenities in Tunbridge to stay competitive.
Tunbridge Airbnb Guest Demographics & Profile Analysis (2026)
Guest Profile Summary for Tunbridge
- The typical guest profile for Airbnb in Tunbridge consists of primarily domestic travelers (89%), often arriving from nearby New York, typically belonging to the Post-2000s (Gen Z/Alpha) group (50%), primarily speaking English or Spanish.
- Domestic travelers account for 89.2% of guests.
- Key international markets include United States (89.2%) and Canada (4.9%).
- Top languages spoken are English (60%) followed by Spanish (16.8%).
- A significant demographic segment is the Post-2000s (Gen Z/Alpha) group, representing 50% of guests.
Recommendations for Hosts
- Target domestic marketing efforts towards travelers from New York and Boston.
- Tailor amenities and listing descriptions to appeal to the dominant Post-2000s (Gen Z/Alpha) demographic (e.g., highlight fast WiFi, smart home features, local guides).
- Highlight unique local experiences or amenities relevant to the primary guest profile.
- Consider seasonal promotions aligned with peak travel times for key origin markets.
Nearby Short-Term Rental Market Comparison
How does the Tunbridge Airbnb market stack up against its neighbors? Compare key performance metrics like average monthly revenue, ADR, and occupancy rates in surrounding areas to understand the broader regional STR landscape.
| Market | Active Properties | Monthly Revenue | Daily Rate | Avg. Occupancy |
|---|---|---|---|---|
| Middletown Springs | 13 | $6,843 | $507.55 | 32% |
| Pomfret | 15 | $6,549 | $502.74 | 45% |
| Fort Ann | 35 | $6,238 | $790.41 | 37% |
| Hanover | 33 | $5,826 | $1189.51 | 41% |
| North Andover | 12 | $5,625 | $440.84 | 45% |
| Town of Ancram | 22 | $5,616 | $512.55 | 38% |
| Wellesley | 22 | $5,310 | $520.90 | 50% |
| Town of Schodack | 11 | $5,158 | $555.89 | 29% |
| Town of Stillwater | 55 | $5,153 | $564.54 | 42% |
| Barnstead | 36 | $5,090 | $477.12 | 42% |