Stratton Airbnb Market Analysis 2026: Short Term Rental Data & Vacation Rental Statistics in Vermont, United States
Is Airbnb profitable in Stratton in 2026? Explore comprehensive Airbnb analytics for Stratton, Vermont, United States to uncover income potential. This 2026 STR market report for Stratton, based on AirROI data from February 2025 to January 2026, reveals key trends in the niche market of 123 active listings.
Whether you're considering an Airbnb investment in Stratton, optimizing your existing vacation rental, or exploring rental arbitrage opportunities, understanding the Stratton Airbnb data is crucial. Understanding the local regulations is key to maximizing your short term rental income potential. Let's dive into the specifics.
Key Stratton Airbnb Performance Metrics Overview
Monthly Airbnb Revenue Variations & Income Potential in Stratton (2026)
Understanding the monthly revenue variations for Airbnb listings in Stratton is key to maximizing your short term rental income potential. Seasonality significantly impacts earnings. Our analysis, based on data from the past 12 months, shows that the peak revenue month for STRs in Stratton is typically February, while June often presents the lowest earnings, highlighting opportunities for strategic pricing adjustments during shoulder and low seasons. Explore the typical Airbnb income in Stratton across different performance tiers:
- Best-in-class properties (Top 10%) achieve $12,047+ monthly, often utilizing dynamic pricing and superior guest experiences.
- Strong performing properties (Top 25%) earn $7,431 or more, indicating effective management and desirable locations/amenities.
- Typical properties (Median) generate around $4,008 per month, representing the average market performance.
- Entry-level properties (Bottom 25%) see earnings around $2,111, often with potential for optimization.
Average Monthly Airbnb Earnings Trend in Stratton
Stratton Airbnb Occupancy Rate Trends (2026)
Maximize your bookings by understanding the Stratton STR occupancy trends. Seasonal demand shifts significantly influence how often properties are booked. Typically, Februarysees the highest demand (peak season occupancy), while April experiences the lowest (low season). Effective strategies, like adjusting minimum stays or offering promotions, can boost occupancy during slower periods. Here's how different property tiers perform in Stratton:
- Best-in-class properties (Top 10%) achieve 64%+ occupancy, indicating high desirability and potentially optimized availability.
- Strong performing properties (Top 25%) maintain 43% or higher occupancy, suggesting good market fit and guest satisfaction.
- Typical properties (Median) have an occupancy rate around 27%.
- Entry-level properties (Bottom 25%) average 15% occupancy, potentially facing higher vacancy.
Average Monthly Occupancy Rate Trend in Stratton
Average Daily Rate (ADR) Airbnb Trends in Stratton (2026)
Effective short term rental pricing strategy in Stratton involves understanding monthly ADR fluctuations. The Average Daily Rate (ADR) for Airbnb in Stratton typically peaks in January and dips lowest during August. Leveraging Airbnb dynamic pricing tools or strategies based on this seasonality can significantly boost revenue. Here's a look at the typical nightly rates achieved:
- Best-in-class properties (Top 10%) command rates of $1,132+ per night, often due to premium features or locations.
- Strong performing properties (Top 25%) achieve nightly rates of $770 or more.
- Typical properties (Median) charge around $485 per night.
- Entry-level properties (Bottom 25%) earn around $306 per night.
Average Daily Rate (ADR) Trend by Month in Stratton
Get Live Stratton Market Intelligence 👇

Explore Real-time Analytics
Airbnb Seasonality Analysis & Trends in Stratton (2026)
Peak Season (February, March, January)
- Revenue averages $10,342 per month
- Occupancy rates average 46.4%
- Daily rates average $711
Shoulder Season
- Revenue averages $4,744 per month
- Occupancy maintains around 28.9%
- Daily rates hold near $589
Low Season (April, June, August)
- Revenue drops to average $3,230 per month
- Occupancy decreases to average 23.6%
- Daily rates adjust to average $538
Seasonality Insights for Stratton
- The Airbnb seasonality in Stratton shows highly seasonal trends requiring careful strategy. While the sections above show seasonal averages, it's also insightful to look at the extremes:
- During the high season, the absolute peak month showcases Stratton's highest earning potential, with monthly revenues capable of climbing to $13,422, occupancy reaching a high of 61.5%, and ADRs peaking at $765.
- Conversely, the slowest single month of the year, typically falling within the low season, marks the market's lowest point. In this month, revenue might dip to $2,777, occupancy could drop to 22.3%, and ADRs may adjust down to $522.
- Understanding both the seasonal averages and these monthly peaks and troughs in revenue, occupancy, and ADR is crucial for maximizing your Airbnb profit potential in Stratton.
Seasonal Strategies for Maximizing Profit
- Peak Season: Maximize revenue through premium pricing and potentially longer minimum stays. Ensure high availability.
- Low Season: Offer competitive pricing, special promotions (e.g., extended stay discounts), and flexible cancellation policies. Target off-season travelers like remote workers or budget-conscious guests.
- Shoulder Seasons: Implement dynamic pricing that balances peak and low rates. Target weekend travelers or specific events. Offer slightly more flexible terms than peak season.
- Regularly analyze your own performance against these Stratton seasonality benchmarks and adjust your pricing and availability strategy accordingly.
Best Areas for Airbnb Investment in Stratton (2026)
Exploring the top neighborhoods for short-term rentals in Stratton? This section highlights key areas, outlining why they are attractive for hosts and guests, along with notable local attractions. Consider these locations based on your target guest profile and investment strategy.
| Neighborhood / Area | Why Host Here? (Target Guests & Appeal) | Key Attractions & Landmarks |
|---|---|---|
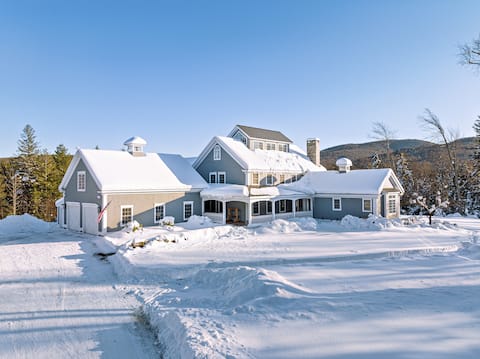
| Stratton Mountain | Popular ski resort area in winter, attracting tourists for skiing and snowboarding. Ideal for winter sports enthusiasts and families looking for a mountain getaway. | Stratton Mountain Resort, Stratton Village, Skiing and Snowboarding, Stratton Golf Course, Hiking Trails |
| Stratton Vermont Village | Charming village atmosphere with local shops and restaurants, appealing to tourists looking for a cozy and quaint stay. Great access to outdoor activities year-round. | Stratton Village, Local boutiques, Dining options, Stratton Sports Center, Mountain biking trails |
| Winhall | Close proximity to Stratton Mountain, this township offers a quiet, residential vibe while still being near popular attractions. Good for family-oriented stays. | Winhall River, Lakes and recreational areas, Hiking trails, Scenic views |
| Landgrove | A serene and picturesque town, perfect for nature lovers seeking peaceful retreats in the Green Mountains. Appeals to visitors looking for tranquility and relaxation. | Landgrove Town Hall, Nearby hiking spots, Nature preserves, Scenic landscapes |
| Bondville | Small, quiet community located near Stratton Mountain. Attracts travelers seeking an authentic Vermont experience away from the hustle and bustle. | Bondville General Store, Local farms, Wooded trails, Scenic drives |
| Peru | Picturesque and idyllic town, often sought after for its scenic beauty. Draws in tourists during the summer and fall for hiking and leaf-peeping. | Magic Mountain Ski Area, Local festivals, Hiking trails, Adirondack views |
| Manchester | Nearby town with vibrant shopping and dining options. Offers a wider variety of amenities and attractions while being close to Stratton for skiing. | Hildene Estate, Manchester Designer Outlets, Local art galleries, Equinox Mountain, Southern Vermont Arts Center |
| Chester | Historical town with charming architecture and a strong sense of community. Attractive for those interested in local history and arts. | Chester Village, Historic buildings, Local crafts, Parks |
Understanding Airbnb License Requirements & STR Laws in Stratton (2026)
With 13% of listings showing registration in 2026, understanding potential Airbnb license requirements is crucial in Stratton. Always verify the latest short term rental regulations and Airbnb license requirements directly with local government authorities for Stratton to ensure full compliance before hosting.
(Source: AirROI data, 2026, based on 13% licensed listings)
Top Performing Airbnb Properties in Stratton (2026)
Benchmark your potential! Explore examples of top-performing Airbnb properties in Strattonbased on Trailing Twelve Month (TTM) revenue. Analyze their characteristics, revenue, occupancy rate, and ADR to understand what drives success in this market.
Catey Rose Retreat|Movie Theatre-Hot Tub-Fireplace
Entire Place • 7 bedrooms

Luxury Ski In/Out House
Entire Place • 4 bedrooms
5BR Retreat w/ Hot Tub - Sleeps 12 in Stratton
Entire Place • 5 bedrooms

Luxury two-story ski condo right on the mountain!
Entire Place • 3 bedrooms
Ski In / Ski Out 4BR / 3BA Private Hot Tub and sha
Entire Place • 4 bedrooms
Chalet w/ hot tub min. to Stratton & Mount Snow
Entire Place • 4 bedrooms
Note: Performance varies based on location, size, amenities, seasonality, and management quality. Data reflects the past 12 months.
Top Performing Airbnb Hosts in Stratton (2026)
Learn from the best! This table showcases top-performing Airbnb hosts in Stratton based on the number of properties managed and estimated total revenue over the past year. Analyze their scale and performance metrics.
| Host Name | Properties | Grossing Revenue | Stay Reviews | Avg Rating |
|---|---|---|---|---|
| Sierra | 8 | $437,686 | 114 | 4.83/5.0 |
| Venture Rental Management | 3 | $358,197 | 47 | 4.93/5.0 |
| Carl | 4 | $196,026 | 26 | 4.97/5.0 |
| Megan | 5 | $166,805 | 35 | 4.95/5.0 |
| Katarzyna | 1 | $157,025 | 47 | 4.98/5.0 |
| Evolve | 4 | $147,262 | 71 | 4.82/5.0 |
| Peter | 2 | $146,327 | 53 | 4.96/5.0 |
| Jeff | 1 | $135,064 | 48 | 4.90/5.0 |
| Ally | 1 | $111,400 | 45 | 5.00/5.0 |
| Kyle | 1 | $109,097 | 53 | 4.77/5.0 |
Analyzing the strategies of top hosts, such as their property selection, pricing, and guest communication, can offer valuable lessons for optimizing your own Airbnb operations in Stratton.
Dive Deeper: Advanced Stratton STR Market Data (2026)
Ready to unlock more insights? AirROI provides access to advanced metrics and comprehensive Airbnb data for Stratton. Explore detailed analytics beyond this report to refine your investment strategy, optimize pricing, and maximize your vacation rental profits.
Explore Advanced MetricsStratton Short-Term Rental Market Composition (2026): Property & Room Types
Room Type Distribution
Property Type Distribution
Market Composition Insights for Stratton
- The Stratton Airbnb market composition is heavily skewed towards Entire Home/Apt listings, which make up 99.2% of the 123 active rentals. This indicates strong guest preference for privacy and space.
- Looking at the property type distribution in Stratton, House properties are the most common (45.5%), reflecting the local real estate landscape.
- Houses represent a significant 45.5% portion, catering likely to families or larger groups.
- Smaller segments like hotel/boutique, others (combined 2.4%) offer potential for unique stay experiences.
Stratton Airbnb Room Capacity Analysis (2026): Bedroom Distribution
Distribution of Listings by Number of Bedrooms
Room Capacity Insights for Stratton
- The dominant room capacity in Stratton is 3 bedrooms listings, making up 32.5% of the market. This suggests a strong demand for properties suitable for families or small groups.
- Together, 3 bedrooms and 2 bedrooms properties represent 61.8% of the active Airbnb listings in Stratton, indicating a high concentration in these sizes.
- A significant 60.1% of listings offer 3+ bedrooms, catering to larger groups and families seeking more space in Stratton.
Stratton Vacation Rental Guest Capacity Trends (2026)
Distribution of Listings by Guest Capacity
Guest Capacity Insights for Stratton
- The most common guest capacity trend in Stratton vacation rentals is listings accommodating 8+ guests (56.1%). This suggests the primary traveler segment is likely larger groups.
- Properties designed for 8+ guests and 6 guests dominate the Stratton STR market, accounting for 74.0% of listings.
- 76.4% of properties accommodate 6+ guests, serving the market segment for larger families or group travel in Stratton.
- On average, properties in Stratton are equipped to host 6.7 guests.
Stratton Airbnb Booking Patterns (2026): Available vs. Booked Days
Available Days Distribution
Booked Days Distribution
Booking Pattern Insights for Stratton
- The most common availability pattern in Stratton falls within the 271-366 days range, representing 69.1% of listings. This suggests many properties have significant open periods on their calendars.
- Approximately 94.3% of listings show high availability (181+ days open annually), indicating potential for increased bookings or specific owner usage patterns.
- For booked days, the 31-90 days range is most frequent in Stratton (43.9%), reflecting common guest stay durations or potential owner blocking patterns.
- A notable 5.7% of properties secure long booking periods (181+ days booked per year), highlighting successful long-term rental strategies or significant owner usage.
Stratton Airbnb Minimum Stay Requirements Analysis
Distribution of Listings by Minimum Night Requirement
1 Night
5 listings
4.1% of total
2 Nights
58 listings
47.2% of total
3 Nights
12 listings
9.8% of total
4-6 Nights
3 listings
2.4% of total
7-29 Nights
3 listings
2.4% of total
30+ Nights
42 listings
34.1% of total
Key Insights
- The most prevalent minimum stay requirement in Stratton is 2 Nights, adopted by 47.2% of listings. This highlights the market's preference for shorter, flexible bookings.
- A significant segment (34.1%) caters to monthly stays (30+ nights) in Stratton, pointing to opportunities in the extended-stay market.
Recommendations
- Align with the market by considering a 2 Nights minimum stay, as 47.2% of Stratton hosts use this setting.
- If feasible, allowing 1-night stays, especially midweek or during low season, could capture last-minute bookings, as only 4.1% currently do.
- A 2-night minimum appears standard (47.2%). Consider this for weekends or peak periods.
- Explore offering discounts for stays of 30+ nights to attract the 34.1% of the market seeking extended stays.
- Adjust minimum nights based on seasonality – potentially shorter during low season and longer during peak demand periods in Stratton.
Stratton Airbnb Cancellation Policy Trends Analysis (2026)
Super Strict 30 Days
6 listings
4.9% of total
Super Strict 60 Days
1 listings
0.8% of total
Limited
2 listings
1.6% of total
Non-refundable
1 listings
0.8% of total
Flexible
4 listings
3.3% of total
Moderate
18 listings
14.8% of total
Firm
66 listings
54.1% of total
Strict
24 listings
19.7% of total
Cancellation Policy Insights for Stratton
- The prevailing Airbnb cancellation policy trend in Stratton is Firm, used by 54.1% of listings.
- A majority (73.8%) of hosts in Stratton utilize Firm or Strict policies, indicating a market where hosts prioritize booking security.
Recommendations for Hosts
- Consider adopting a Firm policy to align with the 54.1% market standard in Stratton.
- Regularly review your cancellation policy against competitors and market demand shifts in Stratton.
Stratton STR Booking Lead Time Analysis (2026)
Average Booking Lead Time by Month
Booking Lead Time Insights for Stratton
- The overall average booking lead time for vacation rentals in Stratton is 52 days.
- Guests book furthest in advance for stays during February (average 80 days), likely coinciding with peak travel demand or local events.
- The shortest booking windows occur for stays in May (average 21 days), indicating more last-minute travel plans during this time.
- Seasonally, Winter (72 days avg.) sees the longest lead times, while Summer (34 days avg.) has the shortest, reflecting typical travel planning cycles.
Recommendations for Hosts
- Use the overall average lead time (52 days) as a baseline for your pricing and availability strategy in Stratton.
- For February stays, consider implementing length-of-stay discounts or slightly higher rates for bookings made less than 80 days out to capitalize on advance planning.
- Target marketing efforts for the Winter season well in advance (at least 72 days) to capture early planners.
- Monitor your own booking lead times against these Stratton averages to identify opportunities for dynamic pricing adjustments.
Popular & Essential Airbnb Amenities in Stratton (2026)
Amenity Prevalence
Amenity Insights for Stratton
- Essential amenities in Stratton that guests expect include: Smoke alarm, Wifi, Carbon monoxide alarm, Free parking on premises, Kitchen, TV, Heating. Lacking these (any) could significantly impact bookings.
- Popular amenities like Fire extinguisher, Washer, Refrigerator are common but not universal. Offering these can provide a competitive edge.
Recommendations for Hosts
- Ensure your listing includes all essential amenities for Stratton: Smoke alarm, Wifi, Carbon monoxide alarm, Free parking on premises, Kitchen, TV, Heating.
- Prioritize adding missing essentials: Free parking on premises, Kitchen, TV, Heating.
- Consider adding popular differentiators like Fire extinguisher or Washer to increase appeal.
- Highlight unique or less common amenities you offer (e.g., hot tub, dedicated workspace, EV charger) in your listing description and photos.
- Regularly check competitor amenities in Stratton to stay competitive.
Stratton Airbnb Guest Demographics & Profile Analysis (2026)
Guest Profile Summary for Stratton
- The typical guest profile for Airbnb in Stratton consists of primarily domestic travelers (97%), often arriving from nearby New York, typically belonging to the Post-2000s (Gen Z/Alpha) group (50%), primarily speaking English or Spanish.
- Domestic travelers account for 97.0% of guests.
- Key international markets include United States (97%) and DC (0.7%).
- Top languages spoken are English (62.6%) followed by Spanish (11.9%).
- A significant demographic segment is the Post-2000s (Gen Z/Alpha) group, representing 50% of guests.
Recommendations for Hosts
- Target domestic marketing efforts towards travelers from New York and Boston.
- Tailor amenities and listing descriptions to appeal to the dominant Post-2000s (Gen Z/Alpha) demographic (e.g., highlight fast WiFi, smart home features, local guides).
- Highlight unique local experiences or amenities relevant to the primary guest profile.
- Consider seasonal promotions aligned with peak travel times for key origin markets.
Nearby Short-Term Rental Market Comparison
How does the Stratton Airbnb market stack up against its neighbors? Compare key performance metrics like average monthly revenue, ADR, and occupancy rates in surrounding areas to understand the broader regional STR landscape.
| Market | Active Properties | Monthly Revenue | Daily Rate | Avg. Occupancy |
|---|---|---|---|---|
| Middletown Springs | 13 | $6,843 | $507.55 | 32% |
| Pomfret | 15 | $6,549 | $502.74 | 45% |
| Fort Ann | 35 | $6,238 | $790.41 | 37% |
| Hanover | 33 | $5,826 | $1189.51 | 41% |
| North Andover | 12 | $5,625 | $440.84 | 45% |
| Town of Ancram | 22 | $5,616 | $512.55 | 38% |
| Wellesley | 22 | $5,310 | $520.90 | 50% |
| Town of Schodack | 11 | $5,158 | $555.89 | 29% |
| Town of Stillwater | 55 | $5,153 | $564.54 | 42% |
| Barnstead | 36 | $5,090 | $477.12 | 42% |