Stowe Airbnb Market Analysis 2026: Short Term Rental Data & Vacation Rental Statistics in Vermont, United States
Is Airbnb profitable in Stowe in 2026? Explore comprehensive Airbnb analytics for Stowe, Vermont, United States to uncover income potential. This 2026 STR market report for Stowe, based on AirROI data from February 2025 to January 2026, reveals key trends in the market of 875 active listings.
Whether you're considering an Airbnb investment in Stowe, optimizing your existing vacation rental, or exploring rental arbitrage opportunities, understanding the Stowe Airbnb data is crucial. Understanding the local regulations is key to maximizing your short term rental income potential. Let's dive into the specifics.
Key Stowe Airbnb Performance Metrics Overview
Monthly Airbnb Revenue Variations & Income Potential in Stowe (2026)
Understanding the monthly revenue variations for Airbnb listings in Stowe is key to maximizing your short term rental income potential. Seasonality significantly impacts earnings. Our analysis, based on data from the past 12 months, shows that the peak revenue month for STRs in Stowe is typically February, while April often presents the lowest earnings, highlighting opportunities for strategic pricing adjustments during shoulder and low seasons. Explore the typical Airbnb income in Stowe across different performance tiers:
- Best-in-class properties (Top 10%) achieve $12,437+ monthly, often utilizing dynamic pricing and superior guest experiences.
- Strong performing properties (Top 25%) earn $7,543 or more, indicating effective management and desirable locations/amenities.
- Typical properties (Median) generate around $4,309 per month, representing the average market performance.
- Entry-level properties (Bottom 25%) see earnings around $2,352, often with potential for optimization.
Average Monthly Airbnb Earnings Trend in Stowe
Stowe Airbnb Occupancy Rate Trends (2026)
Maximize your bookings by understanding the Stowe STR occupancy trends. Seasonal demand shifts significantly influence how often properties are booked. Typically, Februarysees the highest demand (peak season occupancy), while May experiences the lowest (low season). Effective strategies, like adjusting minimum stays or offering promotions, can boost occupancy during slower periods. Here's how different property tiers perform in Stowe:
- Best-in-class properties (Top 10%) achieve 74%+ occupancy, indicating high desirability and potentially optimized availability.
- Strong performing properties (Top 25%) maintain 57% or higher occupancy, suggesting good market fit and guest satisfaction.
- Typical properties (Median) have an occupancy rate around 36%.
- Entry-level properties (Bottom 25%) average 21% occupancy, potentially facing higher vacancy.
Average Monthly Occupancy Rate Trend in Stowe
Average Daily Rate (ADR) Airbnb Trends in Stowe (2026)
Effective short term rental pricing strategy in Stowe involves understanding monthly ADR fluctuations. The Average Daily Rate (ADR) for Airbnb in Stowe typically peaks in December and dips lowest during April. Leveraging Airbnb dynamic pricing tools or strategies based on this seasonality can significantly boost revenue. Here's a look at the typical nightly rates achieved:
- Best-in-class properties (Top 10%) command rates of $1,008+ per night, often due to premium features or locations.
- Strong performing properties (Top 25%) achieve nightly rates of $641 or more.
- Typical properties (Median) charge around $406 per night.
- Entry-level properties (Bottom 25%) earn around $267 per night.
Average Daily Rate (ADR) Trend by Month in Stowe
Get Live Stowe Market Intelligence 👇

Explore Real-time Analytics
Airbnb Seasonality Analysis & Trends in Stowe (2026)
Peak Season (February, March, December)
- Revenue averages $8,347 per month
- Occupancy rates average 49.3%
- Daily rates average $586
Shoulder Season
- Revenue averages $5,917 per month
- Occupancy maintains around 40.0%
- Daily rates hold near $536
Low Season (April, May, June)
- Revenue drops to average $3,468 per month
- Occupancy decreases to average 29.0%
- Daily rates adjust to average $453
Seasonality Insights for Stowe
- The Airbnb seasonality in Stowe shows highly seasonal trends requiring careful strategy. While the sections above show seasonal averages, it's also insightful to look at the extremes:
- During the high season, the absolute peak month showcases Stowe's highest earning potential, with monthly revenues capable of climbing to $10,044, occupancy reaching a high of 61.4%, and ADRs peaking at $651.
- Conversely, the slowest single month of the year, typically falling within the low season, marks the market's lowest point. In this month, revenue might dip to $3,189, occupancy could drop to 27.2%, and ADRs may adjust down to $442.
- Understanding both the seasonal averages and these monthly peaks and troughs in revenue, occupancy, and ADR is crucial for maximizing your Airbnb profit potential in Stowe.
Seasonal Strategies for Maximizing Profit
- Peak Season: Maximize revenue through premium pricing and potentially longer minimum stays. Ensure high availability.
- Low Season: Offer competitive pricing, special promotions (e.g., extended stay discounts), and flexible cancellation policies. Target off-season travelers like remote workers or budget-conscious guests.
- Shoulder Seasons: Implement dynamic pricing that balances peak and low rates. Target weekend travelers or specific events. Offer slightly more flexible terms than peak season.
- Regularly analyze your own performance against these Stowe seasonality benchmarks and adjust your pricing and availability strategy accordingly.
Best Areas for Airbnb Investment in Stowe (2026)
Exploring the top neighborhoods for short-term rentals in Stowe? This section highlights key areas, outlining why they are attractive for hosts and guests, along with notable local attractions. Consider these locations based on your target guest profile and investment strategy.
| Neighborhood / Area | Why Host Here? (Target Guests & Appeal) | Key Attractions & Landmarks |
|---|---|---|
| Stowe Village | The heart of Stowe, known for its charming main street filled with shops, restaurants, and local attractions. Ideal for visitors looking for a vibrant town atmosphere close to skiing and other outdoor activities. | Stowe Mountain Resort, Stowe Recreation Path, Local shops and boutiques, Alchemist Brewery, Trapp Family Lodge |
| Mount Mansfield | Home to Vermont's highest peak, Mount Mansfield offers stunning views and outdoor activities year-round. Perfect for nature lovers and adventure seekers. | Mount Mansfield, Mansfield State Forest, Hiking trails, Skiing in winter, Scenic vistas |
| Stowe Mountain Resort | A world-renowned ski resort that attracts visitors from all over seeking winter sports and summer activities. A prime location for year-round tourist rentals. | Skiing and snowboarding, Snowshoeing, Mountain biking, Golf courses, Spa and wellness centers |
| Smugglers' Notch | Famous for its picturesque mountain setting and outdoor recreation, particularly for families seeking fun activities. Ideal for year-round Airbnb hosting. | Smugglers' Notch Ski Resort, Hiking trails, Outdoor adventures, Family-friendly activities, Scenic drives |
| Waterbury | A charming village near Stowe with great restaurants and breweries. Offers a quieter option for visitors while still being close to Stowe's attractions. | Ben & Jerry's Factory, Waterbury Reservoir, Local dining options, Hiking trails, Craft breweries |
| Cambridge | A quaint community with access to nature and outdoor activities. It attracts visitors seeking a peaceful and scenic stay away from the busier areas. | Crispin Hill, Lamoille River, Outdoor recreation, Local farms, Scenic views |
| Stowe Hollow | A serene area that offers beautiful landscapes and a quieter atmosphere, great for nature retreats and relaxation. | Stowe Hollow Road, Scenic views, Hiking trails, Nature walks, Cabin rentals |
| Morrisville | A nearby town that provides a mix of local charm and proximity to Stowe, with affordability and local attractions. | Local shops, Morrisville Historical Society, Hiking trails, Lamoille Rail Trail, Community events |
Understanding Airbnb License Requirements & STR Laws in Stowe (2026)
With 10% of listings showing registration in 2026, understanding potential Airbnb license requirements is crucial in Stowe. Always verify the latest short term rental regulations and Airbnb license requirements directly with local government authorities for Stowe to ensure full compliance before hosting.
(Source: AirROI data, 2026, based on 10% licensed listings)
Top Performing Airbnb Properties in Stowe (2026)
Benchmark your potential! Explore examples of top-performing Airbnb properties in Stowebased on Trailing Twelve Month (TTM) revenue. Analyze their characteristics, revenue, occupancy rate, and ADR to understand what drives success in this market.
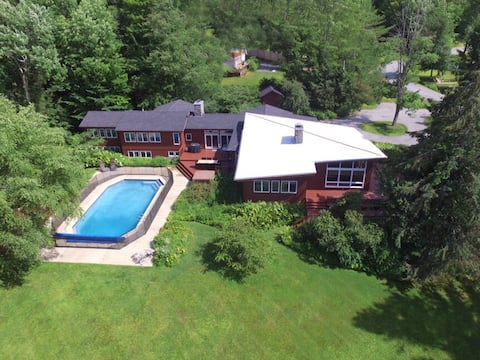
Spacious Mountain View Home - Hot Tub, Pool, Gym
Entire Place • 8 bedrooms
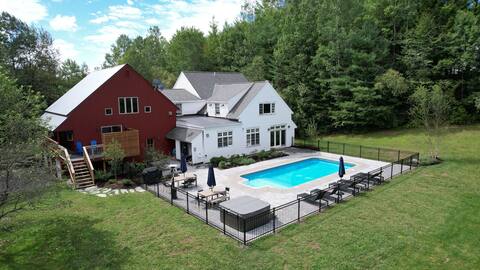
"Basecamp"- Large multi-Family Property
Entire Place • 6 bedrooms

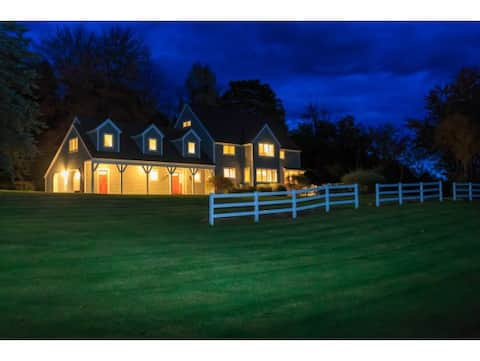
The Seven Springs Mansion at Stowe
Entire Place • 7 bedrooms
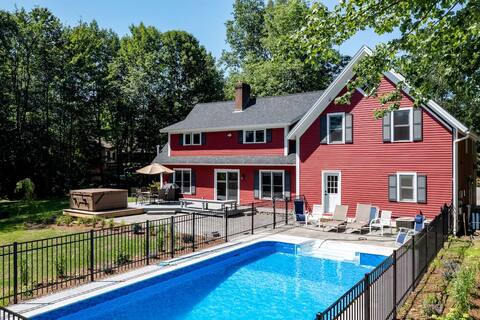
Heart of Stowe Home: 2 ensuites Sauna & Game Room
Entire Place • 7 bedrooms

Lush Stowe Townhomes | Near Downtown
Entire Place • 10 bedrooms
Expansive Stowe home, amazing location and hot tub
Entire Place • 6 bedrooms
Note: Performance varies based on location, size, amenities, seasonality, and management quality. Data reflects the past 12 months.
Top Performing Airbnb Hosts in Stowe (2026)
Learn from the best! This table showcases top-performing Airbnb hosts in Stowe based on the number of properties managed and estimated total revenue over the past year. Analyze their scale and performance metrics.
| Host Name | Properties | Grossing Revenue | Stay Reviews | Avg Rating |
|---|---|---|---|---|
| Rebecca And Blake | 94 | $4,840,421 | 4341 | 4.88/5.0 |
| Stowe Mountain Rentals | 53 | $3,377,573 | 4300 | 4.91/5.0 |
| Stowe Resort Homes | 44 | $2,286,679 | 1229 | 4.89/5.0 |
| Alison B | 54 | $1,747,374 | 365 | 4.62/5.0 |
| Heirloom | 13 | $1,434,863 | 297 | 4.94/5.0 |
| Spruce Peak | 15 | $1,211,503 | 50 | 4.91/5.0 |
| Jayla | 11 | $1,029,873 | 435 | 4.96/5.0 |
| Kimberly | 17 | $877,735 | 409 | 4.88/5.0 |
| Rachel And Cam | 6 | $667,954 | 690 | 4.99/5.0 |
| Ryan | 6 | $588,582 | 1441 | 4.94/5.0 |
Analyzing the strategies of top hosts, such as their property selection, pricing, and guest communication, can offer valuable lessons for optimizing your own Airbnb operations in Stowe.
Dive Deeper: Advanced Stowe STR Market Data (2026)
Ready to unlock more insights? AirROI provides access to advanced metrics and comprehensive Airbnb data for Stowe. Explore detailed analytics beyond this report to refine your investment strategy, optimize pricing, and maximize your vacation rental profits.
Explore Advanced MetricsStowe Short-Term Rental Market Composition (2026): Property & Room Types
Room Type Distribution
Property Type Distribution
Market Composition Insights for Stowe
- The Stowe Airbnb market composition is heavily skewed towards Entire Home/Apt listings, which make up 93.9% of the 875 active rentals. This indicates strong guest preference for privacy and space.
- Looking at the property type distribution in Stowe, House properties are the most common (55.5%), reflecting the local real estate landscape.
- Houses represent a significant 55.5% portion, catering likely to families or larger groups.
- The presence of 5.3% Hotel/Boutique listings indicates integration with traditional hospitality.
- Smaller segments like outdoor/unique, others, unique stays (combined 4.6%) offer potential for unique stay experiences.
Stowe Airbnb Room Capacity Analysis (2026): Bedroom Distribution
Distribution of Listings by Number of Bedrooms
Room Capacity Insights for Stowe
- The dominant room capacity in Stowe is 2 bedrooms listings, making up 24.8% of the market. This suggests a strong demand for properties suitable for couples or solo travelers.
- Together, 2 bedrooms and 3 bedrooms properties represent 47.8% of the active Airbnb listings in Stowe, indicating a high concentration in these sizes.
- A significant 47.7% of listings offer 3+ bedrooms, catering to larger groups and families seeking more space in Stowe.
Stowe Vacation Rental Guest Capacity Trends (2026)
Distribution of Listings by Guest Capacity
Guest Capacity Insights for Stowe
- The most common guest capacity trend in Stowe vacation rentals is listings accommodating 8+ guests (37.7%). This suggests the primary traveler segment is likely larger groups.
- Properties designed for 8+ guests and 4 guests dominate the Stowe STR market, accounting for 58.8% of listings.
- 59.4% of properties accommodate 6+ guests, serving the market segment for larger families or group travel in Stowe.
- On average, properties in Stowe are equipped to host 5.8 guests.
Stowe Airbnb Booking Patterns (2026): Available vs. Booked Days
Available Days Distribution
Booked Days Distribution
Booking Pattern Insights for Stowe
- The most common availability pattern in Stowe falls within the 271-366 days range, representing 46.2% of listings. This suggests many properties have significant open periods on their calendars.
- Approximately 85.9% of listings show high availability (181+ days open annually), indicating potential for increased bookings or specific owner usage patterns.
- For booked days, the 91-180 days range is most frequent in Stowe (40.7%), reflecting common guest stay durations or potential owner blocking patterns.
- A notable 15.1% of properties secure long booking periods (181+ days booked per year), highlighting successful long-term rental strategies or significant owner usage.
Stowe Airbnb Minimum Stay Requirements Analysis
Distribution of Listings by Minimum Night Requirement
1 Night
79 listings
9% of total
2 Nights
296 listings
33.8% of total
3 Nights
65 listings
7.4% of total
4-6 Nights
18 listings
2.1% of total
7-29 Nights
26 listings
3% of total
30+ Nights
391 listings
44.7% of total
Key Insights
- The most prevalent minimum stay requirement in Stowe is 30+ Nights, adopted by 44.7% of listings. This highlights the market's preference for longer commitments.
- A significant segment (44.7%) caters to monthly stays (30+ nights) in Stowe, pointing to opportunities in the extended-stay market.
Recommendations
- Align with the market by considering a 30+ Nights minimum stay, as 44.7% of Stowe hosts use this setting.
- If feasible, allowing 1-night stays, especially midweek or during low season, could capture last-minute bookings, as only 9% currently do.
- A 2-night minimum appears standard (33.8%). Consider this for weekends or peak periods.
- Explore offering discounts for stays of 30+ nights to attract the 44.7% of the market seeking extended stays.
- Adjust minimum nights based on seasonality – potentially shorter during low season and longer during peak demand periods in Stowe.
Stowe Airbnb Cancellation Policy Trends Analysis (2026)
Limited
20 listings
2.3% of total
Super Strict 60 Days
4 listings
0.5% of total
Super Strict 30 Days
90 listings
10.3% of total
Flexible
33 listings
3.8% of total
Moderate
121 listings
13.9% of total
Firm
416 listings
47.7% of total
Strict
188 listings
21.6% of total
Cancellation Policy Insights for Stowe
- The prevailing Airbnb cancellation policy trend in Stowe is Firm, used by 47.7% of listings.
- A majority (69.3%) of hosts in Stowe utilize Firm or Strict policies, indicating a market where hosts prioritize booking security.
Recommendations for Hosts
- Consider adopting a Firm policy to align with the 47.7% market standard in Stowe.
- Regularly review your cancellation policy against competitors and market demand shifts in Stowe.
Stowe STR Booking Lead Time Analysis (2026)
Average Booking Lead Time by Month
Booking Lead Time Insights for Stowe
- The overall average booking lead time for vacation rentals in Stowe is 59 days.
- Guests book furthest in advance for stays during February (average 75 days), likely coinciding with peak travel demand or local events.
- The shortest booking windows occur for stays in November (average 40 days), indicating more last-minute travel plans during this time.
- Seasonally, Winter (68 days avg.) sees the longest lead times, while Spring (47 days avg.) has the shortest, reflecting typical travel planning cycles.
Recommendations for Hosts
- Use the overall average lead time (59 days) as a baseline for your pricing and availability strategy in Stowe.
- For February stays, consider implementing length-of-stay discounts or slightly higher rates for bookings made less than 75 days out to capitalize on advance planning.
- Target marketing efforts for the Winter season well in advance (at least 68 days) to capture early planners.
- Monitor your own booking lead times against these Stowe averages to identify opportunities for dynamic pricing adjustments.
Popular & Essential Airbnb Amenities in Stowe (2026)
Amenity Prevalence
Amenity Insights for Stowe
- Essential amenities in Stowe that guests expect include: Wifi, Smoke alarm, Carbon monoxide alarm, Heating, Free parking on premises, TV, Fire extinguisher. Lacking these (any) could significantly impact bookings.
- Popular amenities like Hot water, Coffee maker, Kitchen are common but not universal. Offering these can provide a competitive edge.
Recommendations for Hosts
- Ensure your listing includes all essential amenities for Stowe: Wifi, Smoke alarm, Carbon monoxide alarm, Heating, Free parking on premises, TV, Fire extinguisher.
- Prioritize adding missing essentials: Wifi, Smoke alarm, Carbon monoxide alarm, Heating, Free parking on premises, TV, Fire extinguisher.
- Consider adding popular differentiators like Hot water or Coffee maker to increase appeal.
- Highlight unique or less common amenities you offer (e.g., hot tub, dedicated workspace, EV charger) in your listing description and photos.
- Regularly check competitor amenities in Stowe to stay competitive.
Stowe Airbnb Guest Demographics & Profile Analysis (2026)
Guest Profile Summary for Stowe
- The typical guest profile for Airbnb in Stowe consists of primarily domestic travelers (94%), often arriving from nearby New York, typically belonging to the Post-2000s (Gen Z/Alpha) group (50%), primarily speaking English or Spanish.
- Domestic travelers account for 94.3% of guests.
- Key international markets include United States (94.3%) and Canada (1.3%).
- Top languages spoken are English (68.9%) followed by Spanish (11%).
- A significant demographic segment is the Post-2000s (Gen Z/Alpha) group, representing 50% of guests.
Recommendations for Hosts
- Target domestic marketing efforts towards travelers from New York and Boston.
- Tailor amenities and listing descriptions to appeal to the dominant Post-2000s (Gen Z/Alpha) demographic (e.g., highlight fast WiFi, smart home features, local guides).
- Highlight unique local experiences or amenities relevant to the primary guest profile.
- Consider seasonal promotions aligned with peak travel times for key origin markets.
Nearby Short-Term Rental Market Comparison
How does the Stowe Airbnb market stack up against its neighbors? Compare key performance metrics like average monthly revenue, ADR, and occupancy rates in surrounding areas to understand the broader regional STR landscape.
| Market | Active Properties | Monthly Revenue | Daily Rate | Avg. Occupancy |
|---|---|---|---|---|
| Middletown Springs | 13 | $6,843 | $507.55 | 32% |
| Pomfret | 15 | $6,549 | $502.74 | 45% |
| Fort Ann | 35 | $6,238 | $790.41 | 37% |
| Hanover | 33 | $5,826 | $1189.51 | 41% |
| Barnstead | 36 | $5,090 | $477.12 | 42% |
| Goffstown | 13 | $5,066 | $343.72 | 53% |
| Malletts Bay | 51 | $4,842 | $444.86 | 41% |
| Town of Wilton | 103 | $4,841 | $862.83 | 38% |
| Jefferson | 28 | $4,793 | $474.72 | 40% |
| Wilmot | 11 | $4,667 | $334.67 | 51% |