Shelburne Airbnb Market Analysis 2026: Short Term Rental Data & Vacation Rental Statistics in Vermont, United States
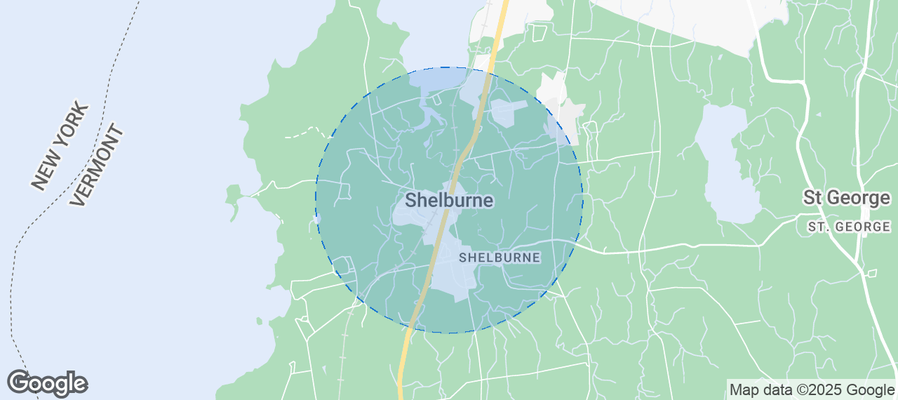
Is Airbnb profitable in Shelburne in 2026? Explore comprehensive Airbnb analytics for Shelburne, Vermont, United States to uncover income potential. This 2026 STR market report for Shelburne, based on AirROI data from February 2025 to January 2026, reveals key trends in the niche market of 36 active listings.
Whether you're considering an Airbnb investment in Shelburne, optimizing your existing vacation rental, or exploring rental arbitrage opportunities, understanding the Shelburne Airbnb data is crucial. Understanding the local regulations is key to maximizing your short term rental income potential. Let's dive into the specifics.
Key Shelburne Airbnb Performance Metrics Overview
Monthly Airbnb Revenue Variations & Income Potential in Shelburne (2026)
Understanding the monthly revenue variations for Airbnb listings in Shelburne is key to maximizing your short term rental income potential. Seasonality significantly impacts earnings. Our analysis, based on data from the past 12 months, shows that the peak revenue month for STRs in Shelburne is typically July, while January often presents the lowest earnings, highlighting opportunities for strategic pricing adjustments during shoulder and low seasons. Explore the typical Airbnb income in Shelburne across different performance tiers:
- Best-in-class properties (Top 10%) achieve $6,638+ monthly, often utilizing dynamic pricing and superior guest experiences.
- Strong performing properties (Top 25%) earn $4,020 or more, indicating effective management and desirable locations/amenities.
- Typical properties (Median) generate around $2,764 per month, representing the average market performance.
- Entry-level properties (Bottom 25%) see earnings around $1,677, often with potential for optimization.
Average Monthly Airbnb Earnings Trend in Shelburne
Shelburne Airbnb Occupancy Rate Trends (2026)
Maximize your bookings by understanding the Shelburne STR occupancy trends. Seasonal demand shifts significantly influence how often properties are booked. Typically, Julysees the highest demand (peak season occupancy), while January experiences the lowest (low season). Effective strategies, like adjusting minimum stays or offering promotions, can boost occupancy during slower periods. Here's how different property tiers perform in Shelburne:
- Best-in-class properties (Top 10%) achieve 81%+ occupancy, indicating high desirability and potentially optimized availability.
- Strong performing properties (Top 25%) maintain 67% or higher occupancy, suggesting good market fit and guest satisfaction.
- Typical properties (Median) have an occupancy rate around 46%.
- Entry-level properties (Bottom 25%) average 28% occupancy, potentially facing higher vacancy.
Average Monthly Occupancy Rate Trend in Shelburne
Average Daily Rate (ADR) Airbnb Trends in Shelburne (2026)
Effective short term rental pricing strategy in Shelburne involves understanding monthly ADR fluctuations. The Average Daily Rate (ADR) for Airbnb in Shelburne typically peaks in August and dips lowest during March. Leveraging Airbnb dynamic pricing tools or strategies based on this seasonality can significantly boost revenue. Here's a look at the typical nightly rates achieved:
- Best-in-class properties (Top 10%) command rates of $384+ per night, often due to premium features or locations.
- Strong performing properties (Top 25%) achieve nightly rates of $291 or more.
- Typical properties (Median) charge around $191 per night.
- Entry-level properties (Bottom 25%) earn around $147 per night.
Average Daily Rate (ADR) Trend by Month in Shelburne
Get Live Shelburne Market Intelligence 👇
Explore Real-time Analytics
Airbnb Seasonality Analysis & Trends in Shelburne (2026)
Peak Season (July, August, November)
- Revenue averages $4,813 per month
- Occupancy rates average 59.6%
- Daily rates average $251
Shoulder Season
- Revenue averages $3,384 per month
- Occupancy maintains around 48.9%
- Daily rates hold near $243
Low Season (January, March, April)
- Revenue drops to average $1,846 per month
- Occupancy decreases to average 34.7%
- Daily rates adjust to average $224
Seasonality Insights for Shelburne
- The Airbnb seasonality in Shelburne shows highly seasonal trends requiring careful strategy. While the sections above show seasonal averages, it's also insightful to look at the extremes:
- During the high season, the absolute peak month showcases Shelburne's highest earning potential, with monthly revenues capable of climbing to $5,178, occupancy reaching a high of 62.6%, and ADRs peaking at $256.
- Conversely, the slowest single month of the year, typically falling within the low season, marks the market's lowest point. In this month, revenue might dip to $1,622, occupancy could drop to 31.2%, and ADRs may adjust down to $219.
- Understanding both the seasonal averages and these monthly peaks and troughs in revenue, occupancy, and ADR is crucial for maximizing your Airbnb profit potential in Shelburne.
Seasonal Strategies for Maximizing Profit
- Peak Season: Maximize revenue through premium pricing and potentially longer minimum stays. Ensure high availability.
- Low Season: Offer competitive pricing, special promotions (e.g., extended stay discounts), and flexible cancellation policies. Target off-season travelers like remote workers or budget-conscious guests.
- Shoulder Seasons: Implement dynamic pricing that balances peak and low rates. Target weekend travelers or specific events. Offer slightly more flexible terms than peak season.
- Regularly analyze your own performance against these Shelburne seasonality benchmarks and adjust your pricing and availability strategy accordingly.
Best Areas for Airbnb Investment in Shelburne (2026)
Exploring the top neighborhoods for short-term rentals in Shelburne? This section highlights key areas, outlining why they are attractive for hosts and guests, along with notable local attractions. Consider these locations based on your target guest profile and investment strategy.
| Neighborhood / Area | Why Host Here? (Target Guests & Appeal) | Key Attractions & Landmarks |
|---|---|---|
| Shelburne Village | Charming small-town atmosphere with easy access to local shops, restaurants, and the scenic shores of Lake Champlain. Ideal for families and couples seeking a quiet getaway. | Shelburne Museum, Shelburne Farms, Lake Champlain, Shelburne Vineyards, Tiroler Alps Restaurant, Local Craft Shops |
| Lake Champlain Waterfront | Stunning views of the lake and mountains, offering outdoor activities such as boating, fishing, and hiking. Popular with nature lovers and outdoor enthusiasts. | Waterfront Park, Lake Champlain Ferry, Biking Trails, Shelburne Bay Park, Sunset Cruises |
| Shelburne Farms | A working farm and education center that offers unique experiences related to agriculture, sustainability, and the environment. Great for eco-tourists and families. | Shelburne Farms Tours, Farm to Table Dining, Cheese-making Workshops, Walking Trails |
| Route 7 Corridor | The main commercial area with shops, restaurants, and easy access to attractions in both Shelburne and nearby Burlington. Great for travelers looking for convenience. | Shopping Centers, Local Diners, Burlington Mall, Outdoor Retail Stores |
| Shelburne Pond | A serene natural area perfect for fishing, kayaking, and bird watching. Ideal for those looking for a peaceful retreat in nature. | Shelburne Pond, Bird Watching, Kayaking, Nature Trails |
| Marina Bay | A vibrant area with marinas and waterfront activities. Perfect for those who enjoy boating and water sports. | Boat Rentals, Fishing Charters, Waterfront Restaurants, Scenic Walks |
| Nearby Burlington | Just a short drive away, Burlington offers a vibrant downtown with shopping, dining, and cultural events. Attracts a wider range of visitors looking for city amenities. | Church Street Marketplace, Burlington Arts District, Farms Market, Burlington Beer Company |
| Overlook Park | A tranquil park that provides beautiful views of Lake Champlain and the Green Mountains. A great spot for picnics and family outings. | Picnic Areas, Walking Paths, Scenic Overlook |
Understanding Airbnb License Requirements & STR Laws in Shelburne (2026)
With 14% of listings showing registration in 2026, understanding potential Airbnb license requirements is crucial in Shelburne. Always verify the latest short term rental regulations and Airbnb license requirements directly with local government authorities for Shelburne to ensure full compliance before hosting.
(Source: AirROI data, 2026, based on 14% licensed listings)
Top Performing Airbnb Properties in Shelburne (2026)
Benchmark your potential! Explore examples of top-performing Airbnb properties in Shelburnebased on Trailing Twelve Month (TTM) revenue. Analyze their characteristics, revenue, occupancy rate, and ADR to understand what drives success in this market.
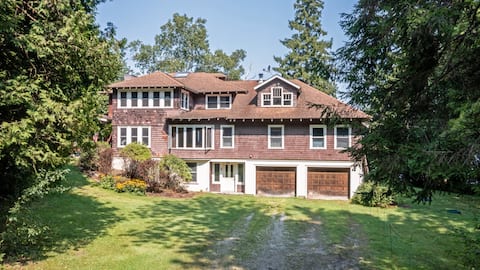
Camp Roosevelt on Lake Champlain
Entire Place • 5 bedrooms

Spectacular, convenient, and plenty of room.
Entire Place • 5 bedrooms
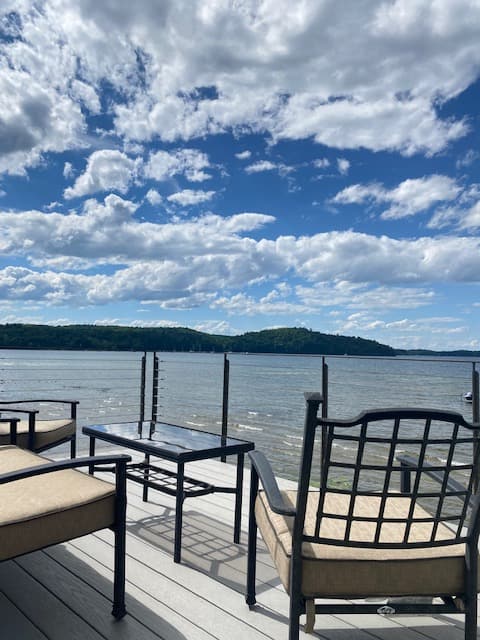
Shelburne Bay Waterfront Getaway
Entire Place • 1 bedroom
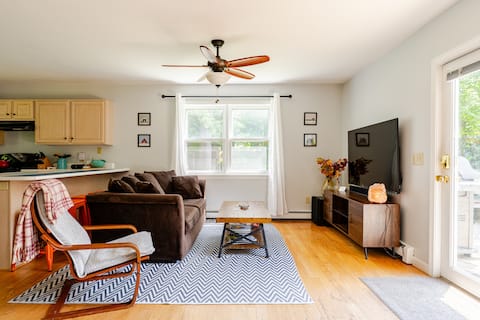
Private Spacious 2 Bedroom 2 Full Bath Guest Suite
Entire Place • 2 bedrooms

The 1865 Carriage Barn - Cozy w/Fireplace & Sauna
Entire Place • 2 bedrooms
Shelburne Bayside Apartment
Entire Place • 2 bedrooms
Note: Performance varies based on location, size, amenities, seasonality, and management quality. Data reflects the past 12 months.
Top Performing Airbnb Hosts in Shelburne (2026)
Learn from the best! This table showcases top-performing Airbnb hosts in Shelburne based on the number of properties managed and estimated total revenue over the past year. Analyze their scale and performance metrics.
| Host Name | Properties | Grossing Revenue | Stay Reviews | Avg Rating |
|---|---|---|---|---|
| SkyRun Vermont | 1 | $109,913 | 15 | 4.60/5.0 |
| Anne | 1 | $90,261 | 19 | 4.95/5.0 |
| Christopher | 3 | $87,817 | 255 | 4.87/5.0 |
| Debora | 2 | $85,676 | 376 | 4.98/5.0 |
| Brian | 1 | $73,058 | 38 | 5.00/5.0 |
| Dan | 1 | $49,295 | 143 | 4.99/5.0 |
| James | 1 | $48,110 | 95 | 4.97/5.0 |
| Anatoly | 4 | $42,060 | 16 | 4.88/5.0 |
| Alissa | 1 | $39,676 | 22 | 4.86/5.0 |
| Tamarah | 1 | $39,401 | 96 | 4.99/5.0 |
Analyzing the strategies of top hosts, such as their property selection, pricing, and guest communication, can offer valuable lessons for optimizing your own Airbnb operations in Shelburne.
Dive Deeper: Advanced Shelburne STR Market Data (2026)
Ready to unlock more insights? AirROI provides access to advanced metrics and comprehensive Airbnb data for Shelburne. Explore detailed analytics beyond this report to refine your investment strategy, optimize pricing, and maximize your vacation rental profits.
Explore Advanced MetricsShelburne Short-Term Rental Market Composition (2026): Property & Room Types
Room Type Distribution
Property Type Distribution
Market Composition Insights for Shelburne
- The Shelburne Airbnb market composition is heavily skewed towards Entire Home/Apt listings, which make up 75% of the 36 active rentals. This indicates strong guest preference for privacy and space.
- Looking at the property type distribution in Shelburne, House properties are the most common (44.4%), reflecting the local real estate landscape.
- Houses represent a significant 44.4% portion, catering likely to families or larger groups.
- The presence of 22.2% Hotel/Boutique listings indicates integration with traditional hospitality.
Shelburne Airbnb Room Capacity Analysis (2026): Bedroom Distribution
Distribution of Listings by Number of Bedrooms
Room Capacity Insights for Shelburne
- The dominant room capacity in Shelburne is 1 bedroom listings, making up 36.1% of the market. This suggests a strong demand for properties suitable for couples or solo travelers.
- Together, 1 bedroom and 2 bedrooms properties represent 58.3% of the active Airbnb listings in Shelburne, indicating a high concentration in these sizes.
Shelburne Vacation Rental Guest Capacity Trends (2026)
Distribution of Listings by Guest Capacity
Guest Capacity Insights for Shelburne
- The most common guest capacity trend in Shelburne vacation rentals is listings accommodating 4 guests (30.6%). This suggests the primary traveler segment is likely small families or groups.
- Properties designed for 4 guests and 2 guests dominate the Shelburne STR market, accounting for 58.4% of listings.
- 13.9% of properties accommodate 6+ guests, serving the market segment for larger families or group travel in Shelburne.
- On average, properties in Shelburne are equipped to host 3.1 guests.
Shelburne Airbnb Booking Patterns (2026): Available vs. Booked Days
Available Days Distribution
Booked Days Distribution
Booking Pattern Insights for Shelburne
- The most common availability pattern in Shelburne falls within the 271-366 days range, representing 36.1% of listings. This suggests many properties have significant open periods on their calendars.
- Approximately 66.7% of listings show high availability (181+ days open annually), indicating potential for increased bookings or specific owner usage patterns.
- For booked days, the 181-270 days range is most frequent in Shelburne (30.6%), reflecting common guest stay durations or potential owner blocking patterns.
- A notable 36.2% of properties secure long booking periods (181+ days booked per year), highlighting successful long-term rental strategies or significant owner usage.
Shelburne Airbnb Minimum Stay Requirements Analysis
Distribution of Listings by Minimum Night Requirement
1 Night
8 listings
22.2% of total
2 Nights
10 listings
27.8% of total
3 Nights
1 listings
2.8% of total
4-6 Nights
2 listings
5.6% of total
30+ Nights
15 listings
41.7% of total
Key Insights
- The most prevalent minimum stay requirement in Shelburne is 30+ Nights, adopted by 41.7% of listings. This highlights the market's preference for longer commitments.
- A significant segment (41.7%) caters to monthly stays (30+ nights) in Shelburne, pointing to opportunities in the extended-stay market.
Recommendations
- Align with the market by considering a 30+ Nights minimum stay, as 41.7% of Shelburne hosts use this setting.
- If feasible, allowing 1-night stays, especially midweek or during low season, could capture last-minute bookings, as only 22.2% currently do.
- Explore offering discounts for stays of 30+ nights to attract the 41.7% of the market seeking extended stays.
- Adjust minimum nights based on seasonality – potentially shorter during low season and longer during peak demand periods in Shelburne.
Shelburne Airbnb Cancellation Policy Trends Analysis (2026)
Super Strict 60 Days
4 listings
11.1% of total
Flexible
5 listings
13.9% of total
Moderate
7 listings
19.4% of total
Firm
18 listings
50% of total
Strict
2 listings
5.6% of total
Cancellation Policy Insights for Shelburne
- The prevailing Airbnb cancellation policy trend in Shelburne is Firm, used by 50% of listings.
- A majority (55.6%) of hosts in Shelburne utilize Firm or Strict policies, indicating a market where hosts prioritize booking security.
- Strict cancellation policies are quite rare (5.6%), potentially making listings with this policy less competitive unless justified by high demand or property type.
Recommendations for Hosts
- Consider adopting a Firm policy to align with the 50% market standard in Shelburne.
- Using a Strict policy might deter some guests, as only 5.6% of listings use it. Evaluate if potential revenue protection outweighs possible lower booking rates.
- Regularly review your cancellation policy against competitors and market demand shifts in Shelburne.
Shelburne STR Booking Lead Time Analysis (2026)
Average Booking Lead Time by Month
Booking Lead Time Insights for Shelburne
- The overall average booking lead time for vacation rentals in Shelburne is 51 days.
- Guests book furthest in advance for stays during May (average 88 days), likely coinciding with peak travel demand or local events.
- The shortest booking windows occur for stays in January (average 12 days), indicating more last-minute travel plans during this time.
- Seasonally, Summer (53 days avg.) sees the longest lead times, while Winter (27 days avg.) has the shortest, reflecting typical travel planning cycles.
Recommendations for Hosts
- Use the overall average lead time (51 days) as a baseline for your pricing and availability strategy in Shelburne.
- For May stays, consider implementing length-of-stay discounts or slightly higher rates for bookings made less than 88 days out to capitalize on advance planning.
- During January, focus on last-minute booking availability and promotions, as guests book with very short notice (12 days avg.).
- Target marketing efforts for the Summer season well in advance (at least 53 days) to capture early planners.
- Monitor your own booking lead times against these Shelburne averages to identify opportunities for dynamic pricing adjustments.
Popular & Essential Airbnb Amenities in Shelburne (2026)
Amenity Prevalence
Amenity Insights for Shelburne
- Essential amenities in Shelburne that guests expect include: Heating, Wifi. Lacking these (any) could significantly impact bookings.
- Popular amenities like Hot water, Free parking on premises, Smoke alarm are common but not universal. Offering these can provide a competitive edge.
Recommendations for Hosts
- Ensure your listing includes all essential amenities for Shelburne: Heating, Wifi.
- Prioritize adding missing essentials: Heating, Wifi.
- Consider adding popular differentiators like Hot water or Free parking on premises to increase appeal.
- Highlight unique or less common amenities you offer (e.g., hot tub, dedicated workspace, EV charger) in your listing description and photos.
- Regularly check competitor amenities in Shelburne to stay competitive.
Shelburne Airbnb Guest Demographics & Profile Analysis (2026)
Guest Profile Summary for Shelburne
- The typical guest profile for Airbnb in Shelburne consists of primarily domestic travelers (93%), often arriving from nearby New York, typically belonging to the Post-2000s (Gen Z/Alpha) group (50%), primarily speaking English or Spanish.
- Domestic travelers account for 93.1% of guests.
- Key international markets include United States (93.1%) and Canada (2.5%).
- Top languages spoken are English (65.6%) followed by Spanish (10.5%).
- A significant demographic segment is the Post-2000s (Gen Z/Alpha) group, representing 50% of guests.
Recommendations for Hosts
- Target domestic marketing efforts towards travelers from New York and Boston.
- Tailor amenities and listing descriptions to appeal to the dominant Post-2000s (Gen Z/Alpha) demographic (e.g., highlight fast WiFi, smart home features, local guides).
- Highlight unique local experiences or amenities relevant to the primary guest profile.
- Consider seasonal promotions aligned with peak travel times for key origin markets.
Nearby Short-Term Rental Market Comparison
How does the Shelburne Airbnb market stack up against its neighbors? Compare key performance metrics like average monthly revenue, ADR, and occupancy rates in surrounding areas to understand the broader regional STR landscape.
| Market | Active Properties | Monthly Revenue | Daily Rate | Avg. Occupancy |
|---|---|---|---|---|
| Middletown Springs | 13 | $6,843 | $507.55 | 32% |
| Pomfret | 15 | $6,549 | $502.74 | 45% |
| Fort Ann | 35 | $6,238 | $790.41 | 37% |
| Hanover | 33 | $5,826 | $1189.51 | 41% |
| Mille-Isles | 89 | $5,219 | $472.25 | 38% |
| Malletts Bay | 51 | $4,842 | $444.86 | 41% |
| Town of Wilton | 103 | $4,841 | $862.83 | 38% |
| Town of Bolton | 140 | $4,533 | $693.78 | 37% |
| Putnam Station | 14 | $4,483 | $512.24 | 42% |
| Stowe | 875 | $4,424 | $529.19 | 38% |