Saint Albans Town Airbnb Market Analysis 2026: Short Term Rental Data & Vacation Rental Statistics in Vermont, United States
Is Airbnb profitable in Saint Albans Town in 2026? Explore comprehensive Airbnb analytics for Saint Albans Town, Vermont, United States to uncover income potential. This 2026 STR market report for Saint Albans Town, based on AirROI data from February 2025 to January 2026, reveals key trends in the niche market of 32 active listings.
Whether you're considering an Airbnb investment in Saint Albans Town, optimizing your existing vacation rental, or exploring rental arbitrage opportunities, understanding the Saint Albans Town Airbnb data is crucial. Understanding the local regulations is key to maximizing your short term rental income potential. Let's dive into the specifics.
Key Saint Albans Town Airbnb Performance Metrics Overview
Monthly Airbnb Revenue Variations & Income Potential in Saint Albans Town (2026)
Understanding the monthly revenue variations for Airbnb listings in Saint Albans Town is key to maximizing your short term rental income potential. Seasonality significantly impacts earnings. Our analysis, based on data from the past 12 months, shows that the peak revenue month for STRs in Saint Albans Town is typically August, while February often presents the lowest earnings, highlighting opportunities for strategic pricing adjustments during shoulder and low seasons. Explore the typical Airbnb income in Saint Albans Town across different performance tiers:
- Best-in-class properties (Top 10%) achieve $8,958+ monthly, often utilizing dynamic pricing and superior guest experiences.
- Strong performing properties (Top 25%) earn $5,546 or more, indicating effective management and desirable locations/amenities.
- Typical properties (Median) generate around $3,191 per month, representing the average market performance.
- Entry-level properties (Bottom 25%) see earnings around $1,730, often with potential for optimization.
Average Monthly Airbnb Earnings Trend in Saint Albans Town
Saint Albans Town Airbnb Occupancy Rate Trends (2026)
Maximize your bookings by understanding the Saint Albans Town STR occupancy trends. Seasonal demand shifts significantly influence how often properties are booked. Typically, Augustsees the highest demand (peak season occupancy), while January experiences the lowest (low season). Effective strategies, like adjusting minimum stays or offering promotions, can boost occupancy during slower periods. Here's how different property tiers perform in Saint Albans Town:
- Best-in-class properties (Top 10%) achieve 82%+ occupancy, indicating high desirability and potentially optimized availability.
- Strong performing properties (Top 25%) maintain 64% or higher occupancy, suggesting good market fit and guest satisfaction.
- Typical properties (Median) have an occupancy rate around 41%.
- Entry-level properties (Bottom 25%) average 24% occupancy, potentially facing higher vacancy.
Average Monthly Occupancy Rate Trend in Saint Albans Town
Average Daily Rate (ADR) Airbnb Trends in Saint Albans Town (2026)
Effective short term rental pricing strategy in Saint Albans Town involves understanding monthly ADR fluctuations. The Average Daily Rate (ADR) for Airbnb in Saint Albans Town typically peaks in September and dips lowest during April. Leveraging Airbnb dynamic pricing tools or strategies based on this seasonality can significantly boost revenue. Here's a look at the typical nightly rates achieved:
- Best-in-class properties (Top 10%) command rates of $454+ per night, often due to premium features or locations.
- Strong performing properties (Top 25%) achieve nightly rates of $318 or more.
- Typical properties (Median) charge around $254 per night.
- Entry-level properties (Bottom 25%) earn around $184 per night.
Average Daily Rate (ADR) Trend by Month in Saint Albans Town
Get Live Saint Albans Town Market Intelligence 👇

Explore Real-time Analytics
Airbnb Seasonality Analysis & Trends in Saint Albans Town (2026)
Peak Season (August, July, September)
- Revenue averages $5,986 per month
- Occupancy rates average 58.1%
- Daily rates average $298
Shoulder Season
- Revenue averages $4,109 per month
- Occupancy maintains around 43.8%
- Daily rates hold near $291
Low Season (January, February, March)
- Revenue drops to average $2,875 per month
- Occupancy decreases to average 34.4%
- Daily rates adjust to average $270
Seasonality Insights for Saint Albans Town
- The Airbnb seasonality in Saint Albans Town shows highly seasonal trends requiring careful strategy. While the sections above show seasonal averages, it's also insightful to look at the extremes:
- During the high season, the absolute peak month showcases Saint Albans Town's highest earning potential, with monthly revenues capable of climbing to $7,072, occupancy reaching a high of 69.8%, and ADRs peaking at $313.
- Conversely, the slowest single month of the year, typically falling within the low season, marks the market's lowest point. In this month, revenue might dip to $2,718, occupancy could drop to 25.5%, and ADRs may adjust down to $251.
- Understanding both the seasonal averages and these monthly peaks and troughs in revenue, occupancy, and ADR is crucial for maximizing your Airbnb profit potential in Saint Albans Town.
Seasonal Strategies for Maximizing Profit
- Peak Season: Maximize revenue through premium pricing and potentially longer minimum stays. Ensure high availability.
- Low Season: Offer competitive pricing, special promotions (e.g., extended stay discounts), and flexible cancellation policies. Target off-season travelers like remote workers or budget-conscious guests.
- Shoulder Seasons: Implement dynamic pricing that balances peak and low rates. Target weekend travelers or specific events. Offer slightly more flexible terms than peak season.
- Regularly analyze your own performance against these Saint Albans Town seasonality benchmarks and adjust your pricing and availability strategy accordingly.
Best Areas for Airbnb Investment in Saint Albans Town (2026)
Exploring the top neighborhoods for short-term rentals in Saint Albans Town? This section highlights key areas, outlining why they are attractive for hosts and guests, along with notable local attractions. Consider these locations based on your target guest profile and investment strategy.
| Neighborhood / Area | Why Host Here? (Target Guests & Appeal) | Key Attractions & Landmarks |
|---|---|---|
| Downtown Saint Albans | The heart of Saint Albans, featuring shops, restaurants, and the historic downtown area. It appeals to both business travelers and tourists looking to explore local culture and dining. | Saint Albans Museum, The Hardwick Stone, Elegant Affairs, Fletcher Free Library, Mason Park |
| St Albans Bay | Picturesque bay area ideal for those looking to enjoy waterfront activities like boating and fishing. Great for families and nature enthusiasts, providing access to outdoor recreation. | Lake Champlain, St Albans Bay Park, Bike Path, Sand Bar State Park, Waterfront Walking Trails |
| Swanton | Just a short drive from Saint Albans, Swanton offers a quiet retreat with rural charm. A good option for guests looking to escape the city while still being close to amenities. | Missisquoi National Wildlife Refuge, Swanton Village, local farms, Lakeside Park |
| Fairfax | A peaceful area known for its small-town charm and family-friendly atmosphere. Ideal for visitors seeking tranquility and a taste of Vermont's rural lifestyle. | Fairfax Community Park, Lake Arrowhead, local craft markets |
| Georgia | Located north of Saint Albans, Georgia offers a balance between urban accessibility and rural charm. Perfect for guests looking for a quieter stay while being close to shopping. | Georgia State Forest, local breweries, Vermont Maple Outlet |
| Enosburg Falls | A quaint village providing a unique experience with historical homes and scenic landscapes. Good for those wanting a cozy and local experience in Vermont. | Enosburg Falls Museum, local eateries, scenic drives |
| Richford | This small village charm makes Richford appealing for guests wanting to explore the remote natural beauty of Vermont while still enjoying small-town hospitality. | Missisquoi River, local events, outdoor activities |
| Bakersfield | Known for its rural scenery and community events, Bakersfield can attract guests looking for a peaceful getaway in the countryside, surrounded by nature. | local farms, hiking trails, seasonal community activities |
Understanding Airbnb License Requirements & STR Laws in Saint Albans Town (2026)
With 13% of listings showing registration in 2026, understanding potential Airbnb license requirements is crucial in Saint Albans Town. Always verify the latest short term rental regulations and Airbnb license requirements directly with local government authorities for Saint Albans Town to ensure full compliance before hosting.
(Source: AirROI data, 2026, based on 13% licensed listings)
Top Performing Airbnb Properties in Saint Albans Town (2026)
Benchmark your potential! Explore examples of top-performing Airbnb properties in Saint Albans Townbased on Trailing Twelve Month (TTM) revenue. Analyze their characteristics, revenue, occupancy rate, and ADR to understand what drives success in this market.

3 Sheds on the Lake - Lakefront Home
Entire Place • 5 bedrooms

Lake Champlain Home w/ Decks, Kayaks & Fire Pit!
Entire Place • 4 bedrooms
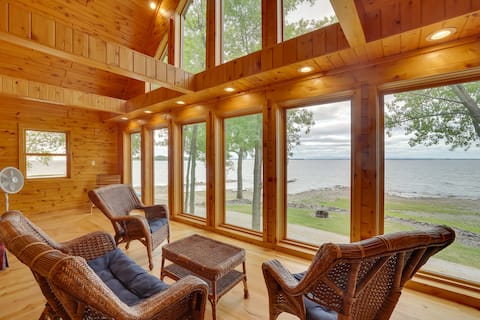
Lake Champlain Vacation Rental with Boat Dock!
Entire Place • 5 bedrooms
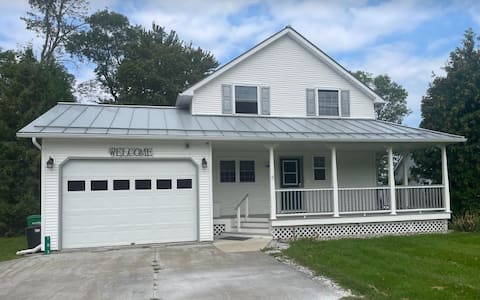
St Albans home on Lake Champlain
Entire Place • 3 bedrooms

Nease & Bradley Cottages on Lake Champlain
Entire Place • 7 bedrooms

Sunrise Lake House! Comfort-Hot Tub-Beach
Entire Place • 2 bedrooms
Note: Performance varies based on location, size, amenities, seasonality, and management quality. Data reflects the past 12 months.
Top Performing Airbnb Hosts in Saint Albans Town (2026)
Learn from the best! This table showcases top-performing Airbnb hosts in Saint Albans Town based on the number of properties managed and estimated total revenue over the past year. Analyze their scale and performance metrics.
| Host Name | Properties | Grossing Revenue | Stay Reviews | Avg Rating |
|---|---|---|---|---|
| Evolve | 4 | $204,252 | 103 | 4.77/5.0 |
| Michael | 1 | $145,599 | 46 | 4.98/5.0 |
| Jeremy | 2 | $105,328 | 52 | 4.99/5.0 |
| Kristin | 1 | $77,125 | 48 | 4.92/5.0 |
| Molly | 1 | $54,982 | 140 | 4.89/5.0 |
| Jennifer | 1 | $51,297 | 34 | 5.00/5.0 |
| Tonya | 1 | $49,151 | 176 | 4.89/5.0 |
| Robin | 1 | $46,753 | 39 | 4.90/5.0 |
| Chris | 1 | $42,040 | 239 | 4.88/5.0 |
| Heather | 1 | $36,225 | 58 | 4.83/5.0 |
Analyzing the strategies of top hosts, such as their property selection, pricing, and guest communication, can offer valuable lessons for optimizing your own Airbnb operations in Saint Albans Town.
Dive Deeper: Advanced Saint Albans Town STR Market Data (2026)
Ready to unlock more insights? AirROI provides access to advanced metrics and comprehensive Airbnb data for Saint Albans Town. Explore detailed analytics beyond this report to refine your investment strategy, optimize pricing, and maximize your vacation rental profits.
Explore Advanced MetricsSaint Albans Town Short-Term Rental Market Composition (2026): Property & Room Types
Room Type Distribution
Property Type Distribution
Market Composition Insights for Saint Albans Town
- The Saint Albans Town Airbnb market composition is heavily skewed towards Entire Home/Apt listings, which make up 96.9% of the 32 active rentals. This indicates strong guest preference for privacy and space.
- Looking at the property type distribution in Saint Albans Town, House properties are the most common (71.9%), reflecting the local real estate landscape.
- Houses represent a significant 71.9% portion, catering likely to families or larger groups.
- Smaller segments like hotel/boutique, others (combined 6.2%) offer potential for unique stay experiences.
Saint Albans Town Airbnb Room Capacity Analysis (2026): Bedroom Distribution
Distribution of Listings by Number of Bedrooms
Room Capacity Insights for Saint Albans Town
- The dominant room capacity in Saint Albans Town is 2 bedrooms listings, making up 28.1% of the market. This suggests a strong demand for properties suitable for couples or solo travelers.
- Together, 2 bedrooms and 3 bedrooms properties represent 53.1% of the active Airbnb listings in Saint Albans Town, indicating a high concentration in these sizes.
- A significant 46.9% of listings offer 3+ bedrooms, catering to larger groups and families seeking more space in Saint Albans Town.
Saint Albans Town Vacation Rental Guest Capacity Trends (2026)
Distribution of Listings by Guest Capacity
Guest Capacity Insights for Saint Albans Town
- The most common guest capacity trend in Saint Albans Town vacation rentals is listings accommodating 4 guests (28.1%). This suggests the primary traveler segment is likely small families or groups.
- Properties designed for 4 guests and 6 guests dominate the Saint Albans Town STR market, accounting for 53.1% of listings.
- 53.1% of properties accommodate 6+ guests, serving the market segment for larger families or group travel in Saint Albans Town.
- On average, properties in Saint Albans Town are equipped to host 5.3 guests.
Saint Albans Town Airbnb Booking Patterns (2026): Available vs. Booked Days
Available Days Distribution
Booked Days Distribution
Booking Pattern Insights for Saint Albans Town
- The most common availability pattern in Saint Albans Town falls within the 271-366 days range, representing 46.9% of listings. This suggests many properties have significant open periods on their calendars.
- Approximately 84.4% of listings show high availability (181+ days open annually), indicating potential for increased bookings or specific owner usage patterns.
- For booked days, the 91-180 days range is most frequent in Saint Albans Town (37.5%), reflecting common guest stay durations or potential owner blocking patterns.
- A notable 18.8% of properties secure long booking periods (181+ days booked per year), highlighting successful long-term rental strategies or significant owner usage.
Saint Albans Town Airbnb Minimum Stay Requirements Analysis
Distribution of Listings by Minimum Night Requirement
1 Night
3 listings
9.4% of total
2 Nights
8 listings
25% of total
3 Nights
3 listings
9.4% of total
4-6 Nights
1 listings
3.1% of total
30+ Nights
17 listings
53.1% of total
Key Insights
- The most prevalent minimum stay requirement in Saint Albans Town is 30+ Nights, adopted by 53.1% of listings. This highlights the market's preference for longer commitments.
- A significant segment (53.1%) caters to monthly stays (30+ nights) in Saint Albans Town, pointing to opportunities in the extended-stay market.
Recommendations
- Align with the market by considering a 30+ Nights minimum stay, as 53.1% of Saint Albans Town hosts use this setting.
- If feasible, allowing 1-night stays, especially midweek or during low season, could capture last-minute bookings, as only 9.4% currently do.
- Explore offering discounts for stays of 30+ nights to attract the 53.1% of the market seeking extended stays.
- Adjust minimum nights based on seasonality – potentially shorter during low season and longer during peak demand periods in Saint Albans Town.
Saint Albans Town Airbnb Cancellation Policy Trends Analysis (2026)
Super Strict 30 Days
1 listings
3.1% of total
Limited
1 listings
3.1% of total
Flexible
4 listings
12.5% of total
Moderate
7 listings
21.9% of total
Firm
8 listings
25% of total
Strict
11 listings
34.4% of total
Cancellation Policy Insights for Saint Albans Town
- The prevailing Airbnb cancellation policy trend in Saint Albans Town is Strict, used by 34.4% of listings.
- A majority (59.4%) of hosts in Saint Albans Town utilize Firm or Strict policies, indicating a market where hosts prioritize booking security.
Recommendations for Hosts
- Consider adopting a Strict policy to align with the 34.4% market standard in Saint Albans Town.
- With 34.4% using Strict terms, this is a viable option in Saint Albans Town, particularly for high-value properties or during peak demand periods.
- Regularly review your cancellation policy against competitors and market demand shifts in Saint Albans Town.
Saint Albans Town STR Booking Lead Time Analysis (2026)
Average Booking Lead Time by Month
Booking Lead Time Insights for Saint Albans Town
- The overall average booking lead time for vacation rentals in Saint Albans Town is 70 days.
- Guests book furthest in advance for stays during August (average 107 days), likely coinciding with peak travel demand or local events.
- The shortest booking windows occur for stays in January (average 31 days), indicating more last-minute travel plans during this time.
- Seasonally, Summer (100 days avg.) sees the longest lead times, while Winter (42 days avg.) has the shortest, reflecting typical travel planning cycles.
Recommendations for Hosts
- Use the overall average lead time (70 days) as a baseline for your pricing and availability strategy in Saint Albans Town.
- For August stays, consider implementing length-of-stay discounts or slightly higher rates for bookings made less than 107 days out to capitalize on advance planning.
- Target marketing efforts for the Summer season well in advance (at least 100 days) to capture early planners.
- Monitor your own booking lead times against these Saint Albans Town averages to identify opportunities for dynamic pricing adjustments.
Popular & Essential Airbnb Amenities in Saint Albans Town (2026)
Amenity Prevalence
Amenity Insights for Saint Albans Town
- Essential amenities in Saint Albans Town that guests expect include: Dishes and silverware, Kitchen, Smoke alarm, Free parking on premises, Fire extinguisher, Wifi, Cooking basics, Refrigerator, Hot water, Carbon monoxide alarm. Lacking these (any) could significantly impact bookings.
Recommendations for Hosts
- Ensure your listing includes all essential amenities for Saint Albans Town: Dishes and silverware, Kitchen, Smoke alarm, Free parking on premises, Fire extinguisher, Wifi, Cooking basics, Refrigerator, Hot water, Carbon monoxide alarm.
- Prioritize adding missing essentials: Wifi, Cooking basics, Refrigerator, Hot water, Carbon monoxide alarm.
- Highlight unique or less common amenities you offer (e.g., hot tub, dedicated workspace, EV charger) in your listing description and photos.
- Regularly check competitor amenities in Saint Albans Town to stay competitive.
Saint Albans Town Airbnb Guest Demographics & Profile Analysis (2026)
Guest Profile Summary for Saint Albans Town
- The typical guest profile for Airbnb in Saint Albans Town consists of primarily domestic travelers (96%), often arriving from nearby New York, typically belonging to the Post-2000s (Gen Z/Alpha) group (50%), primarily speaking English or French.
- Domestic travelers account for 95.9% of guests.
- Key international markets include United States (95.9%) and Canada (1%).
- Top languages spoken are English (80%) followed by French (6.7%).
- A significant demographic segment is the Post-2000s (Gen Z/Alpha) group, representing 50% of guests.
Recommendations for Hosts
- Target domestic marketing efforts towards travelers from New York and Boston.
- Tailor amenities and listing descriptions to appeal to the dominant Post-2000s (Gen Z/Alpha) demographic (e.g., highlight fast WiFi, smart home features, local guides).
- Highlight unique local experiences or amenities relevant to the primary guest profile.
- Consider seasonal promotions aligned with peak travel times for key origin markets.
Nearby Short-Term Rental Market Comparison
How does the Saint Albans Town Airbnb market stack up against its neighbors? Compare key performance metrics like average monthly revenue, ADR, and occupancy rates in surrounding areas to understand the broader regional STR landscape.
| Market | Active Properties | Monthly Revenue | Daily Rate | Avg. Occupancy |
|---|---|---|---|---|
| Middletown Springs | 13 | $6,843 | $507.55 | 32% |
| Pomfret | 15 | $6,549 | $502.74 | 45% |
| Fort Ann | 35 | $6,238 | $790.41 | 37% |
| Hanover | 33 | $5,826 | $1189.51 | 41% |
| Mille-Isles | 89 | $5,219 | $472.25 | 38% |
| Malletts Bay | 51 | $4,842 | $444.86 | 41% |
| Town of Wilton | 103 | $4,841 | $862.83 | 38% |
| Town of Bolton | 140 | $4,533 | $693.78 | 37% |
| Putnam Station | 14 | $4,483 | $512.24 | 42% |
| Stowe | 875 | $4,424 | $529.19 | 38% |