Ripton Airbnb Market Analysis 2026: Short Term Rental Data & Vacation Rental Statistics in Vermont, United States
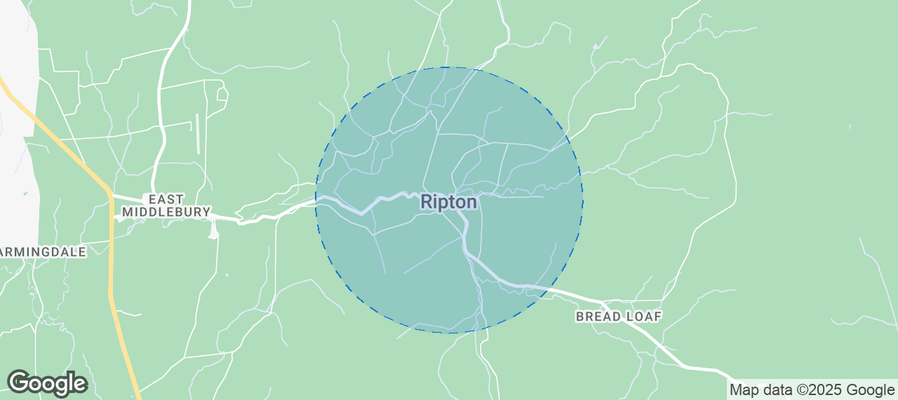
Is Airbnb profitable in Ripton in 2026? Explore comprehensive Airbnb analytics for Ripton, Vermont, United States to uncover income potential. This 2026 STR market report for Ripton, based on AirROI data from February 2025 to January 2026, reveals key trends in the niche market of 25 active listings.
Whether you're considering an Airbnb investment in Ripton, optimizing your existing vacation rental, or exploring rental arbitrage opportunities, understanding the Ripton Airbnb data is crucial. Navigating the high regulation landscape is key to maximizing your short term rental income potential. Let's dive into the specifics.
Key Ripton Airbnb Performance Metrics Overview
Monthly Airbnb Revenue Variations & Income Potential in Ripton (2026)
Understanding the monthly revenue variations for Airbnb listings in Ripton is key to maximizing your short term rental income potential. Seasonality significantly impacts earnings. Our analysis, based on data from the past 12 months, shows that the peak revenue month for STRs in Ripton is typically October, while April often presents the lowest earnings, highlighting opportunities for strategic pricing adjustments during shoulder and low seasons. Explore the typical Airbnb income in Ripton across different performance tiers:
- Best-in-class properties (Top 10%) achieve $7,887+ monthly, often utilizing dynamic pricing and superior guest experiences.
- Strong performing properties (Top 25%) earn $5,441 or more, indicating effective management and desirable locations/amenities.
- Typical properties (Median) generate around $3,097 per month, representing the average market performance.
- Entry-level properties (Bottom 25%) see earnings around $1,539, often with potential for optimization.
Average Monthly Airbnb Earnings Trend in Ripton
Ripton Airbnb Occupancy Rate Trends (2026)
Maximize your bookings by understanding the Ripton STR occupancy trends. Seasonal demand shifts significantly influence how often properties are booked. Typically, Februarysees the highest demand (peak season occupancy), while April experiences the lowest (low season). Effective strategies, like adjusting minimum stays or offering promotions, can boost occupancy during slower periods. Here's how different property tiers perform in Ripton:
- Best-in-class properties (Top 10%) achieve 74%+ occupancy, indicating high desirability and potentially optimized availability.
- Strong performing properties (Top 25%) maintain 61% or higher occupancy, suggesting good market fit and guest satisfaction.
- Typical properties (Median) have an occupancy rate around 38%.
- Entry-level properties (Bottom 25%) average 21% occupancy, potentially facing higher vacancy.
Average Monthly Occupancy Rate Trend in Ripton
Average Daily Rate (ADR) Airbnb Trends in Ripton (2026)
Effective short term rental pricing strategy in Ripton involves understanding monthly ADR fluctuations. The Average Daily Rate (ADR) for Airbnb in Ripton typically peaks in September and dips lowest during April. Leveraging Airbnb dynamic pricing tools or strategies based on this seasonality can significantly boost revenue. Here's a look at the typical nightly rates achieved:
- Best-in-class properties (Top 10%) command rates of $629+ per night, often due to premium features or locations.
- Strong performing properties (Top 25%) achieve nightly rates of $367 or more.
- Typical properties (Median) charge around $277 per night.
- Entry-level properties (Bottom 25%) earn around $133 per night.
Average Daily Rate (ADR) Trend by Month in Ripton
Get Live Ripton Market Intelligence 👇
Explore Real-time Analytics
Airbnb Seasonality Analysis & Trends in Ripton (2026)
Peak Season (October, July, August)
- Revenue averages $5,077 per month
- Occupancy rates average 47.2%
- Daily rates average $303
Shoulder Season
- Revenue averages $3,814 per month
- Occupancy maintains around 42.2%
- Daily rates hold near $294
Low Season (April, May, December)
- Revenue drops to average $2,883 per month
- Occupancy decreases to average 33.7%
- Daily rates adjust to average $278
Seasonality Insights for Ripton
- The Airbnb seasonality in Ripton shows moderate seasonality with distinct peak and low periods. While the sections above show seasonal averages, it's also insightful to look at the extremes:
- During the high season, the absolute peak month showcases Ripton's highest earning potential, with monthly revenues capable of climbing to $5,191, occupancy reaching a high of 53.0%, and ADRs peaking at $318.
- Conversely, the slowest single month of the year, typically falling within the low season, marks the market's lowest point. In this month, revenue might dip to $2,531, occupancy could drop to 30.8%, and ADRs may adjust down to $266.
- Understanding both the seasonal averages and these monthly peaks and troughs in revenue, occupancy, and ADR is crucial for maximizing your Airbnb profit potential in Ripton.
Seasonal Strategies for Maximizing Profit
- Peak Season: Maximize revenue through premium pricing and potentially longer minimum stays. Ensure high availability.
- Low Season: Offer competitive pricing, special promotions (e.g., extended stay discounts), and flexible cancellation policies. Target off-season travelers like remote workers or budget-conscious guests.
- Shoulder Seasons: Implement dynamic pricing that balances peak and low rates. Target weekend travelers or specific events. Offer slightly more flexible terms than peak season.
- Regularly analyze your own performance against these Ripton seasonality benchmarks and adjust your pricing and availability strategy accordingly.
Best Areas for Airbnb Investment in Ripton (2026)
Exploring the top neighborhoods for short-term rentals in Ripton? This section highlights key areas, outlining why they are attractive for hosts and guests, along with notable local attractions. Consider these locations based on your target guest profile and investment strategy.
| Neighborhood / Area | Why Host Here? (Target Guests & Appeal) | Key Attractions & Landmarks |
|---|---|---|
| Ripton Center | The heart of Ripton, beloved for its serene landscapes and close-knit community vibe. It's perfect for those looking for a quaint getaway in nature, ideal for hiking and outdoor activities. | Ripton Community House, Appalachian Trail, Green Mountain National Forest, Robert Frost Trail, Bristol Falls, Skiing at nearby resorts |
| Moosalamoo National Recreation Area | A stunning natural reserve known for its diverse flora and fauna. Offers endless outdoor activities such as hiking, fishing, and camping, appealing to nature lovers. | Moosalamoo National Recreation Area, Silver Lake, Hiking Trails, Lake Dunmore, Scenic Campsites |
| Brandon | A charming nearby town with artsy vibes and local shops. Offers a distinct, peaceful retreat while being accessible for visitors exploring both Ripton and Brandon. | Brandon Museum, Otter Valley Winery, Local Art Galleries, Brandon's Downtown Shops, Brandon Town Green |
| Middlebury | A vibrant college town nearby with a rich cultural scene, shops, restaurants, and events. Ideal for visitors who enjoy a lively atmosphere yet close to nature. | Middlebury College, Middlebury Arts Walk, Otter Creek, Bread Loaf Campus, Better Middlebury Partnership |
| Salisbury | Known for its picturesque views and proximity to many lakes, this area is great for water activities in summer and tranquil winter retreats. | Lake Dunmore, Silver Lake State Park, Salisbury's Scenic Overlook, Recreational Fishing, Hiking Trails |
| Addison | A small town that boasts beautiful countryside and lake views. It's quiet and serene, perfect for those looking to escape the city hustle. | Lake Champlain, Addison Four Corners, Vermont Roadside Attractions, Local Farms, Montgomery Hill |
| East Middlebury | A peaceful residential community with easy access to surrounding tourist attractions, great for families seeking a quiet stay. | Middlebury River, Historic Buildings, Outdoor Parks, Community Events, Family-Friendly Activities |
| Cornwall | A small rural town known for its agricultural landscapes. It offers a peaceful retreat for those looking to experience the tranquility of Vermont's countryside. | Cornwall's Charming Farms, Local Markets, Scenic Drive Trails, Nature Walks, Historical Landmarks |
Understanding Airbnb License Requirements & STR Laws in Ripton (2026)
Yes, Ripton, Vermont, United States enforces high STR regulations. Obtaining a license and ensuring compliance is almost certainly required according to current 2026 STR laws. Always verify the latest short term rental regulations and Airbnb license requirements directly with local government authorities for Ripton to ensure full compliance before hosting.
(Source: AirROI data, 2026, based on 32% licensed listings)
Top Performing Airbnb Properties in Ripton (2026)
Benchmark your potential! Explore examples of top-performing Airbnb properties in Riptonbased on Trailing Twelve Month (TTM) revenue. Analyze their characteristics, revenue, occupancy rate, and ADR to understand what drives success in this market.
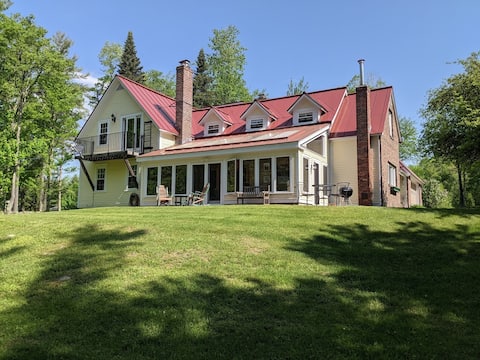
Spacious country house near hiking & ski trails
Entire Place • 5 bedrooms

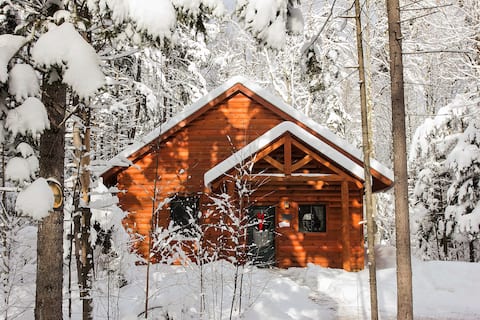
#7 - Hemlock Hideaway Cabin
Entire Place • 2 bedrooms

River Stone Family Lodge-Cabin Across from River
Entire Place • 5 bedrooms
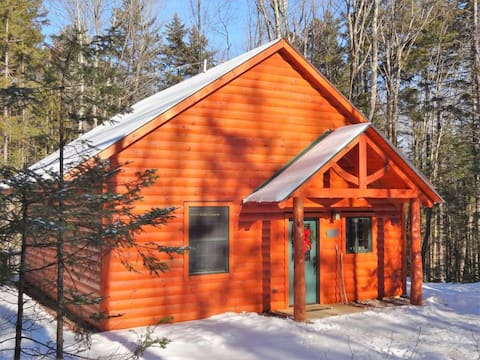
#4 - Serene Outlook Cabin
Entire Place • 2 bedrooms
#5 - Owl's Branch Cabin
Entire Place • 2 bedrooms
#2 - Sunrise Vista Cabin
Entire Place • 2 bedrooms
Note: Performance varies based on location, size, amenities, seasonality, and management quality. Data reflects the past 12 months.
Top Performing Airbnb Hosts in Ripton (2026)
Learn from the best! This table showcases top-performing Airbnb hosts in Ripton based on the number of properties managed and estimated total revenue over the past year. Analyze their scale and performance metrics.
| Host Name | Properties | Grossing Revenue | Stay Reviews | Avg Rating |
|---|---|---|---|---|
| Jaime | 7 | $376,014 | 543 | 4.97/5.0 |
| Clover | 1 | $128,265 | 22 | 4.95/5.0 |
| Elizabeth | 6 | $106,166 | 45 | 4.94/5.0 |
| Kristine | 1 | $75,774 | 35 | 4.97/5.0 |
| Kate | 1 | $59,415 | 23 | 4.78/5.0 |
| Clover | 1 | $57,513 | 98 | 4.97/5.0 |
| Jamie | 1 | $47,914 | 74 | 5.00/5.0 |
| Wendy | 1 | $35,182 | 236 | 4.94/5.0 |
| Jose | 1 | $16,667 | 55 | 4.93/5.0 |
| Lisa | 3 | $15,343 | 113 | 4.98/5.0 |
Analyzing the strategies of top hosts, such as their property selection, pricing, and guest communication, can offer valuable lessons for optimizing your own Airbnb operations in Ripton.
Dive Deeper: Advanced Ripton STR Market Data (2026)
Ready to unlock more insights? AirROI provides access to advanced metrics and comprehensive Airbnb data for Ripton. Explore detailed analytics beyond this report to refine your investment strategy, optimize pricing, and maximize your vacation rental profits.
Explore Advanced MetricsRipton Short-Term Rental Market Composition (2026): Property & Room Types
Room Type Distribution
Property Type Distribution
Market Composition Insights for Ripton
- The Ripton Airbnb market composition is heavily skewed towards Entire Home/Apt listings, which make up 64% of the 25 active rentals. This indicates strong guest preference for privacy and space.
- However, a notable 36% share for Private Rooms suggests opportunities for budget-conscious travelers or hosts renting out spare rooms.
- Looking at the property type distribution in Ripton, Outdoor/Unique properties are the most common (36%), reflecting the local real estate landscape.
- Houses represent a significant 32% portion, catering likely to families or larger groups.
- The presence of 24% Hotel/Boutique listings indicates integration with traditional hospitality.
- Smaller segments like others, unique stays (combined 8.0%) offer potential for unique stay experiences.
Ripton Airbnb Room Capacity Analysis (2026): Bedroom Distribution
Distribution of Listings by Number of Bedrooms
Room Capacity Insights for Ripton
- The dominant room capacity in Ripton is 2 bedrooms listings, making up 36% of the market. This suggests a strong demand for properties suitable for couples or solo travelers.
- Together, 2 bedrooms and 1 bedroom properties represent 68.0% of the active Airbnb listings in Ripton, indicating a high concentration in these sizes.
Ripton Vacation Rental Guest Capacity Trends (2026)
Distribution of Listings by Guest Capacity
Guest Capacity Insights for Ripton
- The most common guest capacity trend in Ripton vacation rentals is listings accommodating 6 guests (36%). This suggests the primary traveler segment is likely larger groups.
- Properties designed for 6 guests and 3 guests dominate the Ripton STR market, accounting for 52.0% of listings.
- 52.0% of properties accommodate 6+ guests, serving the market segment for larger families or group travel in Ripton.
- On average, properties in Ripton are equipped to host 4.4 guests.
Ripton Airbnb Booking Patterns (2026): Available vs. Booked Days
Available Days Distribution
Booked Days Distribution
Booking Pattern Insights for Ripton
- The most common availability pattern in Ripton falls within the 271-366 days range, representing 40% of listings. This suggests many properties have significant open periods on their calendars.
- Approximately 76.0% of listings show high availability (181+ days open annually), indicating potential for increased bookings or specific owner usage patterns.
- For booked days, the 31-90 days range is most frequent in Ripton (36%), reflecting common guest stay durations or potential owner blocking patterns.
- A notable 28.0% of properties secure long booking periods (181+ days booked per year), highlighting successful long-term rental strategies or significant owner usage.
Ripton Airbnb Minimum Stay Requirements Analysis
Distribution of Listings by Minimum Night Requirement
1 Night
16 listings
64% of total
2 Nights
4 listings
16% of total
4-6 Nights
1 listings
4% of total
30+ Nights
4 listings
16% of total
Key Insights
- The most prevalent minimum stay requirement in Ripton is 1 Night, adopted by 64% of listings. This highlights the market's preference for shorter, flexible bookings.
- A strong majority (80.0%) of the Ripton Airbnb data shows acceptance of very short stays (1-2 nights), indicating a dynamic, high-turnover market.
- A significant segment (16%) caters to monthly stays (30+ nights) in Ripton, pointing to opportunities in the extended-stay market.
Recommendations
- Align with the market by considering a 1 Night minimum stay, as 64% of Ripton hosts use this setting.
- Explore offering discounts for stays of 30+ nights to attract the 16% of the market seeking extended stays.
- Adjust minimum nights based on seasonality – potentially shorter during low season and longer during peak demand periods in Ripton.
Ripton Airbnb Cancellation Policy Trends Analysis (2026)
Flexible
4 listings
16% of total
Moderate
9 listings
36% of total
Firm
11 listings
44% of total
Strict
1 listings
4% of total
Cancellation Policy Insights for Ripton
- The prevailing Airbnb cancellation policy trend in Ripton is Firm, used by 44% of listings.
- There's a relatively balanced mix between guest-friendly (52.0%) and stricter (48.0%) policies, offering choices for different guest needs.
- Strict cancellation policies are quite rare (4%), potentially making listings with this policy less competitive unless justified by high demand or property type.
Recommendations for Hosts
- Consider adopting a Firm policy to align with the 44% market standard in Ripton.
- Using a Strict policy might deter some guests, as only 4% of listings use it. Evaluate if potential revenue protection outweighs possible lower booking rates.
- Regularly review your cancellation policy against competitors and market demand shifts in Ripton.
Ripton STR Booking Lead Time Analysis (2026)
Average Booking Lead Time by Month
Booking Lead Time Insights for Ripton
- The overall average booking lead time for vacation rentals in Ripton is 67 days.
- Guests book furthest in advance for stays during October (average 111 days), likely coinciding with peak travel demand or local events.
- The shortest booking windows occur for stays in April (average 29 days), indicating more last-minute travel plans during this time.
- Seasonally, Summer (83 days avg.) sees the longest lead times, while Spring (52 days avg.) has the shortest, reflecting typical travel planning cycles.
Recommendations for Hosts
- Use the overall average lead time (67 days) as a baseline for your pricing and availability strategy in Ripton.
- For October stays, consider implementing length-of-stay discounts or slightly higher rates for bookings made less than 111 days out to capitalize on advance planning.
- Target marketing efforts for the Summer season well in advance (at least 83 days) to capture early planners.
- Monitor your own booking lead times against these Ripton averages to identify opportunities for dynamic pricing adjustments.
Popular & Essential Airbnb Amenities in Ripton (2026)
Amenity Prevalence
Amenity Insights for Ripton
- Essential amenities in Ripton that guests expect include: Smoke alarm, Wifi, Heating, Free parking on premises, Carbon monoxide alarm, Fire extinguisher, Hair dryer. Lacking these (any) could significantly impact bookings.
- Popular amenities like First aid kit, Extra pillows and blankets, Iron are common but not universal. Offering these can provide a competitive edge.
Recommendations for Hosts
- Ensure your listing includes all essential amenities for Ripton: Smoke alarm, Wifi, Heating, Free parking on premises, Carbon monoxide alarm, Fire extinguisher, Hair dryer.
- Prioritize adding missing essentials: Carbon monoxide alarm, Fire extinguisher, Hair dryer.
- Consider adding popular differentiators like First aid kit or Extra pillows and blankets to increase appeal.
- Highlight unique or less common amenities you offer (e.g., hot tub, dedicated workspace, EV charger) in your listing description and photos.
- Regularly check competitor amenities in Ripton to stay competitive.
Ripton Airbnb Guest Demographics & Profile Analysis (2026)
Guest Profile Summary for Ripton
- The typical guest profile for Airbnb in Ripton consists of primarily domestic travelers (94%), often arriving from nearby Boston, typically belonging to the Post-2000s (Gen Z/Alpha) group (50%), primarily speaking English or French.
- Domestic travelers account for 93.8% of guests.
- Key international markets include United States (93.8%) and United Kingdom (2.7%).
- Top languages spoken are English (65.8%) followed by French (14.5%).
- A significant demographic segment is the Post-2000s (Gen Z/Alpha) group, representing 50% of guests.
Recommendations for Hosts
- Target domestic marketing efforts towards travelers from Boston and New York.
- Tailor amenities and listing descriptions to appeal to the dominant Post-2000s (Gen Z/Alpha) demographic (e.g., highlight fast WiFi, smart home features, local guides).
- Highlight unique local experiences or amenities relevant to the primary guest profile.
- Consider seasonal promotions aligned with peak travel times for key origin markets.
Nearby Short-Term Rental Market Comparison
How does the Ripton Airbnb market stack up against its neighbors? Compare key performance metrics like average monthly revenue, ADR, and occupancy rates in surrounding areas to understand the broader regional STR landscape.
| Market | Active Properties | Monthly Revenue | Daily Rate | Avg. Occupancy |
|---|---|---|---|---|
| Middletown Springs | 13 | $6,843 | $507.55 | 32% |
| Pomfret | 15 | $6,549 | $502.74 | 45% |
| Fort Ann | 35 | $6,238 | $790.41 | 37% |
| Hanover | 33 | $5,826 | $1189.51 | 41% |
| Town of Ancram | 22 | $5,616 | $512.55 | 38% |
| Town of Schodack | 11 | $5,158 | $555.89 | 29% |
| Town of Stillwater | 55 | $5,153 | $564.54 | 42% |
| Monterey | 41 | $5,089 | $470.60 | 44% |
| Malletts Bay | 51 | $4,842 | $444.86 | 41% |
| Town of Wilton | 103 | $4,841 | $862.83 | 38% |