Northfield Airbnb Market Analysis 2026: Short Term Rental Data & Vacation Rental Statistics in Vermont, United States
Is Airbnb profitable in Northfield in 2026? Explore comprehensive Airbnb analytics for Northfield, Vermont, United States to uncover income potential. This 2026 STR market report for Northfield, based on AirROI data from February 2025 to January 2026, reveals key trends in the niche market of 26 active listings.
Whether you're considering an Airbnb investment in Northfield, optimizing your existing vacation rental, or exploring rental arbitrage opportunities, understanding the Northfield Airbnb data is crucial. Understanding the local regulations is key to maximizing your short term rental income potential. Let's dive into the specifics.
Key Northfield Airbnb Performance Metrics Overview
Monthly Airbnb Revenue Variations & Income Potential in Northfield (2026)
Understanding the monthly revenue variations for Airbnb listings in Northfield is key to maximizing your short term rental income potential. Seasonality significantly impacts earnings. Our analysis, based on data from the past 12 months, shows that the peak revenue month for STRs in Northfield is typically October, while November often presents the lowest earnings, highlighting opportunities for strategic pricing adjustments during shoulder and low seasons. Explore the typical Airbnb income in Northfield across different performance tiers:
- Best-in-class properties (Top 10%) achieve $4,874+ monthly, often utilizing dynamic pricing and superior guest experiences.
- Strong performing properties (Top 25%) earn $3,366 or more, indicating effective management and desirable locations/amenities.
- Typical properties (Median) generate around $1,749 per month, representing the average market performance.
- Entry-level properties (Bottom 25%) see earnings around $794, often with potential for optimization.
Average Monthly Airbnb Earnings Trend in Northfield
Northfield Airbnb Occupancy Rate Trends (2026)
Maximize your bookings by understanding the Northfield STR occupancy trends. Seasonal demand shifts significantly influence how often properties are booked. Typically, Augustsees the highest demand (peak season occupancy), while November experiences the lowest (low season). Effective strategies, like adjusting minimum stays or offering promotions, can boost occupancy during slower periods. Here's how different property tiers perform in Northfield:
- Best-in-class properties (Top 10%) achieve 75%+ occupancy, indicating high desirability and potentially optimized availability.
- Strong performing properties (Top 25%) maintain 47% or higher occupancy, suggesting good market fit and guest satisfaction.
- Typical properties (Median) have an occupancy rate around 27%.
- Entry-level properties (Bottom 25%) average 13% occupancy, potentially facing higher vacancy.
Average Monthly Occupancy Rate Trend in Northfield
Average Daily Rate (ADR) Airbnb Trends in Northfield (2026)
Effective short term rental pricing strategy in Northfield involves understanding monthly ADR fluctuations. The Average Daily Rate (ADR) for Airbnb in Northfield typically peaks in October and dips lowest during March. Leveraging Airbnb dynamic pricing tools or strategies based on this seasonality can significantly boost revenue. Here's a look at the typical nightly rates achieved:
- Best-in-class properties (Top 10%) command rates of $446+ per night, often due to premium features or locations.
- Strong performing properties (Top 25%) achieve nightly rates of $262 or more.
- Typical properties (Median) charge around $184 per night.
- Entry-level properties (Bottom 25%) earn around $148 per night.
Average Daily Rate (ADR) Trend by Month in Northfield
Get Live Northfield Market Intelligence 👇

Explore Real-time Analytics
Airbnb Seasonality Analysis & Trends in Northfield (2026)
Peak Season (October, September, July)
- Revenue averages $2,867 per month
- Occupancy rates average 35.8%
- Daily rates average $307
Shoulder Season
- Revenue averages $2,466 per month
- Occupancy maintains around 37.6%
- Daily rates hold near $261
Low Season (January, November, December)
- Revenue drops to average $1,758 per month
- Occupancy decreases to average 27.3%
- Daily rates adjust to average $334
Seasonality Insights for Northfield
- The Airbnb seasonality in Northfield shows moderate seasonality with distinct peak and low periods. While the sections above show seasonal averages, it's also insightful to look at the extremes:
- During the high season, the absolute peak month showcases Northfield's highest earning potential, with monthly revenues capable of climbing to $2,927, occupancy reaching a high of 48.0%, and ADRs peaking at $346.
- Conversely, the slowest single month of the year, typically falling within the low season, marks the market's lowest point. In this month, revenue might dip to $1,544, occupancy could drop to 22.3%, and ADRs may adjust down to $254.
- Understanding both the seasonal averages and these monthly peaks and troughs in revenue, occupancy, and ADR is crucial for maximizing your Airbnb profit potential in Northfield.
Seasonal Strategies for Maximizing Profit
- Peak Season: Maximize revenue through premium pricing and potentially longer minimum stays. Ensure high availability.
- Low Season: Offer competitive pricing, special promotions (e.g., extended stay discounts), and flexible cancellation policies. Target off-season travelers like remote workers or budget-conscious guests.
- Shoulder Seasons: Implement dynamic pricing that balances peak and low rates. Target weekend travelers or specific events. Offer slightly more flexible terms than peak season.
- Regularly analyze your own performance against these Northfield seasonality benchmarks and adjust your pricing and availability strategy accordingly.
Best Areas for Airbnb Investment in Northfield (2026)
Exploring the top neighborhoods for short-term rentals in Northfield? This section highlights key areas, outlining why they are attractive for hosts and guests, along with notable local attractions. Consider these locations based on your target guest profile and investment strategy.
| Neighborhood / Area | Why Host Here? (Target Guests & Appeal) | Key Attractions & Landmarks |
|---|---|---|
| Downtown Northfield | The urban center of Northfield, known for its charming small-town vibe and proximity to local businesses, eateries, and cultural sites. Ideal for visitors who want to enjoy the local community. | Northfield Historical Society, Hannaford Plaza, Ira Allen Park, The Northfield Falls Covered Bridge, Green Mountain College |
| Central Vermont | Central Vermont provides access to beautiful natural landscapes and recreational activities. Perfect for outdoor enthusiasts looking for a rural escape while still being close to Northfield. | Worcester Range, Green Mountain National Forest, Catamount Outdoor Family Center, Dog Mountain, Montpelier, Vermont's capital |
| Norwich | Just a short drive from Northfield, Norwich is known for its picturesque views and quiet environment. Great for travelers wanting a peaceful retreat with access to hiking and nature. | Dartmouth College, King Arthur Flour, Norwich Farmers Market, Mason Park, Maxfield Ice House |
| Ski Resorts | The nearby ski resorts like Sugarbush and Stowe attract winter sports lovers. This area is perfect for Airbnb hosting during winter months with good traffic from ski enthusiasts. | Sugarbush Resort, Stowe Mountain Resort, Mount Ellen, Mad River Glen, Basin Ski Area |
| Berlin | Berlin is located nearby and offers a mix of shopping, dining, and outdoor activities. It's excellent for those seeking both urban and outdoor experiences. | Berlin Mall, Montpelier Recreation Paths, New England Culinary Institute, The Barre Playhouse, Central Vermont Botanical Gardens |
| Northfield Falls | This scenic area is known for its beautiful landscapes and outdoor activities. Perfect for those looking for tranquil nature while still being close to Northfield. | Northfield Falls Covered Bridge, Dog River, local hiking trails, scenic viewpoints, kayaking and fishing spots |
| Middlebury | A bit further away, Middlebury is a college town with a vibrant community and cultural events. Ideal for tourists wanting a more varied experience. | Middlebury College, Otter Creek Brewing, The Town Hall Theater, Bristol Falls, Middlebury College Snow Bowl |
| Mad River Valley | A picturesque area known for its outdoor activities year-round, it's attractive for tourists seeking adventure and natural beauty, with a solid Airbnb market. | Mad River Valley ski areas, local breweries and farms, hiking trails, craft fairs, summer music festivals |
Understanding Airbnb License Requirements & STR Laws in Northfield (2026)
With 12% of listings showing registration in 2026, understanding potential Airbnb license requirements is crucial in Northfield. Always verify the latest short term rental regulations and Airbnb license requirements directly with local government authorities for Northfield to ensure full compliance before hosting.
(Source: AirROI data, 2026, based on 12% licensed listings)
Top Performing Airbnb Properties in Northfield (2026)
Benchmark your potential! Explore examples of top-performing Airbnb properties in Northfieldbased on Trailing Twelve Month (TTM) revenue. Analyze their characteristics, revenue, occupancy rate, and ADR to understand what drives success in this market.

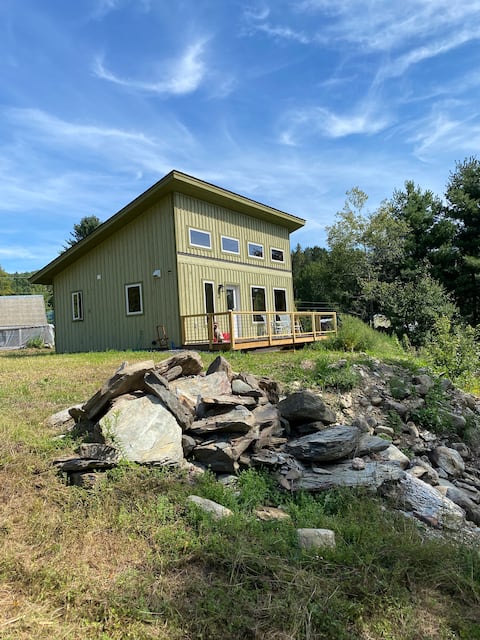
Hilltop Cabin on Barrows Road
Entire Place • 3 bedrooms

Luxurious Vermont Farmhouse
Entire Place • 3 bedrooms
Private Cabin at Union Brook Farm
Entire Place • 1 bedroom

The Cadet Corner Guest Suite
Entire Place • 1 bedroom
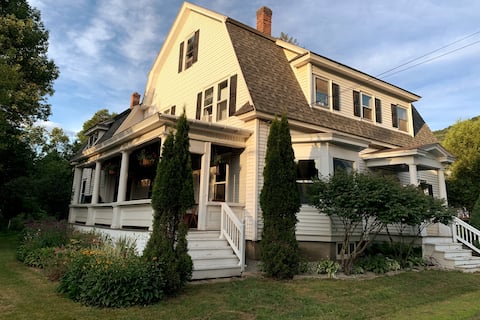
Family & Dog Friendly Roomy Colonial
Entire Place • 4 bedrooms
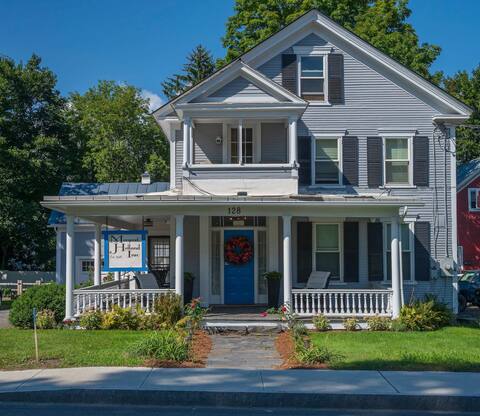
Charming Home in heart of town
Entire Place • 7 bedrooms
Note: Performance varies based on location, size, amenities, seasonality, and management quality. Data reflects the past 12 months.
Top Performing Airbnb Hosts in Northfield (2026)
Learn from the best! This table showcases top-performing Airbnb hosts in Northfield based on the number of properties managed and estimated total revenue over the past year. Analyze their scale and performance metrics.
| Host Name | Properties | Grossing Revenue | Stay Reviews | Avg Rating |
|---|---|---|---|---|
| Kimmie | 7 | $67,994 | 27 | 5.00/5.0 |
| Chase | 4 | $67,404 | 231 | 4.91/5.0 |
| Carol | 1 | $40,492 | 79 | 4.89/5.0 |
| Laura | 1 | $37,729 | 4 | 5.00/5.0 |
| Rose | 1 | $36,697 | 237 | 4.94/5.0 |
| Abby | 1 | $34,016 | 71 | 5.00/5.0 |
| Ernest | 3 | $33,662 | 55 | 4.84/5.0 |
| Ted | 1 | $30,424 | 90 | 4.88/5.0 |
| Julie And Mark | 1 | $27,747 | 135 | 4.97/5.0 |
| Edward | 1 | $25,949 | 37 | 4.97/5.0 |
Analyzing the strategies of top hosts, such as their property selection, pricing, and guest communication, can offer valuable lessons for optimizing your own Airbnb operations in Northfield.
Dive Deeper: Advanced Northfield STR Market Data (2026)
Ready to unlock more insights? AirROI provides access to advanced metrics and comprehensive Airbnb data for Northfield. Explore detailed analytics beyond this report to refine your investment strategy, optimize pricing, and maximize your vacation rental profits.
Explore Advanced MetricsNorthfield Short-Term Rental Market Composition (2026): Property & Room Types
Room Type Distribution
Property Type Distribution
Market Composition Insights for Northfield
- The Northfield Airbnb market composition is heavily skewed towards Entire Home/Apt listings, which make up 61.5% of the 26 active rentals. This indicates strong guest preference for privacy and space.
- However, a notable 38.5% share for Private Rooms suggests opportunities for budget-conscious travelers or hosts renting out spare rooms.
- Looking at the property type distribution in Northfield, House properties are the most common (38.5%), reflecting the local real estate landscape.
- Houses represent a significant 38.5% portion, catering likely to families or larger groups.
- The presence of 30.8% Hotel/Boutique listings indicates integration with traditional hospitality.
Northfield Airbnb Room Capacity Analysis (2026): Bedroom Distribution
Distribution of Listings by Number of Bedrooms
Room Capacity Insights for Northfield
- The dominant room capacity in Northfield is 5+ bedrooms listings, making up 26.9% of the market. This suggests a strong demand for properties suitable for families or small groups.
- Together, 5+ bedrooms and 1 bedroom properties represent 50.0% of the active Airbnb listings in Northfield, indicating a high concentration in these sizes.
- A significant 50.0% of listings offer 3+ bedrooms, catering to larger groups and families seeking more space in Northfield.
Northfield Vacation Rental Guest Capacity Trends (2026)
Distribution of Listings by Guest Capacity
Guest Capacity Insights for Northfield
- The most common guest capacity trend in Northfield vacation rentals is listings accommodating 2 guests (19.2%). This suggests the primary traveler segment is likely couples or solo travelers.
- Properties designed for 2 guests and 6 guests dominate the Northfield STR market, accounting for 34.6% of listings.
- 26.9% of properties accommodate 6+ guests, serving the market segment for larger families or group travel in Northfield.
- On average, properties in Northfield are equipped to host 3.1 guests.
Northfield Airbnb Booking Patterns (2026): Available vs. Booked Days
Available Days Distribution
Booked Days Distribution
Booking Pattern Insights for Northfield
- The most common availability pattern in Northfield falls within the 271-366 days range, representing 65.4% of listings. This suggests many properties have significant open periods on their calendars.
- Approximately 88.5% of listings show high availability (181+ days open annually), indicating potential for increased bookings or specific owner usage patterns.
- For booked days, the 31-90 days range is most frequent in Northfield (53.8%), reflecting common guest stay durations or potential owner blocking patterns.
- A notable 11.5% of properties secure long booking periods (181+ days booked per year), highlighting successful long-term rental strategies or significant owner usage.
Northfield Airbnb Minimum Stay Requirements Analysis
Distribution of Listings by Minimum Night Requirement
1 Night
14 listings
53.8% of total
2 Nights
5 listings
19.2% of total
3 Nights
2 listings
7.7% of total
4-6 Nights
1 listings
3.8% of total
7-29 Nights
3 listings
11.5% of total
30+ Nights
1 listings
3.8% of total
Key Insights
- The most prevalent minimum stay requirement in Northfield is 1 Night, adopted by 53.8% of listings. This highlights the market's preference for shorter, flexible bookings.
- A strong majority (73.0%) of the Northfield Airbnb data shows acceptance of very short stays (1-2 nights), indicating a dynamic, high-turnover market.
Recommendations
- Align with the market by considering a 1 Night minimum stay, as 53.8% of Northfield hosts use this setting.
- Adjust minimum nights based on seasonality – potentially shorter during low season and longer during peak demand periods in Northfield.
Northfield Airbnb Cancellation Policy Trends Analysis (2026)
Flexible
9 listings
34.6% of total
Moderate
11 listings
42.3% of total
Firm
5 listings
19.2% of total
Strict
1 listings
3.8% of total
Cancellation Policy Insights for Northfield
- The prevailing Airbnb cancellation policy trend in Northfield is Moderate, used by 42.3% of listings.
- The market strongly favors guest-friendly terms, with 76.9% of listings offering Flexible or Moderate policies. This suggests guests in Northfield may expect booking flexibility.
- Strict cancellation policies are quite rare (3.8%), potentially making listings with this policy less competitive unless justified by high demand or property type.
Recommendations for Hosts
- Consider adopting a Moderate policy to align with the 42.3% market standard in Northfield.
- Using a Strict policy might deter some guests, as only 3.8% of listings use it. Evaluate if potential revenue protection outweighs possible lower booking rates.
- Regularly review your cancellation policy against competitors and market demand shifts in Northfield.
Northfield STR Booking Lead Time Analysis (2026)
Average Booking Lead Time by Month
Booking Lead Time Insights for Northfield
- The overall average booking lead time for vacation rentals in Northfield is 68 days.
- Guests book furthest in advance for stays during September (average 156 days), likely coinciding with peak travel demand or local events.
- The shortest booking windows occur for stays in November (average 31 days), indicating more last-minute travel plans during this time.
- Seasonally, Fall (90 days avg.) sees the longest lead times, while Winter (34 days avg.) has the shortest, reflecting typical travel planning cycles.
Recommendations for Hosts
- Use the overall average lead time (68 days) as a baseline for your pricing and availability strategy in Northfield.
- For September stays, consider implementing length-of-stay discounts or slightly higher rates for bookings made less than 156 days out to capitalize on advance planning.
- Target marketing efforts for the Fall season well in advance (at least 90 days) to capture early planners.
- Monitor your own booking lead times against these Northfield averages to identify opportunities for dynamic pricing adjustments.
Popular & Essential Airbnb Amenities in Northfield (2026)
Amenity Prevalence
Amenity Insights for Northfield
- Essential amenities in Northfield that guests expect include: Coffee maker, Free parking on premises, Carbon monoxide alarm, Wifi, Dishes and silverware, Smoke alarm, Heating. Lacking these (any) could significantly impact bookings.
- Popular amenities like Refrigerator, Fire extinguisher, Cooking basics are common but not universal. Offering these can provide a competitive edge.
Recommendations for Hosts
- Ensure your listing includes all essential amenities for Northfield: Coffee maker, Free parking on premises, Carbon monoxide alarm, Wifi, Dishes and silverware, Smoke alarm, Heating.
- Consider adding popular differentiators like Refrigerator or Fire extinguisher to increase appeal.
- Highlight unique or less common amenities you offer (e.g., hot tub, dedicated workspace, EV charger) in your listing description and photos.
- Regularly check competitor amenities in Northfield to stay competitive.
Northfield Airbnb Guest Demographics & Profile Analysis (2026)
Guest Profile Summary for Northfield
- The typical guest profile for Airbnb in Northfield consists of primarily domestic travelers (94%), often arriving from nearby New York, typically belonging to the Post-2000s (Gen Z/Alpha) group (50%), primarily speaking English or Spanish.
- Domestic travelers account for 94.3% of guests.
- Key international markets include United States (94.3%) and Canada (3.5%).
- Top languages spoken are English (77.8%) followed by Spanish (9.5%).
- A significant demographic segment is the Post-2000s (Gen Z/Alpha) group, representing 50% of guests.
Recommendations for Hosts
- Target domestic marketing efforts towards travelers from New York and Boston.
- Tailor amenities and listing descriptions to appeal to the dominant Post-2000s (Gen Z/Alpha) demographic (e.g., highlight fast WiFi, smart home features, local guides).
- Highlight unique local experiences or amenities relevant to the primary guest profile.
- Consider seasonal promotions aligned with peak travel times for key origin markets.
Nearby Short-Term Rental Market Comparison
How does the Northfield Airbnb market stack up against its neighbors? Compare key performance metrics like average monthly revenue, ADR, and occupancy rates in surrounding areas to understand the broader regional STR landscape.
| Market | Active Properties | Monthly Revenue | Daily Rate | Avg. Occupancy |
|---|---|---|---|---|
| Middletown Springs | 13 | $6,843 | $507.55 | 32% |
| Pomfret | 15 | $6,549 | $502.74 | 45% |
| Fort Ann | 35 | $6,238 | $790.41 | 37% |
| Hanover | 33 | $5,826 | $1189.51 | 41% |
| Barnstead | 36 | $5,090 | $477.12 | 42% |
| Goffstown | 13 | $5,066 | $343.72 | 53% |
| Malletts Bay | 51 | $4,842 | $444.86 | 41% |
| Town of Wilton | 103 | $4,841 | $862.83 | 38% |
| Jefferson | 28 | $4,793 | $474.72 | 40% |
| Wilmot | 11 | $4,667 | $334.67 | 51% |