Johnson Airbnb Market Analysis 2026: Short Term Rental Data & Vacation Rental Statistics in Vermont, United States
Is Airbnb profitable in Johnson in 2026? Explore comprehensive Airbnb analytics for Johnson, Vermont, United States to uncover income potential. This 2026 STR market report for Johnson, based on AirROI data from February 2025 to January 2026, reveals key trends in the niche market of 37 active listings.
Whether you're considering an Airbnb investment in Johnson, optimizing your existing vacation rental, or exploring rental arbitrage opportunities, understanding the Johnson Airbnb data is crucial. Leveraging the low regulation environment is key to maximizing your short term rental income potential. Let's dive into the specifics.
Key Johnson Airbnb Performance Metrics Overview
Monthly Airbnb Revenue Variations & Income Potential in Johnson (2026)
Understanding the monthly revenue variations for Airbnb listings in Johnson is key to maximizing your short term rental income potential. Seasonality significantly impacts earnings. Our analysis, based on data from the past 12 months, shows that the peak revenue month for STRs in Johnson is typically January, while April often presents the lowest earnings, highlighting opportunities for strategic pricing adjustments during shoulder and low seasons. Explore the typical Airbnb income in Johnson across different performance tiers:
- Best-in-class properties (Top 10%) achieve $9,376+ monthly, often utilizing dynamic pricing and superior guest experiences.
- Strong performing properties (Top 25%) earn $5,923 or more, indicating effective management and desirable locations/amenities.
- Typical properties (Median) generate around $3,398 per month, representing the average market performance.
- Entry-level properties (Bottom 25%) see earnings around $1,698, often with potential for optimization.
Average Monthly Airbnb Earnings Trend in Johnson
Johnson Airbnb Occupancy Rate Trends (2026)
Maximize your bookings by understanding the Johnson STR occupancy trends. Seasonal demand shifts significantly influence how often properties are booked. Typically, Octobersees the highest demand (peak season occupancy), while April experiences the lowest (low season). Effective strategies, like adjusting minimum stays or offering promotions, can boost occupancy during slower periods. Here's how different property tiers perform in Johnson:
- Best-in-class properties (Top 10%) achieve 84%+ occupancy, indicating high desirability and potentially optimized availability.
- Strong performing properties (Top 25%) maintain 72% or higher occupancy, suggesting good market fit and guest satisfaction.
- Typical properties (Median) have an occupancy rate around 55%.
- Entry-level properties (Bottom 25%) average 29% occupancy, potentially facing higher vacancy.
Average Monthly Occupancy Rate Trend in Johnson
Average Daily Rate (ADR) Airbnb Trends in Johnson (2026)
Effective short term rental pricing strategy in Johnson involves understanding monthly ADR fluctuations. The Average Daily Rate (ADR) for Airbnb in Johnson typically peaks in December and dips lowest during April. Leveraging Airbnb dynamic pricing tools or strategies based on this seasonality can significantly boost revenue. Here's a look at the typical nightly rates achieved:
- Best-in-class properties (Top 10%) command rates of $455+ per night, often due to premium features or locations.
- Strong performing properties (Top 25%) achieve nightly rates of $324 or more.
- Typical properties (Median) charge around $180 per night.
- Entry-level properties (Bottom 25%) earn around $132 per night.
Average Daily Rate (ADR) Trend by Month in Johnson
Get Live Johnson Market Intelligence 👇

Explore Real-time Analytics
Airbnb Seasonality Analysis & Trends in Johnson (2026)
Peak Season (January, October, December)
- Revenue averages $5,826 per month
- Occupancy rates average 56.0%
- Daily rates average $292
Shoulder Season
- Revenue averages $4,449 per month
- Occupancy maintains around 53.6%
- Daily rates hold near $243
Low Season (April, June, November)
- Revenue drops to average $2,998 per month
- Occupancy decreases to average 40.6%
- Daily rates adjust to average $232
Seasonality Insights for Johnson
- The Airbnb seasonality in Johnson shows highly seasonal trends requiring careful strategy. While the sections above show seasonal averages, it's also insightful to look at the extremes:
- During the high season, the absolute peak month showcases Johnson's highest earning potential, with monthly revenues capable of climbing to $6,100, occupancy reaching a high of 63.9%, and ADRs peaking at $306.
- Conversely, the slowest single month of the year, typically falling within the low season, marks the market's lowest point. In this month, revenue might dip to $2,025, occupancy could drop to 35.2%, and ADRs may adjust down to $209.
- Understanding both the seasonal averages and these monthly peaks and troughs in revenue, occupancy, and ADR is crucial for maximizing your Airbnb profit potential in Johnson.
Seasonal Strategies for Maximizing Profit
- Peak Season: Maximize revenue through premium pricing and potentially longer minimum stays. Ensure high availability.
- Low Season: Offer competitive pricing, special promotions (e.g., extended stay discounts), and flexible cancellation policies. Target off-season travelers like remote workers or budget-conscious guests.
- Shoulder Seasons: Implement dynamic pricing that balances peak and low rates. Target weekend travelers or specific events. Offer slightly more flexible terms than peak season.
- Regularly analyze your own performance against these Johnson seasonality benchmarks and adjust your pricing and availability strategy accordingly.
Best Areas for Airbnb Investment in Johnson (2026)
Exploring the top neighborhoods for short-term rentals in Johnson? This section highlights key areas, outlining why they are attractive for hosts and guests, along with notable local attractions. Consider these locations based on your target guest profile and investment strategy.
| Neighborhood / Area | Why Host Here? (Target Guests & Appeal) | Key Attractions & Landmarks |
|---|---|---|
| Stowe | A charming ski resort town known for its picturesque landscapes and outdoor activities year-round. It attracts tourists for skiing, hiking, and its quaint village atmosphere. | Stowe Mountain Resort, Smugglers Notch State Park, The Alchemist Brewery, Stowe Recreation Path, Ben & Jerry's Factory, Von Trapp Brewing Bierhall |
| Waterbury | Home to a variety of attractions and breweries, this small town is popular for its access to outdoor activities and its vibrant culinary scene. | Ben & Jerry's Factory, Waterbury Reservoir, Prohibition Pig, Green Mountain Coffee Roasters, Cold Hollow Cider Mill |
| Montpelier | Vermont's capital city offers a unique mix of culture and history, attracting visitors for its charming downtown area and various state government attractions. | Vermont State House, Lost Nation Brewing, Montpelier Historical Society, Kelley Stand Ski Area, Capitol Grounds |
| Burlington | A lively college town on the shores of Lake Champlain, known for its vibrant arts scene, diverse food options, and active outdoor lifestyle. | Church Street Marketplace, Shelburne Farms, Burlington Bike Path, Echo Lake Aquarium and Science Center, The Flynn Center for the Performing Arts |
| Fairfax | A peaceful small town close to larger attractions, providing a rural escape with opportunities for outdoor activities and community events. | Fairfax Community Park, Lake Arrowhead, The Fairfax Historical Society, Eagle Mountain Church |
| Cambridge | Known for its natural beauty and outdoor recreation, Cambridge is favored by those seeking a serene environment and proximity to ski resorts and trails. | Smugglers Notch, Mount Mansfield, Cambridge Village, Baker Pond, The Green River Reservoir |
| Lyndonville | A quiet town that serves as a base for exploring the Northeast Kingdom, popular for its natural scenery and small-town charm. | Lyndon State College, Kingdom Trails, Burke Mountain, Lyndonville Historical Society, Northeast Kingdom |
| Jay | This area is favored for its ski resorts and beautiful natural landscapes, attracting winter sports enthusiasts and nature lovers alike. | Jay Peak Resort, Jay Peak Golf Course, Pump House Indoor Waterpark, Vermont Maple Museum, Lake Memphremagog |
Understanding Airbnb License Requirements & STR Laws in Johnson (2026)
While Johnson, Vermont, United States currently shows low STR regulations, specific Airbnb license requirements might still exist or change. Always verify the latest short term rental regulations and Airbnb license requirements directly with local government authorities for Johnson to ensure full compliance before hosting.
(Source: AirROI data, 2026, based on 8% licensed listings)
Top Performing Airbnb Properties in Johnson (2026)
Benchmark your potential! Explore examples of top-performing Airbnb properties in Johnsonbased on Trailing Twelve Month (TTM) revenue. Analyze their characteristics, revenue, occupancy rate, and ADR to understand what drives success in this market.
Hot tub, sauna, arcade, 18 acres
Entire Place • 5 bedrooms
Chavís Castle
Entire Place • 2 bedrooms

Modern Green Mountain Getaway
Entire Place • 6 bedrooms
Outdoors lovers! Hot tub, trails, streams, privacy
Entire Place • 3 bedrooms
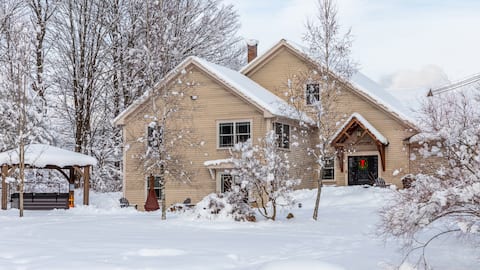
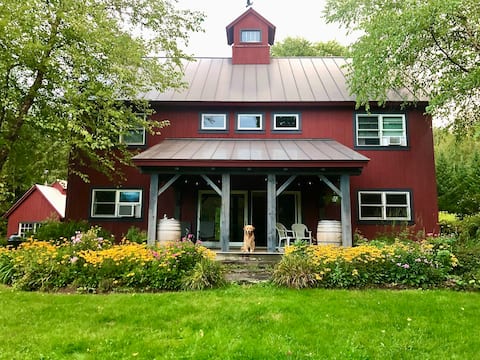
The Barn - Modern Living in Small Town Vermont
Entire Place • 2 bedrooms
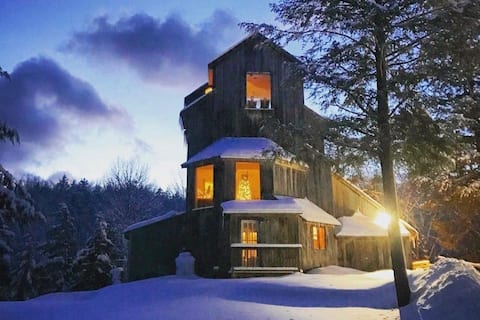
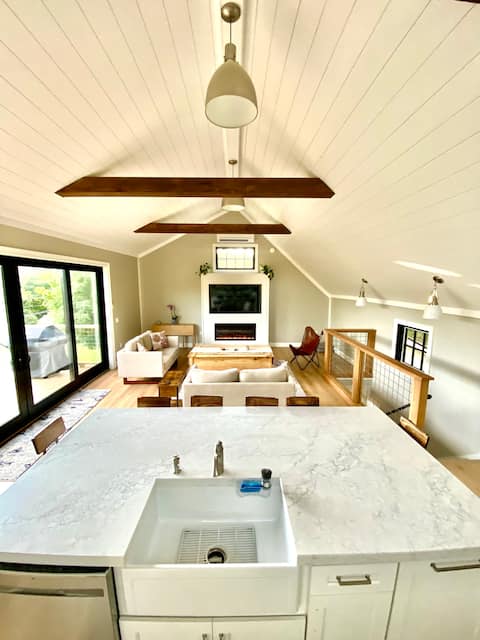
Haven Tiny House by Stowe | Hot Tub, Sauna & Views
Entire Place • 2 bedrooms
Note: Performance varies based on location, size, amenities, seasonality, and management quality. Data reflects the past 12 months.
Top Performing Airbnb Hosts in Johnson (2026)
Learn from the best! This table showcases top-performing Airbnb hosts in Johnson based on the number of properties managed and estimated total revenue over the past year. Analyze their scale and performance metrics.
| Host Name | Properties | Grossing Revenue | Stay Reviews | Avg Rating |
|---|---|---|---|---|
| Tyler | 9 | $424,514 | 1334 | 4.89/5.0 |
| Travis | 4 | $197,391 | 428 | 4.96/5.0 |
| Jayla | 1 | $152,345 | 95 | 4.95/5.0 |
| Travis | 1 | $131,725 | 166 | 4.99/5.0 |
| Victoria | 1 | $129,031 | 22 | 4.86/5.0 |
| Sandy | 1 | $93,701 | 102 | 5.00/5.0 |
| Claire | 1 | $70,727 | 19 | 4.95/5.0 |
| Elise | 2 | $55,195 | 213 | 4.61/5.0 |
| Elizabeth | 1 | $49,106 | 174 | 4.95/5.0 |
| Rebecca And Blake | 1 | $44,740 | 12 | 5.00/5.0 |
Analyzing the strategies of top hosts, such as their property selection, pricing, and guest communication, can offer valuable lessons for optimizing your own Airbnb operations in Johnson.
Dive Deeper: Advanced Johnson STR Market Data (2026)
Ready to unlock more insights? AirROI provides access to advanced metrics and comprehensive Airbnb data for Johnson. Explore detailed analytics beyond this report to refine your investment strategy, optimize pricing, and maximize your vacation rental profits.
Explore Advanced MetricsJohnson Short-Term Rental Market Composition (2026): Property & Room Types
Room Type Distribution
Property Type Distribution
Market Composition Insights for Johnson
- The Johnson Airbnb market composition is heavily skewed towards Entire Home/Apt listings, which make up 97.3% of the 37 active rentals. This indicates strong guest preference for privacy and space.
- Looking at the property type distribution in Johnson, House properties are the most common (59.5%), reflecting the local real estate landscape.
- Houses represent a significant 59.5% portion, catering likely to families or larger groups.
- The presence of 5.4% Hotel/Boutique listings indicates integration with traditional hospitality.
- Smaller segments like unique stays, others (combined 5.4%) offer potential for unique stay experiences.
Johnson Airbnb Room Capacity Analysis (2026): Bedroom Distribution
Distribution of Listings by Number of Bedrooms
Room Capacity Insights for Johnson
- The dominant room capacity in Johnson is 1 bedroom listings, making up 37.8% of the market. This suggests a strong demand for properties suitable for couples or solo travelers.
- Together, 1 bedroom and 2 bedrooms properties represent 72.9% of the active Airbnb listings in Johnson, indicating a high concentration in these sizes.
- A significant 24.3% of listings offer 3+ bedrooms, catering to larger groups and families seeking more space in Johnson.
Johnson Vacation Rental Guest Capacity Trends (2026)
Distribution of Listings by Guest Capacity
Guest Capacity Insights for Johnson
- The most common guest capacity trend in Johnson vacation rentals is listings accommodating 4 guests (21.6%). This suggests the primary traveler segment is likely small families or groups.
- Properties designed for 4 guests and 2 guests dominate the Johnson STR market, accounting for 40.5% of listings.
- 29.7% of properties accommodate 6+ guests, serving the market segment for larger families or group travel in Johnson.
- On average, properties in Johnson are equipped to host 4.5 guests.
Johnson Airbnb Booking Patterns (2026): Available vs. Booked Days
Available Days Distribution
Booked Days Distribution
Booking Pattern Insights for Johnson
- The most common availability pattern in Johnson falls within the 91-180 days range, representing 37.8% of listings. This suggests many properties have significant open periods on their calendars.
- Approximately 56.7% of listings show high availability (181+ days open annually), indicating potential for increased bookings or specific owner usage patterns.
- For booked days, the 181-270 days range is most frequent in Johnson (35.1%), reflecting common guest stay durations or potential owner blocking patterns.
- A notable 43.2% of properties secure long booking periods (181+ days booked per year), highlighting successful long-term rental strategies or significant owner usage.
Johnson Airbnb Minimum Stay Requirements Analysis
Distribution of Listings by Minimum Night Requirement
1 Night
2 listings
5.4% of total
2 Nights
18 listings
48.6% of total
3 Nights
3 listings
8.1% of total
7-29 Nights
2 listings
5.4% of total
30+ Nights
12 listings
32.4% of total
Key Insights
- The most prevalent minimum stay requirement in Johnson is 2 Nights, adopted by 48.6% of listings. This highlights the market's preference for shorter, flexible bookings.
- A significant segment (32.4%) caters to monthly stays (30+ nights) in Johnson, pointing to opportunities in the extended-stay market.
Recommendations
- Align with the market by considering a 2 Nights minimum stay, as 48.6% of Johnson hosts use this setting.
- If feasible, allowing 1-night stays, especially midweek or during low season, could capture last-minute bookings, as only 5.4% currently do.
- A 2-night minimum appears standard (48.6%). Consider this for weekends or peak periods.
- Explore offering discounts for stays of 30+ nights to attract the 32.4% of the market seeking extended stays.
- Adjust minimum nights based on seasonality – potentially shorter during low season and longer during peak demand periods in Johnson.
Johnson Airbnb Cancellation Policy Trends Analysis (2026)
Limited
2 listings
5.4% of total
Flexible
1 listings
2.7% of total
Moderate
5 listings
13.5% of total
Firm
22 listings
59.5% of total
Strict
7 listings
18.9% of total
Cancellation Policy Insights for Johnson
- The prevailing Airbnb cancellation policy trend in Johnson is Firm, used by 59.5% of listings.
- A majority (78.4%) of hosts in Johnson utilize Firm or Strict policies, indicating a market where hosts prioritize booking security.
Recommendations for Hosts
- Consider adopting a Firm policy to align with the 59.5% market standard in Johnson.
- Regularly review your cancellation policy against competitors and market demand shifts in Johnson.
Johnson STR Booking Lead Time Analysis (2026)
Average Booking Lead Time by Month
Booking Lead Time Insights for Johnson
- The overall average booking lead time for vacation rentals in Johnson is 46 days.
- Guests book furthest in advance for stays during October (average 75 days), likely coinciding with peak travel demand or local events.
- The shortest booking windows occur for stays in March (average 29 days), indicating more last-minute travel plans during this time.
- Seasonally, Summer (58 days avg.) sees the longest lead times, while Spring (38 days avg.) has the shortest, reflecting typical travel planning cycles.
Recommendations for Hosts
- Use the overall average lead time (46 days) as a baseline for your pricing and availability strategy in Johnson.
- For October stays, consider implementing length-of-stay discounts or slightly higher rates for bookings made less than 75 days out to capitalize on advance planning.
- Target marketing efforts for the Summer season well in advance (at least 58 days) to capture early planners.
- Monitor your own booking lead times against these Johnson averages to identify opportunities for dynamic pricing adjustments.
Popular & Essential Airbnb Amenities in Johnson (2026)
Amenity Prevalence
Amenity Insights for Johnson
- Essential amenities in Johnson that guests expect include: Coffee maker, Heating, Smoke alarm, Carbon monoxide alarm, Free parking on premises, Wifi, Dishes and silverware. Lacking these (any) could significantly impact bookings.
- Popular amenities like Refrigerator, Bed linens, Stove are common but not universal. Offering these can provide a competitive edge.
Recommendations for Hosts
- Ensure your listing includes all essential amenities for Johnson: Coffee maker, Heating, Smoke alarm, Carbon monoxide alarm, Free parking on premises, Wifi, Dishes and silverware.
- Prioritize adding missing essentials: Coffee maker, Heating, Smoke alarm, Carbon monoxide alarm, Free parking on premises, Wifi, Dishes and silverware.
- Consider adding popular differentiators like Refrigerator or Bed linens to increase appeal.
- Highlight unique or less common amenities you offer (e.g., hot tub, dedicated workspace, EV charger) in your listing description and photos.
- Regularly check competitor amenities in Johnson to stay competitive.
Johnson Airbnb Guest Demographics & Profile Analysis (2026)
Guest Profile Summary for Johnson
- The typical guest profile for Airbnb in Johnson consists of primarily domestic travelers (94%), often arriving from nearby New York, typically belonging to the Post-2000s (Gen Z/Alpha) group (50%), primarily speaking English or Spanish.
- Domestic travelers account for 94.4% of guests.
- Key international markets include United States (94.4%) and Canada (1.9%).
- Top languages spoken are English (68.5%) followed by Spanish (11%).
- A significant demographic segment is the Post-2000s (Gen Z/Alpha) group, representing 50% of guests.
Recommendations for Hosts
- Target domestic marketing efforts towards travelers from New York and Boston.
- Tailor amenities and listing descriptions to appeal to the dominant Post-2000s (Gen Z/Alpha) demographic (e.g., highlight fast WiFi, smart home features, local guides).
- Highlight unique local experiences or amenities relevant to the primary guest profile.
- Consider seasonal promotions aligned with peak travel times for key origin markets.
Nearby Short-Term Rental Market Comparison
How does the Johnson Airbnb market stack up against its neighbors? Compare key performance metrics like average monthly revenue, ADR, and occupancy rates in surrounding areas to understand the broader regional STR landscape.
| Market | Active Properties | Monthly Revenue | Daily Rate | Avg. Occupancy |
|---|---|---|---|---|
| Middletown Springs | 13 | $6,843 | $507.55 | 32% |
| Pomfret | 15 | $6,549 | $502.74 | 45% |
| Fort Ann | 35 | $6,238 | $790.41 | 37% |
| Hanover | 33 | $5,826 | $1189.51 | 41% |
| Barnstead | 36 | $5,090 | $477.12 | 42% |
| Goffstown | 13 | $5,066 | $343.72 | 53% |
| Malletts Bay | 51 | $4,842 | $444.86 | 41% |
| Town of Wilton | 103 | $4,841 | $862.83 | 38% |
| Jefferson | 28 | $4,793 | $474.72 | 40% |
| Wilmot | 11 | $4,667 | $334.67 | 51% |