Ferrisburgh Airbnb Market Analysis 2026: Short Term Rental Data & Vacation Rental Statistics in Vermont, United States
Is Airbnb profitable in Ferrisburgh in 2026? Explore comprehensive Airbnb analytics for Ferrisburgh, Vermont, United States to uncover income potential. This 2026 STR market report for Ferrisburgh, based on AirROI data from February 2025 to January 2026, reveals key trends in the niche market of 19 active listings.
Whether you're considering an Airbnb investment in Ferrisburgh, optimizing your existing vacation rental, or exploring rental arbitrage opportunities, understanding the Ferrisburgh Airbnb data is crucial. Understanding the local regulations is key to maximizing your short term rental income potential. Let's dive into the specifics.
Key Ferrisburgh Airbnb Performance Metrics Overview
Monthly Airbnb Revenue Variations & Income Potential in Ferrisburgh (2026)
Understanding the monthly revenue variations for Airbnb listings in Ferrisburgh is key to maximizing your short term rental income potential. Seasonality significantly impacts earnings. Our analysis, based on data from the past 12 months, shows that the peak revenue month for STRs in Ferrisburgh is typically August, while March often presents the lowest earnings, highlighting opportunities for strategic pricing adjustments during shoulder and low seasons. Explore the typical Airbnb income in Ferrisburgh across different performance tiers:
- Best-in-class properties (Top 10%) achieve $7,369+ monthly, often utilizing dynamic pricing and superior guest experiences.
- Strong performing properties (Top 25%) earn $4,410 or more, indicating effective management and desirable locations/amenities.
- Typical properties (Median) generate around $2,710 per month, representing the average market performance.
- Entry-level properties (Bottom 25%) see earnings around $1,481, often with potential for optimization.
Average Monthly Airbnb Earnings Trend in Ferrisburgh
Ferrisburgh Airbnb Occupancy Rate Trends (2026)
Maximize your bookings by understanding the Ferrisburgh STR occupancy trends. Seasonal demand shifts significantly influence how often properties are booked. Typically, Julysees the highest demand (peak season occupancy), while January experiences the lowest (low season). Effective strategies, like adjusting minimum stays or offering promotions, can boost occupancy during slower periods. Here's how different property tiers perform in Ferrisburgh:
- Best-in-class properties (Top 10%) achieve 73%+ occupancy, indicating high desirability and potentially optimized availability.
- Strong performing properties (Top 25%) maintain 60% or higher occupancy, suggesting good market fit and guest satisfaction.
- Typical properties (Median) have an occupancy rate around 42%.
- Entry-level properties (Bottom 25%) average 28% occupancy, potentially facing higher vacancy.
Average Monthly Occupancy Rate Trend in Ferrisburgh
Average Daily Rate (ADR) Airbnb Trends in Ferrisburgh (2026)
Effective short term rental pricing strategy in Ferrisburgh involves understanding monthly ADR fluctuations. The Average Daily Rate (ADR) for Airbnb in Ferrisburgh typically peaks in December and dips lowest during April. Leveraging Airbnb dynamic pricing tools or strategies based on this seasonality can significantly boost revenue. Here's a look at the typical nightly rates achieved:
- Best-in-class properties (Top 10%) command rates of $429+ per night, often due to premium features or locations.
- Strong performing properties (Top 25%) achieve nightly rates of $366 or more.
- Typical properties (Median) charge around $242 per night.
- Entry-level properties (Bottom 25%) earn around $161 per night.
Average Daily Rate (ADR) Trend by Month in Ferrisburgh
Get Live Ferrisburgh Market Intelligence 👇
Explore Real-time Analytics
Airbnb Seasonality Analysis & Trends in Ferrisburgh (2026)
Peak Season (August, July, October)
- Revenue averages $4,846 per month
- Occupancy rates average 58.2%
- Daily rates average $267
Shoulder Season
- Revenue averages $3,176 per month
- Occupancy maintains around 44.4%
- Daily rates hold near $266
Low Season (January, March, May)
- Revenue drops to average $1,934 per month
- Occupancy decreases to average 28.2%
- Daily rates adjust to average $265
Seasonality Insights for Ferrisburgh
- The Airbnb seasonality in Ferrisburgh shows highly seasonal trends requiring careful strategy. While the sections above show seasonal averages, it's also insightful to look at the extremes:
- During the high season, the absolute peak month showcases Ferrisburgh's highest earning potential, with monthly revenues capable of climbing to $5,200, occupancy reaching a high of 60.7%, and ADRs peaking at $279.
- Conversely, the slowest single month of the year, typically falling within the low season, marks the market's lowest point. In this month, revenue might dip to $1,711, occupancy could drop to 23.1%, and ADRs may adjust down to $257.
- Understanding both the seasonal averages and these monthly peaks and troughs in revenue, occupancy, and ADR is crucial for maximizing your Airbnb profit potential in Ferrisburgh.
Seasonal Strategies for Maximizing Profit
- Peak Season: Maximize revenue through premium pricing and potentially longer minimum stays. Ensure high availability.
- Low Season: Offer competitive pricing, special promotions (e.g., extended stay discounts), and flexible cancellation policies. Target off-season travelers like remote workers or budget-conscious guests.
- Shoulder Seasons: Implement dynamic pricing that balances peak and low rates. Target weekend travelers or specific events. Offer slightly more flexible terms than peak season.
- Regularly analyze your own performance against these Ferrisburgh seasonality benchmarks and adjust your pricing and availability strategy accordingly.
Best Areas for Airbnb Investment in Ferrisburgh (2026)
Exploring the top neighborhoods for short-term rentals in Ferrisburgh? This section highlights key areas, outlining why they are attractive for hosts and guests, along with notable local attractions. Consider these locations based on your target guest profile and investment strategy.
| Neighborhood / Area | Why Host Here? (Target Guests & Appeal) | Key Attractions & Landmarks |
|---|---|---|
| Lake Champlain | Breathtaking views and ample water activities make Lake Champlain a prime destination for vacationers seeking relaxation and adventure. Ideal for boats, fishing, and family gatherings. | Lake Champlain Ferries, Basin Harbor, Waterfront Park, Crown Point State Historic Site, Shelburne Museum, Grand Isle State Park |
| Vergennes | Known as the smallest city in Vermont with charming shops and historic sites, Vergennes attracts visitors seeking a quaint and cultural experience. | Vergennes Falls Park, Basin Harbor, Vermont Maple Museum, Otter Creek Brewery, Kennedy Park, The Vergennes Opera House |
| Shelburne | Shelburne is home to beautiful parks and museums, making it a great spot for families and culture enthusiasts. Its close proximity to Burlington offers additional attractions. | Shelburne Museum, Shelburne Farms, Overlook Park, Lakeside Park, The Roadside Stand, Frog Hollow Vermont State Craft Center |
| Burlington | Burlington is Vermont's largest city, offering vibrant nightlife, diverse dining, and stunning views of the Adirondack Mountains. A top choice for urban vacations. | Church Street Marketplace, Burlington Waterfront, ECHO Leahy Center for Lake Champlain, UVM Fleming Museum, Red Rocks Park, Battery Park |
| Stowe | Famous for skiing in winter and hiking in summer, Stowe provides year-round outdoor activities and a picturesque Vermont setting, perfect for nature lovers. | Stowe Mountain Resort, Smugglers Notch State Park, Stowe Recreation Path, Von Trapp Brewing, Topnotch Resort, Trapp Family Lodge |
| Middlebury | Home to Middlebury College, this scenic town offers beautiful landscapes and a vibrant arts scene, making it appealing to students and visitors alike. | Middlebury College, Otter Creek, National Museum of the Morgan Horse, The Henry Sheldon Museum, Middlebury River, Chipman Hill |
| Brandon | A charming small town that offers a laid-back atmosphere with access to nature and historic sites, suitable for weekend getaways. | Brandon Museum, Neshobe River, Brandon Town Hall, Otter Valley High School, Forest Park, The Brandon Flea Market |
| Addison | This small town provides a peaceful retreat with beautiful scenery and opportunities for outdoor activities, popular with those looking for quiet and relaxation. | Lake Champlain, Button Bay State Park, Addison Historical Society, Great Addington Scenic Area, Shoreham Chapel, Naomi’s Garden |
Understanding Airbnb License Requirements & STR Laws in Ferrisburgh (2026)
With 16% of listings showing registration in 2026, understanding potential Airbnb license requirements is crucial in Ferrisburgh. Always verify the latest short term rental regulations and Airbnb license requirements directly with local government authorities for Ferrisburgh to ensure full compliance before hosting.
(Source: AirROI data, 2026, based on 16% licensed listings)
Top Performing Airbnb Properties in Ferrisburgh (2026)
Benchmark your potential! Explore examples of top-performing Airbnb properties in Ferrisburghbased on Trailing Twelve Month (TTM) revenue. Analyze their characteristics, revenue, occupancy rate, and ADR to understand what drives success in this market.
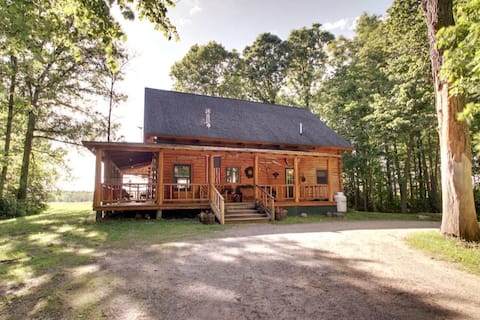
Beautiful Log Cabin with views near Lake
Entire Place • 3 bedrooms

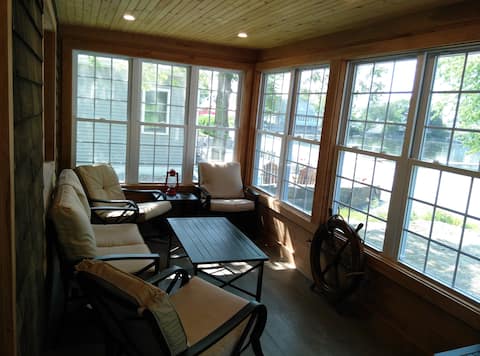
Historic Lake Front Home - The Rocks on Long Point
Entire Place • 3 bedrooms
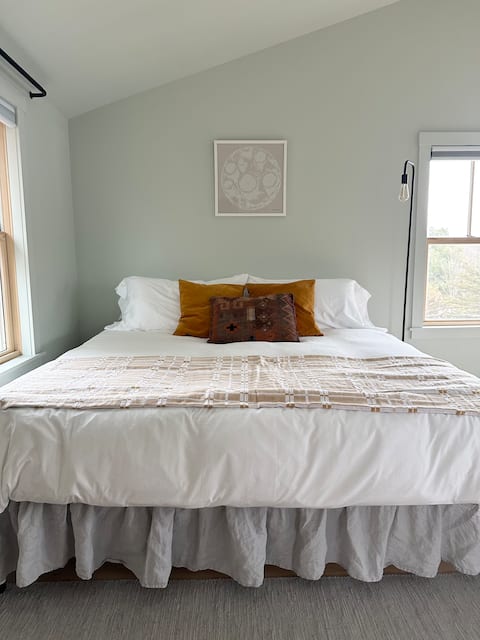
Studio with King Bed at Wild Strawberry Hill
Entire Place • N/A

Lake Champlain charming apartment amazing views
Entire Place • 1 bedroom
Completely renovated cottage on Lake Champlain
Entire Place • 3 bedrooms

Lakefront Home
Entire Place • 2 bedrooms
Note: Performance varies based on location, size, amenities, seasonality, and management quality. Data reflects the past 12 months.
Top Performing Airbnb Hosts in Ferrisburgh (2026)
Learn from the best! This table showcases top-performing Airbnb hosts in Ferrisburgh based on the number of properties managed and estimated total revenue over the past year. Analyze their scale and performance metrics.
| Host Name | Properties | Grossing Revenue | Stay Reviews | Avg Rating |
|---|---|---|---|---|
| Kristine | 1 | $83,174 | 34 | 4.91/5.0 |
| Emily | 1 | $51,931 | 5 | 5.00/5.0 |
| Kristen | 1 | $46,811 | 40 | 4.98/5.0 |
| Cheryl | 1 | $39,572 | 308 | 4.99/5.0 |
| Jeffrey | 2 | $39,542 | 162 | 4.79/5.0 |
| Alexis | 1 | $31,516 | 16 | 5.00/5.0 |
| Jamie | 1 | $29,226 | 31 | 5.00/5.0 |
| Victor | 1 | $26,050 | 2 | Not Rated |
| Devin | 1 | $24,449 | 35 | 4.97/5.0 |
| Rae | 1 | $20,892 | 29 | 4.76/5.0 |
Analyzing the strategies of top hosts, such as their property selection, pricing, and guest communication, can offer valuable lessons for optimizing your own Airbnb operations in Ferrisburgh.
Dive Deeper: Advanced Ferrisburgh STR Market Data (2026)
Ready to unlock more insights? AirROI provides access to advanced metrics and comprehensive Airbnb data for Ferrisburgh. Explore detailed analytics beyond this report to refine your investment strategy, optimize pricing, and maximize your vacation rental profits.
Explore Advanced MetricsFerrisburgh Short-Term Rental Market Composition (2026): Property & Room Types
Room Type Distribution
Property Type Distribution
Market Composition Insights for Ferrisburgh
- The Ferrisburgh Airbnb market composition is heavily skewed towards Entire Home/Apt listings, which make up 94.7% of the 19 active rentals. This indicates strong guest preference for privacy and space.
- Looking at the property type distribution in Ferrisburgh, House properties are the most common (52.6%), reflecting the local real estate landscape.
- Houses represent a significant 52.6% portion, catering likely to families or larger groups.
- The presence of 10.5% Hotel/Boutique listings indicates integration with traditional hospitality.
Ferrisburgh Airbnb Room Capacity Analysis (2026): Bedroom Distribution
Distribution of Listings by Number of Bedrooms
Room Capacity Insights for Ferrisburgh
- The dominant room capacity in Ferrisburgh is 1 bedroom listings, making up 36.8% of the market. This suggests a strong demand for properties suitable for couples or solo travelers.
- Together, 1 bedroom and 3 bedrooms properties represent 68.4% of the active Airbnb listings in Ferrisburgh, indicating a high concentration in these sizes.
- A significant 31.6% of listings offer 3+ bedrooms, catering to larger groups and families seeking more space in Ferrisburgh.
Ferrisburgh Vacation Rental Guest Capacity Trends (2026)
Distribution of Listings by Guest Capacity
Guest Capacity Insights for Ferrisburgh
- The most common guest capacity trend in Ferrisburgh vacation rentals is listings accommodating 2 guests (31.6%). This suggests the primary traveler segment is likely couples or solo travelers.
- Properties designed for 2 guests and 4 guests dominate the Ferrisburgh STR market, accounting for 57.9% of listings.
- 26.4% of properties accommodate 6+ guests, serving the market segment for larger families or group travel in Ferrisburgh.
- On average, properties in Ferrisburgh are equipped to host 4.1 guests.
Ferrisburgh Airbnb Booking Patterns (2026): Available vs. Booked Days
Available Days Distribution
Booked Days Distribution
Booking Pattern Insights for Ferrisburgh
- The most common availability pattern in Ferrisburgh falls within the 271-366 days range, representing 52.6% of listings. This suggests many properties have significant open periods on their calendars.
- Approximately 89.4% of listings show high availability (181+ days open annually), indicating potential for increased bookings or specific owner usage patterns.
- For booked days, the 91-180 days range is most frequent in Ferrisburgh (52.6%), reflecting common guest stay durations or potential owner blocking patterns.
- A notable 10.6% of properties secure long booking periods (181+ days booked per year), highlighting successful long-term rental strategies or significant owner usage.
Ferrisburgh Airbnb Minimum Stay Requirements Analysis
Distribution of Listings by Minimum Night Requirement
1 Night
2 listings
10.5% of total
2 Nights
4 listings
21.1% of total
3 Nights
4 listings
21.1% of total
4-6 Nights
3 listings
15.8% of total
7-29 Nights
1 listings
5.3% of total
30+ Nights
5 listings
26.3% of total
Key Insights
- The most prevalent minimum stay requirement in Ferrisburgh is 30+ Nights, adopted by 26.3% of listings. This highlights the market's preference for longer commitments.
- A significant segment (26.3%) caters to monthly stays (30+ nights) in Ferrisburgh, pointing to opportunities in the extended-stay market.
Recommendations
- Align with the market by considering a 30+ Nights minimum stay, as 26.3% of Ferrisburgh hosts use this setting.
- If feasible, allowing 1-night stays, especially midweek or during low season, could capture last-minute bookings, as only 10.5% currently do.
- Explore offering discounts for stays of 30+ nights to attract the 26.3% of the market seeking extended stays.
- Adjust minimum nights based on seasonality – potentially shorter during low season and longer during peak demand periods in Ferrisburgh.
Ferrisburgh Airbnb Cancellation Policy Trends Analysis (2026)
Flexible
3 listings
15.8% of total
Moderate
2 listings
10.5% of total
Firm
11 listings
57.9% of total
Strict
3 listings
15.8% of total
Cancellation Policy Insights for Ferrisburgh
- The prevailing Airbnb cancellation policy trend in Ferrisburgh is Firm, used by 57.9% of listings.
- A majority (73.7%) of hosts in Ferrisburgh utilize Firm or Strict policies, indicating a market where hosts prioritize booking security.
Recommendations for Hosts
- Consider adopting a Firm policy to align with the 57.9% market standard in Ferrisburgh.
- Regularly review your cancellation policy against competitors and market demand shifts in Ferrisburgh.
Ferrisburgh STR Booking Lead Time Analysis (2026)
Average Booking Lead Time by Month
Booking Lead Time Insights for Ferrisburgh
- The overall average booking lead time for vacation rentals in Ferrisburgh is 78 days.
- Guests book furthest in advance for stays during December (average 139 days), likely coinciding with peak travel demand or local events.
- The shortest booking windows occur for stays in January (average 51 days), indicating more last-minute travel plans during this time.
- Seasonally, Spring (86 days avg.) sees the longest lead times, while Winter (81 days avg.) has the shortest, reflecting typical travel planning cycles.
Recommendations for Hosts
- Use the overall average lead time (78 days) as a baseline for your pricing and availability strategy in Ferrisburgh.
- For December stays, consider implementing length-of-stay discounts or slightly higher rates for bookings made less than 139 days out to capitalize on advance planning.
- Target marketing efforts for the Spring season well in advance (at least 86 days) to capture early planners.
- Monitor your own booking lead times against these Ferrisburgh averages to identify opportunities for dynamic pricing adjustments.
Popular & Essential Airbnb Amenities in Ferrisburgh (2026)
Amenity Prevalence
Amenity Insights for Ferrisburgh
- Essential amenities in Ferrisburgh that guests expect include: Smoke alarm, Wifi, Free parking on premises. Lacking these (any) could significantly impact bookings.
- Popular amenities like Hot water, Kitchen, Carbon monoxide alarm are common but not universal. Offering these can provide a competitive edge.
Recommendations for Hosts
- Ensure your listing includes all essential amenities for Ferrisburgh: Smoke alarm, Wifi, Free parking on premises.
- Consider adding popular differentiators like Hot water or Kitchen to increase appeal.
- Highlight unique or less common amenities you offer (e.g., hot tub, dedicated workspace, EV charger) in your listing description and photos.
- Regularly check competitor amenities in Ferrisburgh to stay competitive.
Ferrisburgh Airbnb Guest Demographics & Profile Analysis (2026)
Guest Profile Summary for Ferrisburgh
- The typical guest profile for Airbnb in Ferrisburgh consists of primarily domestic travelers (97%), often arriving from nearby New York, typically belonging to the Post-2000s (Gen Z/Alpha) group (50%), primarily speaking English or German.
- Domestic travelers account for 96.7% of guests.
- Key international markets include United States (96.7%) and United Kingdom (1.7%).
- Top languages spoken are English (62.5%) followed by German (7.8%).
- A significant demographic segment is the Post-2000s (Gen Z/Alpha) group, representing 50% of guests.
Recommendations for Hosts
- Target domestic marketing efforts towards travelers from New York and Boston.
- Tailor amenities and listing descriptions to appeal to the dominant Post-2000s (Gen Z/Alpha) demographic (e.g., highlight fast WiFi, smart home features, local guides).
- Highlight unique local experiences or amenities relevant to the primary guest profile.
- Consider seasonal promotions aligned with peak travel times for key origin markets.
Nearby Short-Term Rental Market Comparison
How does the Ferrisburgh Airbnb market stack up against its neighbors? Compare key performance metrics like average monthly revenue, ADR, and occupancy rates in surrounding areas to understand the broader regional STR landscape.
| Market | Active Properties | Monthly Revenue | Daily Rate | Avg. Occupancy |
|---|---|---|---|---|
| Middletown Springs | 13 | $6,843 | $507.55 | 32% |
| Pomfret | 15 | $6,549 | $502.74 | 45% |
| Fort Ann | 35 | $6,238 | $790.41 | 37% |
| Hanover | 33 | $5,826 | $1189.51 | 41% |
| Mille-Isles | 89 | $5,219 | $472.25 | 38% |
| Malletts Bay | 51 | $4,842 | $444.86 | 41% |
| Town of Wilton | 103 | $4,841 | $862.83 | 38% |
| Town of Bolton | 140 | $4,533 | $693.78 | 37% |
| Putnam Station | 14 | $4,483 | $512.24 | 42% |
| Stowe | 875 | $4,424 | $529.19 | 38% |