Dummerston Airbnb Market Analysis 2026: Short Term Rental Data & Vacation Rental Statistics in Vermont, United States
Is Airbnb profitable in Dummerston in 2026? Explore comprehensive Airbnb analytics for Dummerston, Vermont, United States to uncover income potential. This 2026 STR market report for Dummerston, based on AirROI data from February 2025 to January 2026, reveals key trends in the niche market of 23 active listings.
Whether you're considering an Airbnb investment in Dummerston, optimizing your existing vacation rental, or exploring rental arbitrage opportunities, understanding the Dummerston Airbnb data is crucial. Leveraging the low regulation environment is key to maximizing your short term rental income potential. Let's dive into the specifics.
Key Dummerston Airbnb Performance Metrics Overview
Monthly Airbnb Revenue Variations & Income Potential in Dummerston (2026)
Understanding the monthly revenue variations for Airbnb listings in Dummerston is key to maximizing your short term rental income potential. Seasonality significantly impacts earnings. Our analysis, based on data from the past 12 months, shows that the peak revenue month for STRs in Dummerston is typically August, while March often presents the lowest earnings, highlighting opportunities for strategic pricing adjustments during shoulder and low seasons. Explore the typical Airbnb income in Dummerston across different performance tiers:
- Best-in-class properties (Top 10%) achieve $6,136+ monthly, often utilizing dynamic pricing and superior guest experiences.
- Strong performing properties (Top 25%) earn $4,394 or more, indicating effective management and desirable locations/amenities.
- Typical properties (Median) generate around $2,317 per month, representing the average market performance.
- Entry-level properties (Bottom 25%) see earnings around $1,467, often with potential for optimization.
Average Monthly Airbnb Earnings Trend in Dummerston
Dummerston Airbnb Occupancy Rate Trends (2026)
Maximize your bookings by understanding the Dummerston STR occupancy trends. Seasonal demand shifts significantly influence how often properties are booked. Typically, Augustsees the highest demand (peak season occupancy), while May experiences the lowest (low season). Effective strategies, like adjusting minimum stays or offering promotions, can boost occupancy during slower periods. Here's how different property tiers perform in Dummerston:
- Best-in-class properties (Top 10%) achieve 77%+ occupancy, indicating high desirability and potentially optimized availability.
- Strong performing properties (Top 25%) maintain 64% or higher occupancy, suggesting good market fit and guest satisfaction.
- Typical properties (Median) have an occupancy rate around 47%.
- Entry-level properties (Bottom 25%) average 28% occupancy, potentially facing higher vacancy.
Average Monthly Occupancy Rate Trend in Dummerston
Average Daily Rate (ADR) Airbnb Trends in Dummerston (2026)
Effective short term rental pricing strategy in Dummerston involves understanding monthly ADR fluctuations. The Average Daily Rate (ADR) for Airbnb in Dummerston typically peaks in October and dips lowest during March. Leveraging Airbnb dynamic pricing tools or strategies based on this seasonality can significantly boost revenue. Here's a look at the typical nightly rates achieved:
- Best-in-class properties (Top 10%) command rates of $393+ per night, often due to premium features or locations.
- Strong performing properties (Top 25%) achieve nightly rates of $250 or more.
- Typical properties (Median) charge around $156 per night.
- Entry-level properties (Bottom 25%) earn around $121 per night.
Average Daily Rate (ADR) Trend by Month in Dummerston
Get Live Dummerston Market Intelligence 👇

Explore Real-time Analytics
Airbnb Seasonality Analysis & Trends in Dummerston (2026)
Peak Season (August, October, June)
- Revenue averages $3,997 per month
- Occupancy rates average 56.9%
- Daily rates average $204
Shoulder Season
- Revenue averages $3,012 per month
- Occupancy maintains around 44.5%
- Daily rates hold near $203
Low Season (March, April, May)
- Revenue drops to average $1,940 per month
- Occupancy decreases to average 35.9%
- Daily rates adjust to average $182
Seasonality Insights for Dummerston
- The Airbnb seasonality in Dummerston shows highly seasonal trends requiring careful strategy. While the sections above show seasonal averages, it's also insightful to look at the extremes:
- During the high season, the absolute peak month showcases Dummerston's highest earning potential, with monthly revenues capable of climbing to $4,548, occupancy reaching a high of 62.8%, and ADRs peaking at $217.
- Conversely, the slowest single month of the year, typically falling within the low season, marks the market's lowest point. In this month, revenue might dip to $1,621, occupancy could drop to 33.6%, and ADRs may adjust down to $180.
- Understanding both the seasonal averages and these monthly peaks and troughs in revenue, occupancy, and ADR is crucial for maximizing your Airbnb profit potential in Dummerston.
Seasonal Strategies for Maximizing Profit
- Peak Season: Maximize revenue through premium pricing and potentially longer minimum stays. Ensure high availability.
- Low Season: Offer competitive pricing, special promotions (e.g., extended stay discounts), and flexible cancellation policies. Target off-season travelers like remote workers or budget-conscious guests.
- Shoulder Seasons: Implement dynamic pricing that balances peak and low rates. Target weekend travelers or specific events. Offer slightly more flexible terms than peak season.
- Regularly analyze your own performance against these Dummerston seasonality benchmarks and adjust your pricing and availability strategy accordingly.
Best Areas for Airbnb Investment in Dummerston (2026)
Exploring the top neighborhoods for short-term rentals in Dummerston? This section highlights key areas, outlining why they are attractive for hosts and guests, along with notable local attractions. Consider these locations based on your target guest profile and investment strategy.
| Neighborhood / Area | Why Host Here? (Target Guests & Appeal) | Key Attractions & Landmarks |
|---|---|---|
| Dummerston Center | Charming village center with historic buildings and beautiful landscapes, attracting both nature lovers and history enthusiasts. Ideal for a peaceful getaway amidst natural beauty. | Dummerston Covered Bridge, Wellington State Forest, The Dummerston Historical Society, Gardner Memorial Park |
| West Dummerston | Quaint and picturesque area known for its serene environment and proximity to nature. Perfect for guests looking to enjoy tranquility and outdoor activities. | West Dummerston Covered Bridge, Horse Hill Wildlife Management Area, West River Trail |
| Dummerston Forest | A nature lover's paradise with trails and unspoiled landscapes, great for individuals and families who love hiking and exploring the outdoors. | Dummerston Town Forest, Nature trails and hiking paths |
| Green Mountain National Forest | Lush forest area offering numerous hiking, hunting, and fishing opportunities. Great for those seeking adventure and outdoor recreational activities. | Mount Stratton, Hiking trails, Scenic views |
| Marlboro | Nearby town with artistic community and vibrant culture. Attracts those interested in arts, crafts, and local festivals. Great small-town charm. | Marlboro Music Festival, Baker's Pond, Hiking trails |
| Brattleboro | Close to Dummerston, this vibrant town has a lively arts scene, shops, and restaurants. Benefits from travelers looking for a mix of culture and nature. | Brattleboro Museum & Art Center, The Retreat Farm, Connecticut River |
| Putney | Another nearby small town known for its welcoming community and a variety of outdoor activities. Perfect for families and nature enthusiasts. | Putney Mountain, Putney Central School, Local artisan shops |
| West Brattleboro | Scenic area with stunning views and access to outdoor activities. Popular with those looking for a retreat that combines comfort and nature. | Charming countryside views, Access to hiking trails, Close to Brattleboro |
Understanding Airbnb License Requirements & STR Laws in Dummerston (2026)
While Dummerston, Vermont, United States currently shows low STR regulations, specific Airbnb license requirements might still exist or change. Always verify the latest short term rental regulations and Airbnb license requirements directly with local government authorities for Dummerston to ensure full compliance before hosting.
(Source: AirROI data, 2026, based on 9% licensed listings)
Top Performing Airbnb Properties in Dummerston (2026)
Benchmark your potential! Explore examples of top-performing Airbnb properties in Dummerstonbased on Trailing Twelve Month (TTM) revenue. Analyze their characteristics, revenue, occupancy rate, and ADR to understand what drives success in this market.
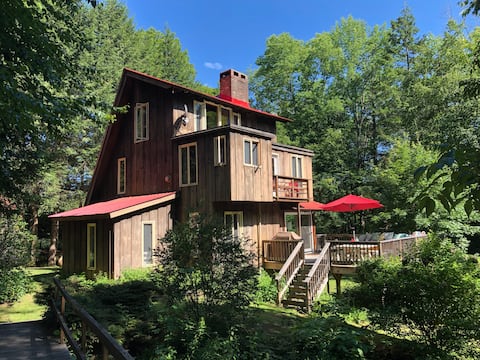
Pinecone Pond
Entire Place • 3 bedrooms
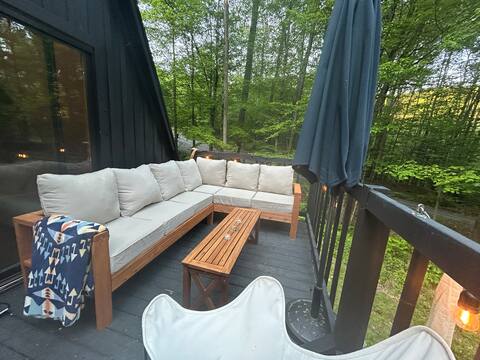
Peaceful VT A-Frame Wood-Fired Sauna in the Forest
Entire Place • 2 bedrooms
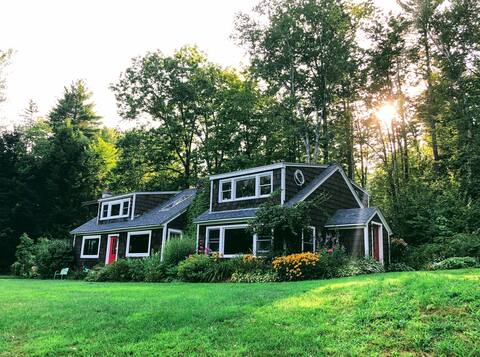
Owl Woods Vermont
Entire Place • 3 bedrooms
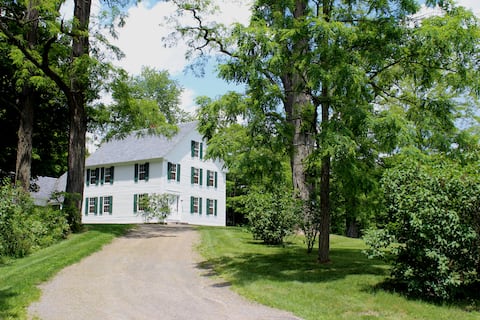
The Dutton Farmhouse
Entire Place • 4 bedrooms
The Church Sanctuary
Entire Place • 2 bedrooms

Cozy Riverfront Cabin-Ski, Swim, Fish, Float, Hike
Entire Place • 2 bedrooms
Note: Performance varies based on location, size, amenities, seasonality, and management quality. Data reflects the past 12 months.
Top Performing Airbnb Hosts in Dummerston (2026)
Learn from the best! This table showcases top-performing Airbnb hosts in Dummerston based on the number of properties managed and estimated total revenue over the past year. Analyze their scale and performance metrics.
| Host Name | Properties | Grossing Revenue | Stay Reviews | Avg Rating |
|---|---|---|---|---|
| Claire | 3 | $89,049 | 215 | 4.95/5.0 |
| Brianna | 3 | $68,613 | 1166 | 4.93/5.0 |
| Catherine | 1 | $65,710 | 358 | 4.99/5.0 |
| Nick And Natalie | 2 | $57,100 | 89 | 4.92/5.0 |
| Jonathan | 1 | $56,814 | 24 | 4.96/5.0 |
| Antonia | 1 | $52,148 | 29 | 4.93/5.0 |
| Lauren | 1 | $49,190 | 60 | 4.97/5.0 |
| Evolve | 1 | $44,474 | 58 | 4.84/5.0 |
| Cheryl | 1 | $25,628 | 267 | 4.92/5.0 |
| Aisha | 1 | $25,354 | 30 | 5.00/5.0 |
Analyzing the strategies of top hosts, such as their property selection, pricing, and guest communication, can offer valuable lessons for optimizing your own Airbnb operations in Dummerston.
Dive Deeper: Advanced Dummerston STR Market Data (2026)
Ready to unlock more insights? AirROI provides access to advanced metrics and comprehensive Airbnb data for Dummerston. Explore detailed analytics beyond this report to refine your investment strategy, optimize pricing, and maximize your vacation rental profits.
Explore Advanced MetricsDummerston Short-Term Rental Market Composition (2026): Property & Room Types
Room Type Distribution
Property Type Distribution
Market Composition Insights for Dummerston
- The Dummerston Airbnb market composition is heavily skewed towards Entire Home/Apt listings, which make up 87% of the 23 active rentals. This indicates strong guest preference for privacy and space.
- Looking at the property type distribution in Dummerston, Outdoor/Unique properties are the most common (34.8%), reflecting the local real estate landscape.
- Houses represent a significant 26.1% portion, catering likely to families or larger groups.
- The presence of 8.7% Hotel/Boutique listings indicates integration with traditional hospitality.
Dummerston Airbnb Room Capacity Analysis (2026): Bedroom Distribution
Distribution of Listings by Number of Bedrooms
Room Capacity Insights for Dummerston
- The dominant room capacity in Dummerston is 2 bedrooms listings, making up 34.8% of the market. This suggests a strong demand for properties suitable for couples or solo travelers.
- Together, 2 bedrooms and 1 bedroom properties represent 65.2% of the active Airbnb listings in Dummerston, indicating a high concentration in these sizes.
- A significant 21.7% of listings offer 3+ bedrooms, catering to larger groups and families seeking more space in Dummerston.
Dummerston Vacation Rental Guest Capacity Trends (2026)
Distribution of Listings by Guest Capacity
Guest Capacity Insights for Dummerston
- The most common guest capacity trend in Dummerston vacation rentals is listings accommodating 4 guests (30.4%). This suggests the primary traveler segment is likely small families or groups.
- Properties designed for 4 guests and 2 guests dominate the Dummerston STR market, accounting for 56.5% of listings.
- 26.0% of properties accommodate 6+ guests, serving the market segment for larger families or group travel in Dummerston.
- On average, properties in Dummerston are equipped to host 3.7 guests.
Dummerston Airbnb Booking Patterns (2026): Available vs. Booked Days
Available Days Distribution
Booked Days Distribution
Booking Pattern Insights for Dummerston
- The most common availability pattern in Dummerston falls within the 181-270 days range, representing 43.5% of listings. This suggests many properties have significant open periods on their calendars.
- Approximately 73.9% of listings show high availability (181+ days open annually), indicating potential for increased bookings or specific owner usage patterns.
- For booked days, the 91-180 days range is most frequent in Dummerston (39.1%), reflecting common guest stay durations or potential owner blocking patterns.
- A notable 30.4% of properties secure long booking periods (181+ days booked per year), highlighting successful long-term rental strategies or significant owner usage.
Dummerston Airbnb Minimum Stay Requirements Analysis
Distribution of Listings by Minimum Night Requirement
1 Night
3 listings
13% of total
2 Nights
8 listings
34.8% of total
3 Nights
1 listings
4.3% of total
30+ Nights
11 listings
47.8% of total
Key Insights
- The most prevalent minimum stay requirement in Dummerston is 30+ Nights, adopted by 47.8% of listings. This highlights the market's preference for longer commitments.
- A significant segment (47.8%) caters to monthly stays (30+ nights) in Dummerston, pointing to opportunities in the extended-stay market.
Recommendations
- Align with the market by considering a 30+ Nights minimum stay, as 47.8% of Dummerston hosts use this setting.
- If feasible, allowing 1-night stays, especially midweek or during low season, could capture last-minute bookings, as only 13% currently do.
- A 2-night minimum appears standard (34.8%). Consider this for weekends or peak periods.
- Explore offering discounts for stays of 30+ nights to attract the 47.8% of the market seeking extended stays.
- Adjust minimum nights based on seasonality – potentially shorter during low season and longer during peak demand periods in Dummerston.
Dummerston Airbnb Cancellation Policy Trends Analysis (2026)
Flexible
5 listings
21.7% of total
Moderate
5 listings
21.7% of total
Firm
6 listings
26.1% of total
Strict
7 listings
30.4% of total
Cancellation Policy Insights for Dummerston
- The prevailing Airbnb cancellation policy trend in Dummerston is Strict, used by 30.4% of listings.
- A majority (56.5%) of hosts in Dummerston utilize Firm or Strict policies, indicating a market where hosts prioritize booking security.
Recommendations for Hosts
- Consider adopting a Strict policy to align with the 30.4% market standard in Dummerston.
- With 30.4% using Strict terms, this is a viable option in Dummerston, particularly for high-value properties or during peak demand periods.
- Regularly review your cancellation policy against competitors and market demand shifts in Dummerston.
Dummerston STR Booking Lead Time Analysis (2026)
Average Booking Lead Time by Month
Booking Lead Time Insights for Dummerston
- The overall average booking lead time for vacation rentals in Dummerston is 61 days.
- Guests book furthest in advance for stays during October (average 102 days), likely coinciding with peak travel demand or local events.
- The shortest booking windows occur for stays in March (average 37 days), indicating more last-minute travel plans during this time.
- Seasonally, Fall (81 days avg.) sees the longest lead times, while Winter (46 days avg.) has the shortest, reflecting typical travel planning cycles.
Recommendations for Hosts
- Use the overall average lead time (61 days) as a baseline for your pricing and availability strategy in Dummerston.
- For October stays, consider implementing length-of-stay discounts or slightly higher rates for bookings made less than 102 days out to capitalize on advance planning.
- Target marketing efforts for the Fall season well in advance (at least 81 days) to capture early planners.
- Monitor your own booking lead times against these Dummerston averages to identify opportunities for dynamic pricing adjustments.
Popular & Essential Airbnb Amenities in Dummerston (2026)
Amenity Prevalence
Amenity Insights for Dummerston
- Essential amenities in Dummerston that guests expect include: Carbon monoxide alarm, Smoke alarm, Fire extinguisher, Free parking on premises, Wifi, Essentials, Dishes and silverware, Hot water, Kitchen. Lacking these (any) could significantly impact bookings.
- Popular amenities like Bed linens are common but not universal. Offering these can provide a competitive edge.
Recommendations for Hosts
- Ensure your listing includes all essential amenities for Dummerston: Carbon monoxide alarm, Smoke alarm, Fire extinguisher, Free parking on premises, Wifi, Essentials, Dishes and silverware, Hot water, Kitchen.
- Prioritize adding missing essentials: Free parking on premises, Wifi, Essentials, Dishes and silverware, Hot water, Kitchen.
- Consider adding popular differentiators like Bed linens to increase appeal.
- Highlight unique or less common amenities you offer (e.g., hot tub, dedicated workspace, EV charger) in your listing description and photos.
- Regularly check competitor amenities in Dummerston to stay competitive.
Dummerston Airbnb Guest Demographics & Profile Analysis (2026)
Guest Profile Summary for Dummerston
- The typical guest profile for Airbnb in Dummerston consists of primarily domestic travelers (95%), often arriving from nearby New York, typically belonging to the Post-2000s (Gen Z/Alpha) group (50%), primarily speaking English or Spanish.
- Domestic travelers account for 95.2% of guests.
- Key international markets include United States (95.2%) and United Kingdom (1.8%).
- Top languages spoken are English (69.9%) followed by Spanish (12.3%).
- A significant demographic segment is the Post-2000s (Gen Z/Alpha) group, representing 50% of guests.
Recommendations for Hosts
- Target domestic marketing efforts towards travelers from New York and Boston.
- Tailor amenities and listing descriptions to appeal to the dominant Post-2000s (Gen Z/Alpha) demographic (e.g., highlight fast WiFi, smart home features, local guides).
- Highlight unique local experiences or amenities relevant to the primary guest profile.
- Consider seasonal promotions aligned with peak travel times for key origin markets.
Nearby Short-Term Rental Market Comparison
How does the Dummerston Airbnb market stack up against its neighbors? Compare key performance metrics like average monthly revenue, ADR, and occupancy rates in surrounding areas to understand the broader regional STR landscape.
| Market | Active Properties | Monthly Revenue | Daily Rate | Avg. Occupancy |
|---|---|---|---|---|
| Middletown Springs | 13 | $6,843 | $507.55 | 32% |
| Pomfret | 15 | $6,549 | $502.74 | 45% |
| Fort Ann | 35 | $6,238 | $790.41 | 37% |
| Town of East Hampton | 1,327 | $5,945 | $986.02 | 36% |
| Hanover | 33 | $5,826 | $1189.51 | 41% |
| Middletown | 395 | $5,781 | $589.01 | 45% |
| North Andover | 12 | $5,625 | $440.84 | 45% |
| Town of Ancram | 22 | $5,616 | $512.55 | 38% |
| New Shoreham | 120 | $5,359 | $637.79 | 45% |
| Wellesley | 22 | $5,310 | $520.90 | 50% |