Corinth Airbnb Market Analysis 2026: Short Term Rental Data & Vacation Rental Statistics in Vermont, United States
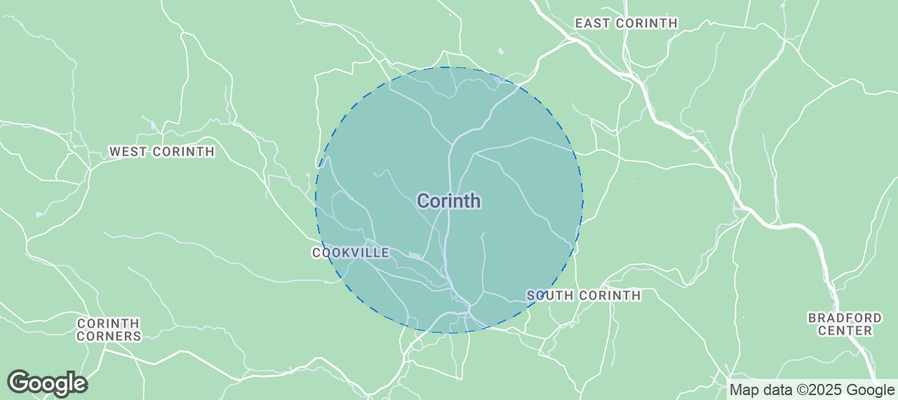
Is Airbnb profitable in Corinth in 2026? Explore comprehensive Airbnb analytics for Corinth, Vermont, United States to uncover income potential. This 2026 STR market report for Corinth, based on AirROI data from February 2025 to January 2026, reveals key trends in the niche market of 26 active listings.
Whether you're considering an Airbnb investment in Corinth, optimizing your existing vacation rental, or exploring rental arbitrage opportunities, understanding the Corinth Airbnb data is crucial. Understanding the local regulations is key to maximizing your short term rental income potential. Let's dive into the specifics.
Key Corinth Airbnb Performance Metrics Overview
Monthly Airbnb Revenue Variations & Income Potential in Corinth (2026)
Understanding the monthly revenue variations for Airbnb listings in Corinth is key to maximizing your short term rental income potential. Seasonality significantly impacts earnings. Our analysis, based on data from the past 12 months, shows that the peak revenue month for STRs in Corinth is typically July, while January often presents the lowest earnings, highlighting opportunities for strategic pricing adjustments during shoulder and low seasons. Explore the typical Airbnb income in Corinth across different performance tiers:
- Best-in-class properties (Top 10%) achieve $6,293+ monthly, often utilizing dynamic pricing and superior guest experiences.
- Strong performing properties (Top 25%) earn $4,549 or more, indicating effective management and desirable locations/amenities.
- Typical properties (Median) generate around $2,611 per month, representing the average market performance.
- Entry-level properties (Bottom 25%) see earnings around $1,324, often with potential for optimization.
Average Monthly Airbnb Earnings Trend in Corinth
Corinth Airbnb Occupancy Rate Trends (2026)
Maximize your bookings by understanding the Corinth STR occupancy trends. Seasonal demand shifts significantly influence how often properties are booked. Typically, Julysees the highest demand (peak season occupancy), while January experiences the lowest (low season). Effective strategies, like adjusting minimum stays or offering promotions, can boost occupancy during slower periods. Here's how different property tiers perform in Corinth:
- Best-in-class properties (Top 10%) achieve 80%+ occupancy, indicating high desirability and potentially optimized availability.
- Strong performing properties (Top 25%) maintain 62% or higher occupancy, suggesting good market fit and guest satisfaction.
- Typical properties (Median) have an occupancy rate around 38%.
- Entry-level properties (Bottom 25%) average 21% occupancy, potentially facing higher vacancy.
Average Monthly Occupancy Rate Trend in Corinth
Average Daily Rate (ADR) Airbnb Trends in Corinth (2026)
Effective short term rental pricing strategy in Corinth involves understanding monthly ADR fluctuations. The Average Daily Rate (ADR) for Airbnb in Corinth typically peaks in January and dips lowest during March. Leveraging Airbnb dynamic pricing tools or strategies based on this seasonality can significantly boost revenue. Here's a look at the typical nightly rates achieved:
- Best-in-class properties (Top 10%) command rates of $367+ per night, often due to premium features or locations.
- Strong performing properties (Top 25%) achieve nightly rates of $257 or more.
- Typical properties (Median) charge around $216 per night.
- Entry-level properties (Bottom 25%) earn around $168 per night.
Average Daily Rate (ADR) Trend by Month in Corinth
Get Live Corinth Market Intelligence 👇
Explore Real-time Analytics
Airbnb Seasonality Analysis & Trends in Corinth (2026)
Peak Season (July, April, May)
- Revenue averages $3,800 per month
- Occupancy rates average 45.3%
- Daily rates average $221
Shoulder Season
- Revenue averages $3,203 per month
- Occupancy maintains around 46.6%
- Daily rates hold near $224
Low Season (January, June, December)
- Revenue drops to average $2,571 per month
- Occupancy decreases to average 34.6%
- Daily rates adjust to average $229
Seasonality Insights for Corinth
- The Airbnb seasonality in Corinth shows moderate seasonality with distinct peak and low periods. While the sections above show seasonal averages, it's also insightful to look at the extremes:
- During the high season, the absolute peak month showcases Corinth's highest earning potential, with monthly revenues capable of climbing to $4,229, occupancy reaching a high of 54.4%, and ADRs peaking at $232.
- Conversely, the slowest single month of the year, typically falling within the low season, marks the market's lowest point. In this month, revenue might dip to $2,168, occupancy could drop to 27.0%, and ADRs may adjust down to $216.
- Understanding both the seasonal averages and these monthly peaks and troughs in revenue, occupancy, and ADR is crucial for maximizing your Airbnb profit potential in Corinth.
Seasonal Strategies for Maximizing Profit
- Peak Season: Maximize revenue through premium pricing and potentially longer minimum stays. Ensure high availability.
- Low Season: Offer competitive pricing, special promotions (e.g., extended stay discounts), and flexible cancellation policies. Target off-season travelers like remote workers or budget-conscious guests.
- Shoulder Seasons: Implement dynamic pricing that balances peak and low rates. Target weekend travelers or specific events. Offer slightly more flexible terms than peak season.
- Regularly analyze your own performance against these Corinth seasonality benchmarks and adjust your pricing and availability strategy accordingly.
Best Areas for Airbnb Investment in Corinth (2026)
Exploring the top neighborhoods for short-term rentals in Corinth? This section highlights key areas, outlining why they are attractive for hosts and guests, along with notable local attractions. Consider these locations based on your target guest profile and investment strategy.
| Neighborhood / Area | Why Host Here? (Target Guests & Appeal) | Key Attractions & Landmarks |
|---|---|---|
| Lake Champlain | A stunning freshwater lake surrounded by picturesque landscapes and historical sites, attracting tourists throughout the year for outdoor activities and relaxation. | Boat tours, Biking trails, Fishing spots, State parks, Historic sites |
| Green Mountain National Forest | A beautiful area for nature lovers and adventure seekers, known for hiking, camping, and stunning fall foliage views, appealing to both tourists and locals. | Hiking trails, Scenic viewpoints, Camping sites, Wildlife watching |
| Quechee Gorge | Vermont's deepest gorge offering breathtaking views and outdoor activities, popular with visitors looking for scenic hikes and photography opportunities. | Quechee Gorge Village, Hiking trails, Vermont Institute of Natural Science, Picnic areas |
| Woodstock | A charming New England village with historic charm, boutique shopping, and cultural events throughout the year, drawing visitors for its quaint ambiance. | Woodstock village, Billings Farm and Museum, Marsh-Billings-Rockefeller National Historical Park, Covered bridges |
| Manchester | Known for its upscale shopping and dining, along with outdoor recreation options, this area appeals to visitors looking for a luxurious retreat in the mountains. | Shopping outlets, Hiking trails, Southern Vermont Art Center, Bromley Mountain Ski Resort |
| Stowe | A year-round destination known for skiing in winter and beautiful landscapes in summer, popular for both adventure sports and relaxing getaways. | Stowe Mountain Resort, Biking paths, Stowe Village, Brewery tours |
| Shelburne | Home to the beautiful Shelburne Museum and nearby lake activities, this area attracts both cultural enthusiasts and nature lovers looking for a peaceful stay. | Shelburne Museum, Lake activities, Botanical gardens, Winery tours |
| Burlington | Vermont's largest city, known for its vibrant community, arts scene, and proximity to Lake Champlain, making it an appealing destination for urban explorers. | Church Street Marketplace, Waterfront Park, Burlington Bike Path, Local breweries |
Understanding Airbnb License Requirements & STR Laws in Corinth (2026)
With 15% of listings showing registration in 2026, understanding potential Airbnb license requirements is crucial in Corinth. Always verify the latest short term rental regulations and Airbnb license requirements directly with local government authorities for Corinth to ensure full compliance before hosting.
(Source: AirROI data, 2026, based on 15% licensed listings)
Top Performing Airbnb Properties in Corinth (2026)
Benchmark your potential! Explore examples of top-performing Airbnb properties in Corinthbased on Trailing Twelve Month (TTM) revenue. Analyze their characteristics, revenue, occupancy rate, and ADR to understand what drives success in this market.

Skip's Place
Entire Place • 3 bedrooms

Dawnside - Green Mtns Home with White Mtns View
Entire Place • 3 bedrooms

The Pond Cottage at Taplin Hill Farm
Entire Place • 1 bedroom

The Guest House at Chandlery Farm
Entire Place • 2 bedrooms
Scenic Barn Loft on Private Vermont Estate
Entire Place • 2 bedrooms
Mountain House – A hilltop family home
Entire Place • 3 bedrooms
Note: Performance varies based on location, size, amenities, seasonality, and management quality. Data reflects the past 12 months.
Top Performing Airbnb Hosts in Corinth (2026)
Learn from the best! This table showcases top-performing Airbnb hosts in Corinth based on the number of properties managed and estimated total revenue over the past year. Analyze their scale and performance metrics.
| Host Name | Properties | Grossing Revenue | Stay Reviews | Avg Rating |
|---|---|---|---|---|
| Tom | 4 | $138,254 | 301 | 4.96/5.0 |
| Steve | 2 | $84,519 | 173 | 4.98/5.0 |
| Matthew | 1 | $65,601 | 252 | 4.99/5.0 |
| Erich | 1 | $63,799 | 341 | 4.99/5.0 |
| Winter River Glampground | 9 | $45,881 | 163 | 4.98/5.0 |
| Jessica | 1 | $40,324 | 65 | 4.95/5.0 |
| Peggy | 1 | $33,409 | 17 | 4.94/5.0 |
| Dwayna | 2 | $32,644 | 118 | 4.98/5.0 |
| John C | 1 | $23,279 | 45 | 5.00/5.0 |
| Sandra2 | 1 | $20,011 | 201 | 4.96/5.0 |
Analyzing the strategies of top hosts, such as their property selection, pricing, and guest communication, can offer valuable lessons for optimizing your own Airbnb operations in Corinth.
Dive Deeper: Advanced Corinth STR Market Data (2026)
Ready to unlock more insights? AirROI provides access to advanced metrics and comprehensive Airbnb data for Corinth. Explore detailed analytics beyond this report to refine your investment strategy, optimize pricing, and maximize your vacation rental profits.
Explore Advanced MetricsCorinth Short-Term Rental Market Composition (2026): Property & Room Types
Room Type Distribution
Property Type Distribution
Market Composition Insights for Corinth
- The Corinth Airbnb market composition is heavily skewed towards Entire Home/Apt listings, which make up 100% of the 26 active rentals. This indicates strong guest preference for privacy and space.
- Looking at the property type distribution in Corinth, Others properties are the most common (30.8%), reflecting the local real estate landscape.
- Houses represent a significant 23.1% portion, catering likely to families or larger groups.
- Smaller segments like unique stays, hotel/boutique (combined 7.6%) offer potential for unique stay experiences.
Corinth Airbnb Room Capacity Analysis (2026): Bedroom Distribution
Distribution of Listings by Number of Bedrooms
Room Capacity Insights for Corinth
- The dominant room capacity in Corinth is 1 bedroom listings, making up 46.2% of the market. This suggests a strong demand for properties suitable for couples or solo travelers.
- Together, 1 bedroom and 3 bedrooms properties represent 73.1% of the active Airbnb listings in Corinth, indicating a high concentration in these sizes.
- A significant 30.7% of listings offer 3+ bedrooms, catering to larger groups and families seeking more space in Corinth.
Corinth Vacation Rental Guest Capacity Trends (2026)
Distribution of Listings by Guest Capacity
Guest Capacity Insights for Corinth
- The most common guest capacity trend in Corinth vacation rentals is listings accommodating 2 guests (50%). This suggests the primary traveler segment is likely couples or solo travelers.
- Properties designed for 2 guests and 8+ guests dominate the Corinth STR market, accounting for 65.4% of listings.
- A significant 50.0% of listings cater specifically to 1-2 guests, highlighting strong demand from couples and solo travelers in Corinth.
- 26.9% of properties accommodate 6+ guests, serving the market segment for larger families or group travel in Corinth.
- On average, properties in Corinth are equipped to host 4.0 guests.
Corinth Airbnb Booking Patterns (2026): Available vs. Booked Days
Available Days Distribution
Booked Days Distribution
Booking Pattern Insights for Corinth
- The most common availability pattern in Corinth falls within the 271-366 days range, representing 57.7% of listings. This suggests many properties have significant open periods on their calendars.
- Approximately 92.3% of listings show high availability (181+ days open annually), indicating potential for increased bookings or specific owner usage patterns.
- For booked days, the 1-30 days range is most frequent in Corinth (38.5%), reflecting common guest stay durations or potential owner blocking patterns.
- A notable 7.7% of properties secure long booking periods (181+ days booked per year), highlighting successful long-term rental strategies or significant owner usage.
Corinth Airbnb Minimum Stay Requirements Analysis
Distribution of Listings by Minimum Night Requirement
1 Night
11 listings
42.3% of total
2 Nights
3 listings
11.5% of total
3 Nights
2 listings
7.7% of total
30+ Nights
10 listings
38.5% of total
Key Insights
- The most prevalent minimum stay requirement in Corinth is 1 Night, adopted by 42.3% of listings. This highlights the market's preference for shorter, flexible bookings.
- A significant segment (38.5%) caters to monthly stays (30+ nights) in Corinth, pointing to opportunities in the extended-stay market.
Recommendations
- Align with the market by considering a 1 Night minimum stay, as 42.3% of Corinth hosts use this setting.
- Explore offering discounts for stays of 30+ nights to attract the 38.5% of the market seeking extended stays.
- Adjust minimum nights based on seasonality – potentially shorter during low season and longer during peak demand periods in Corinth.
Corinth Airbnb Cancellation Policy Trends Analysis (2026)
Limited
9 listings
34.6% of total
Flexible
5 listings
19.2% of total
Moderate
7 listings
26.9% of total
Firm
5 listings
19.2% of total
Cancellation Policy Insights for Corinth
- The prevailing Airbnb cancellation policy trend in Corinth is Limited, used by 34.6% of listings.
- There's a relatively balanced mix between guest-friendly (46.1%) and stricter (19.2%) policies, offering choices for different guest needs.
Recommendations for Hosts
- Consider adopting a Limited policy to align with the 34.6% market standard in Corinth.
- Regularly review your cancellation policy against competitors and market demand shifts in Corinth.
Corinth STR Booking Lead Time Analysis (2026)
Average Booking Lead Time by Month
Booking Lead Time Insights for Corinth
- The overall average booking lead time for vacation rentals in Corinth is 43 days.
- Guests book furthest in advance for stays during November (average 119 days), likely coinciding with peak travel demand or local events.
- The shortest booking windows occur for stays in March (average 26 days), indicating more last-minute travel plans during this time.
- Seasonally, Fall (78 days avg.) sees the longest lead times, while Spring (45 days avg.) has the shortest, reflecting typical travel planning cycles.
Recommendations for Hosts
- Use the overall average lead time (43 days) as a baseline for your pricing and availability strategy in Corinth.
- For November stays, consider implementing length-of-stay discounts or slightly higher rates for bookings made less than 119 days out to capitalize on advance planning.
- Target marketing efforts for the Fall season well in advance (at least 78 days) to capture early planners.
- Monitor your own booking lead times against these Corinth averages to identify opportunities for dynamic pricing adjustments.
Popular & Essential Airbnb Amenities in Corinth (2026)
Amenity Prevalence
Amenity Insights for Corinth
- Essential amenities in Corinth that guests expect include: Free parking on premises, Hot water, Cooking basics, Smoke alarm, Fire extinguisher, Carbon monoxide alarm, Heating. Lacking these (any) could significantly impact bookings.
- Popular amenities like Coffee maker, Backyard, Bed linens are common but not universal. Offering these can provide a competitive edge.
Recommendations for Hosts
- Ensure your listing includes all essential amenities for Corinth: Free parking on premises, Hot water, Cooking basics, Smoke alarm, Fire extinguisher, Carbon monoxide alarm, Heating.
- Prioritize adding missing essentials: Hot water, Cooking basics, Smoke alarm, Fire extinguisher, Carbon monoxide alarm, Heating.
- Consider adding popular differentiators like Coffee maker or Backyard to increase appeal.
- Highlight unique or less common amenities you offer (e.g., hot tub, dedicated workspace, EV charger) in your listing description and photos.
- Regularly check competitor amenities in Corinth to stay competitive.
Corinth Airbnb Guest Demographics & Profile Analysis (2026)
Guest Profile Summary for Corinth
- The typical guest profile for Airbnb in Corinth consists of primarily domestic travelers (95%), often arriving from nearby New York, typically belonging to the Post-2000s (Gen Z/Alpha) group (50%), primarily speaking English or Spanish.
- Domestic travelers account for 95.2% of guests.
- Key international markets include United States (95.2%) and Canada (2.1%).
- Top languages spoken are English (60.9%) followed by Spanish (10.3%).
- A significant demographic segment is the Post-2000s (Gen Z/Alpha) group, representing 50% of guests.
Recommendations for Hosts
- Target domestic marketing efforts towards travelers from New York and Boston.
- Tailor amenities and listing descriptions to appeal to the dominant Post-2000s (Gen Z/Alpha) demographic (e.g., highlight fast WiFi, smart home features, local guides).
- Highlight unique local experiences or amenities relevant to the primary guest profile.
- Consider seasonal promotions aligned with peak travel times for key origin markets.
Nearby Short-Term Rental Market Comparison
How does the Corinth Airbnb market stack up against its neighbors? Compare key performance metrics like average monthly revenue, ADR, and occupancy rates in surrounding areas to understand the broader regional STR landscape.
| Market | Active Properties | Monthly Revenue | Daily Rate | Avg. Occupancy |
|---|---|---|---|---|
| Middletown Springs | 13 | $6,843 | $507.55 | 32% |
| Pomfret | 15 | $6,549 | $502.74 | 45% |
| Fort Ann | 35 | $6,238 | $790.41 | 37% |
| Hanover | 33 | $5,826 | $1189.51 | 41% |
| Barnstead | 36 | $5,090 | $477.12 | 42% |
| Goffstown | 13 | $5,066 | $343.72 | 53% |
| Malletts Bay | 51 | $4,842 | $444.86 | 41% |
| Town of Wilton | 103 | $4,841 | $862.83 | 38% |
| Jefferson | 28 | $4,793 | $474.72 | 40% |
| Wilmot | 11 | $4,667 | $334.67 | 51% |