Cavendish Airbnb Market Analysis 2026: Short Term Rental Data & Vacation Rental Statistics in Vermont, United States
Is Airbnb profitable in Cavendish in 2026? Explore comprehensive Airbnb analytics for Cavendish, Vermont, United States to uncover income potential. This 2026 STR market report for Cavendish, based on AirROI data from February 2025 to January 2026, reveals key trends in the niche market of 102 active listings.
Whether you're considering an Airbnb investment in Cavendish, optimizing your existing vacation rental, or exploring rental arbitrage opportunities, understanding the Cavendish Airbnb data is crucial. Leveraging the low regulation environment is key to maximizing your short term rental income potential. Let's dive into the specifics.
Key Cavendish Airbnb Performance Metrics Overview
Monthly Airbnb Revenue Variations & Income Potential in Cavendish (2026)
Understanding the monthly revenue variations for Airbnb listings in Cavendish is key to maximizing your short term rental income potential. Seasonality significantly impacts earnings. Our analysis, based on data from the past 12 months, shows that the peak revenue month for STRs in Cavendish is typically February, while May often presents the lowest earnings, highlighting opportunities for strategic pricing adjustments during shoulder and low seasons. Explore the typical Airbnb income in Cavendish across different performance tiers:
- Best-in-class properties (Top 10%) achieve $6,852+ monthly, often utilizing dynamic pricing and superior guest experiences.
- Strong performing properties (Top 25%) earn $4,285 or more, indicating effective management and desirable locations/amenities.
- Typical properties (Median) generate around $2,211 per month, representing the average market performance.
- Entry-level properties (Bottom 25%) see earnings around $1,034, often with potential for optimization.
Average Monthly Airbnb Earnings Trend in Cavendish
Cavendish Airbnb Occupancy Rate Trends (2026)
Maximize your bookings by understanding the Cavendish STR occupancy trends. Seasonal demand shifts significantly influence how often properties are booked. Typically, Februarysees the highest demand (peak season occupancy), while June experiences the lowest (low season). Effective strategies, like adjusting minimum stays or offering promotions, can boost occupancy during slower periods. Here's how different property tiers perform in Cavendish:
- Best-in-class properties (Top 10%) achieve 64%+ occupancy, indicating high desirability and potentially optimized availability.
- Strong performing properties (Top 25%) maintain 43% or higher occupancy, suggesting good market fit and guest satisfaction.
- Typical properties (Median) have an occupancy rate around 25%.
- Entry-level properties (Bottom 25%) average 13% occupancy, potentially facing higher vacancy.
Average Monthly Occupancy Rate Trend in Cavendish
Average Daily Rate (ADR) Airbnb Trends in Cavendish (2026)
Effective short term rental pricing strategy in Cavendish involves understanding monthly ADR fluctuations. The Average Daily Rate (ADR) for Airbnb in Cavendish typically peaks in December and dips lowest during April. Leveraging Airbnb dynamic pricing tools or strategies based on this seasonality can significantly boost revenue. Here's a look at the typical nightly rates achieved:
- Best-in-class properties (Top 10%) command rates of $540+ per night, often due to premium features or locations.
- Strong performing properties (Top 25%) achieve nightly rates of $411 or more.
- Typical properties (Median) charge around $287 per night.
- Entry-level properties (Bottom 25%) earn around $206 per night.
Average Daily Rate (ADR) Trend by Month in Cavendish
Get Live Cavendish Market Intelligence 👇

Explore Real-time Analytics
Airbnb Seasonality Analysis & Trends in Cavendish (2026)
Peak Season (February, January, December)
- Revenue averages $4,415 per month
- Occupancy rates average 34.8%
- Daily rates average $379
Shoulder Season
- Revenue averages $2,907 per month
- Occupancy maintains around 30.2%
- Daily rates hold near $315
Low Season (April, May, September)
- Revenue drops to average $2,042 per month
- Occupancy decreases to average 25.6%
- Daily rates adjust to average $296
Seasonality Insights for Cavendish
- The Airbnb seasonality in Cavendish shows highly seasonal trends requiring careful strategy. While the sections above show seasonal averages, it's also insightful to look at the extremes:
- During the high season, the absolute peak month showcases Cavendish's highest earning potential, with monthly revenues capable of climbing to $5,298, occupancy reaching a high of 46.6%, and ADRs peaking at $393.
- Conversely, the slowest single month of the year, typically falling within the low season, marks the market's lowest point. In this month, revenue might dip to $1,951, occupancy could drop to 24.4%, and ADRs may adjust down to $286.
- Understanding both the seasonal averages and these monthly peaks and troughs in revenue, occupancy, and ADR is crucial for maximizing your Airbnb profit potential in Cavendish.
Seasonal Strategies for Maximizing Profit
- Peak Season: Maximize revenue through premium pricing and potentially longer minimum stays. Ensure high availability.
- Low Season: Offer competitive pricing, special promotions (e.g., extended stay discounts), and flexible cancellation policies. Target off-season travelers like remote workers or budget-conscious guests.
- Shoulder Seasons: Implement dynamic pricing that balances peak and low rates. Target weekend travelers or specific events. Offer slightly more flexible terms than peak season.
- Regularly analyze your own performance against these Cavendish seasonality benchmarks and adjust your pricing and availability strategy accordingly.
Best Areas for Airbnb Investment in Cavendish (2026)
Exploring the top neighborhoods for short-term rentals in Cavendish? This section highlights key areas, outlining why they are attractive for hosts and guests, along with notable local attractions. Consider these locations based on your target guest profile and investment strategy.
| Neighborhood / Area | Why Host Here? (Target Guests & Appeal) | Key Attractions & Landmarks |
|---|---|---|
| Cavendish Village | A charming small village that offers a quintessential New England experience with easy access to local attractions and outdoor activities. It is popular among families and travelers looking for a peaceful getaway. | Cavendish Historical Society, Coolidge State Park, Okemo Mountain Resort, Lake Echo, Cavendish Green, Cavendish Farmer's Market |
| Ludlow | Just a short drive from Cavendish, Ludlow is better known for its ski resorts and vibrant community. It attracts winter sports enthusiasts and summer outdoor activity lovers alike. | Okemo Mountain Resort, Village of Ludlow, Ludlow Beach, Dodge Pond, Ludlow Town Hall, Golf at Okemo |
| Proctorsville | A quaint neighborhood that offers local charm and a close-knit community feel. It’s ideal for visitors seeking a tranquil escape with nearby attractions. | Proctorsville Green, Ascutney State Park, Local Art Galleries, Historic buildings, Proctorsville Bookstore, Farmers Market |
| Mount Holly | This scenic area offers beautiful landscapes and outdoor recreational opportunities, making it a favorite for nature lovers and outdoor enthusiasts. | Star Lake, Green Mountain National Forest, Snowmobile Trails, Hiking Trails, Mount Holly Ski Area, Local Wildlife Observations |
| Plymouth | Home to the Calvin Coolidge historic site, Plymouth is rich in history and natural beauty, attracting both history buffs and outdoor adventurers. | Calvin Coolidge Homestead, Plymouth Notch, Plymouth State Park, Scenic Hiking Trails, Local Wildlife, Historic Architecture |
| Ludlow Lakes | A picturesque area surrounding multiple lakes, perfect for fishing, kayaking, and enjoying the outdoors, popular among families and outdoor activity aficionados. | Ludlow Lakes, Fishing Spots, Scenic Hiking Trails, Kayaking, George's Pond, Wildlife watching |
| Chester | Nearby Chester offers a vibrant downtown with charming shops and restaurants and access to beautiful nature, making it a nice spot for visitors to explore. | Chester Village, Chester Snow Skate, MacLeish Field, Historic Chester Depot, Scenic Rail Trail, Outdoor Art Installations |
| Springfield | A larger town nearby that offers more amenities and services, Springfield is a great base for exploring the surrounding area while providing various daily conveniences. | Springfield Town Forest, Harley Hollow, Local Shops and Restaurants, Museum of the Vermont House, Springfield History Museum, Connecticut River Boat Launch |
Understanding Airbnb License Requirements & STR Laws in Cavendish (2026)
While Cavendish, Vermont, United States currently shows low STR regulations, specific Airbnb license requirements might still exist or change. Always verify the latest short term rental regulations and Airbnb license requirements directly with local government authorities for Cavendish to ensure full compliance before hosting.
(Source: AirROI data, 2026, based on 5% licensed listings)
Top Performing Airbnb Properties in Cavendish (2026)
Benchmark your potential! Explore examples of top-performing Airbnb properties in Cavendishbased on Trailing Twelve Month (TTM) revenue. Analyze their characteristics, revenue, occupancy rate, and ADR to understand what drives success in this market.
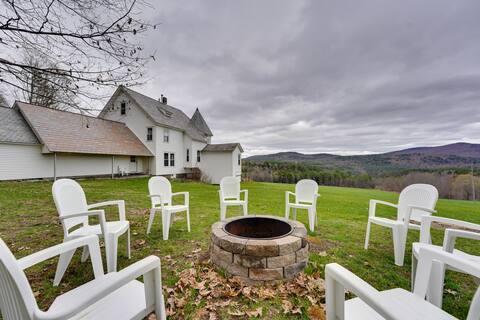
17-Acre Vermont Escape w/ Panoramic Mountain Views
Entire Place • 6 bedrooms
Cozy Ski-House by Okemo Hot Tub & Mountain Privacy
Entire Place • 5 bedrooms

Cozy Main Street Home. 9 min to Okemo. Large Yard.
Entire Place • 4 bedrooms
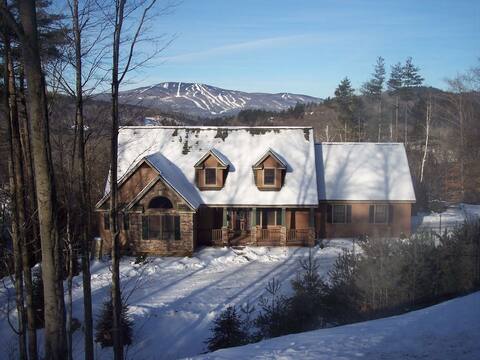
Okemo Mountain- Incredible view of the slopes!
Entire Place • 5 bedrooms

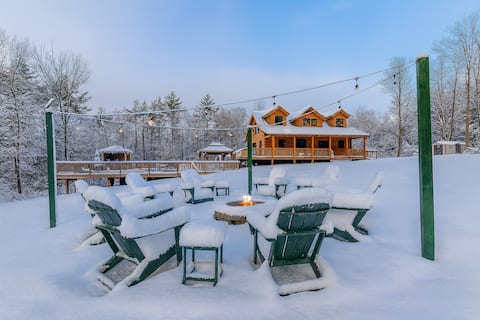
Okemo <12 min Game room~Hot tub~Fire pit~Mtn Views
Entire Place • 4 bedrooms
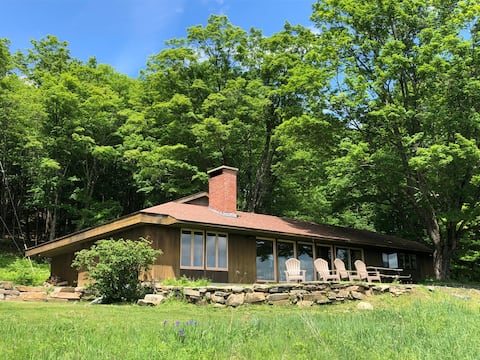
Midcentury Hillside Retreat - Summer Paradise
Entire Place • 3 bedrooms
Note: Performance varies based on location, size, amenities, seasonality, and management quality. Data reflects the past 12 months.
Top Performing Airbnb Hosts in Cavendish (2026)
Learn from the best! This table showcases top-performing Airbnb hosts in Cavendish based on the number of properties managed and estimated total revenue over the past year. Analyze their scale and performance metrics.
| Host Name | Properties | Grossing Revenue | Stay Reviews | Avg Rating |
|---|---|---|---|---|
| Evolve | 3 | $199,746 | 63 | 4.90/5.0 |
| Wendi | 3 | $170,242 | 256 | 4.92/5.0 |
| Andy | 9 | $156,114 | 439 | 4.91/5.0 |
| Madeline | 1 | $127,962 | 56 | 4.79/5.0 |
| Sarah | 3 | $107,734 | 247 | 4.97/5.0 |
| Allen | 2 | $91,486 | 101 | 4.96/5.0 |
| Bill & Lisa | 1 | $72,630 | 20 | 4.95/5.0 |
| Julie | 1 | $70,899 | 57 | 4.98/5.0 |
| Julia | 1 | $66,875 | 128 | 5.00/5.0 |
| Luke | 1 | $64,508 | 112 | 4.96/5.0 |
Analyzing the strategies of top hosts, such as their property selection, pricing, and guest communication, can offer valuable lessons for optimizing your own Airbnb operations in Cavendish.
Dive Deeper: Advanced Cavendish STR Market Data (2026)
Ready to unlock more insights? AirROI provides access to advanced metrics and comprehensive Airbnb data for Cavendish. Explore detailed analytics beyond this report to refine your investment strategy, optimize pricing, and maximize your vacation rental profits.
Explore Advanced MetricsCavendish Short-Term Rental Market Composition (2026): Property & Room Types
Room Type Distribution
Property Type Distribution
Market Composition Insights for Cavendish
- The Cavendish Airbnb market composition is heavily skewed towards Entire Home/Apt listings, which make up 86.3% of the 102 active rentals. This indicates strong guest preference for privacy and space.
- Looking at the property type distribution in Cavendish, House properties are the most common (51%), reflecting the local real estate landscape.
- Houses represent a significant 51% portion, catering likely to families or larger groups.
- The presence of 14.7% Hotel/Boutique listings indicates integration with traditional hospitality.
- Smaller segments like others (combined 2.0%) offer potential for unique stay experiences.
Cavendish Airbnb Room Capacity Analysis (2026): Bedroom Distribution
Distribution of Listings by Number of Bedrooms
Room Capacity Insights for Cavendish
- The dominant room capacity in Cavendish is 3 bedrooms listings, making up 26.5% of the market. This suggests a strong demand for properties suitable for families or small groups.
- Together, 3 bedrooms and 1 bedroom properties represent 45.1% of the active Airbnb listings in Cavendish, indicating a high concentration in these sizes.
- A significant 53.0% of listings offer 3+ bedrooms, catering to larger groups and families seeking more space in Cavendish.
Cavendish Vacation Rental Guest Capacity Trends (2026)
Distribution of Listings by Guest Capacity
Guest Capacity Insights for Cavendish
- The most common guest capacity trend in Cavendish vacation rentals is listings accommodating 8+ guests (43.1%). This suggests the primary traveler segment is likely larger groups.
- Properties designed for 8+ guests and 4 guests dominate the Cavendish STR market, accounting for 57.8% of listings.
- 60.7% of properties accommodate 6+ guests, serving the market segment for larger families or group travel in Cavendish.
- On average, properties in Cavendish are equipped to host 5.6 guests.
Cavendish Airbnb Booking Patterns (2026): Available vs. Booked Days
Available Days Distribution
Booked Days Distribution
Booking Pattern Insights for Cavendish
- The most common availability pattern in Cavendish falls within the 271-366 days range, representing 75.5% of listings. This suggests many properties have significant open periods on their calendars.
- Approximately 96.1% of listings show high availability (181+ days open annually), indicating potential for increased bookings or specific owner usage patterns.
- For booked days, the 31-90 days range is most frequent in Cavendish (42.2%), reflecting common guest stay durations or potential owner blocking patterns.
- A notable 4.9% of properties secure long booking periods (181+ days booked per year), highlighting successful long-term rental strategies or significant owner usage.
Cavendish Airbnb Minimum Stay Requirements Analysis
Distribution of Listings by Minimum Night Requirement
1 Night
19 listings
18.6% of total
2 Nights
44 listings
43.1% of total
3 Nights
5 listings
4.9% of total
4-6 Nights
3 listings
2.9% of total
30+ Nights
31 listings
30.4% of total
Key Insights
- The most prevalent minimum stay requirement in Cavendish is 2 Nights, adopted by 43.1% of listings. This highlights the market's preference for shorter, flexible bookings.
- A strong majority (61.7%) of the Cavendish Airbnb data shows acceptance of very short stays (1-2 nights), indicating a dynamic, high-turnover market.
- A significant segment (30.4%) caters to monthly stays (30+ nights) in Cavendish, pointing to opportunities in the extended-stay market.
Recommendations
- Align with the market by considering a 2 Nights minimum stay, as 43.1% of Cavendish hosts use this setting.
- If feasible, allowing 1-night stays, especially midweek or during low season, could capture last-minute bookings, as only 18.6% currently do.
- A 2-night minimum appears standard (43.1%). Consider this for weekends or peak periods.
- Explore offering discounts for stays of 30+ nights to attract the 30.4% of the market seeking extended stays.
- Adjust minimum nights based on seasonality – potentially shorter during low season and longer during peak demand periods in Cavendish.
Cavendish Airbnb Cancellation Policy Trends Analysis (2026)
Super Strict 30 Days
7 listings
6.9% of total
Super Strict 60 Days
1 listings
1% of total
Flexible
8 listings
7.8% of total
Moderate
13 listings
12.7% of total
Firm
57 listings
55.9% of total
Strict
16 listings
15.7% of total
Cancellation Policy Insights for Cavendish
- The prevailing Airbnb cancellation policy trend in Cavendish is Firm, used by 55.9% of listings.
- A majority (71.6%) of hosts in Cavendish utilize Firm or Strict policies, indicating a market where hosts prioritize booking security.
Recommendations for Hosts
- Consider adopting a Firm policy to align with the 55.9% market standard in Cavendish.
- Regularly review your cancellation policy against competitors and market demand shifts in Cavendish.
Cavendish STR Booking Lead Time Analysis (2026)
Average Booking Lead Time by Month
Booking Lead Time Insights for Cavendish
- The overall average booking lead time for vacation rentals in Cavendish is 50 days.
- Guests book furthest in advance for stays during October (average 64 days), likely coinciding with peak travel demand or local events.
- The shortest booking windows occur for stays in May (average 31 days), indicating more last-minute travel plans during this time.
- Seasonally, Fall (56 days avg.) sees the longest lead times, while Spring (37 days avg.) has the shortest, reflecting typical travel planning cycles.
Recommendations for Hosts
- Use the overall average lead time (50 days) as a baseline for your pricing and availability strategy in Cavendish.
- For October stays, consider implementing length-of-stay discounts or slightly higher rates for bookings made less than 64 days out to capitalize on advance planning.
- Target marketing efforts for the Fall season well in advance (at least 56 days) to capture early planners.
- Monitor your own booking lead times against these Cavendish averages to identify opportunities for dynamic pricing adjustments.
Popular & Essential Airbnb Amenities in Cavendish (2026)
Amenity Prevalence
Amenity Insights for Cavendish
- Essential amenities in Cavendish that guests expect include: Wifi, Heating, Free parking on premises, TV, Carbon monoxide alarm. Lacking these (any) could significantly impact bookings.
- Popular amenities like Smoke alarm, Essentials, Fire extinguisher are common but not universal. Offering these can provide a competitive edge.
Recommendations for Hosts
- Ensure your listing includes all essential amenities for Cavendish: Wifi, Heating, Free parking on premises, TV, Carbon monoxide alarm.
- Prioritize adding missing essentials: Wifi, Heating, Free parking on premises, TV, Carbon monoxide alarm.
- Consider adding popular differentiators like Smoke alarm or Essentials to increase appeal.
- Highlight unique or less common amenities you offer (e.g., hot tub, dedicated workspace, EV charger) in your listing description and photos.
- Regularly check competitor amenities in Cavendish to stay competitive.
Cavendish Airbnb Guest Demographics & Profile Analysis (2026)
Guest Profile Summary for Cavendish
- The typical guest profile for Airbnb in Cavendish consists of primarily domestic travelers (95%), often arriving from nearby New York, typically belonging to the Post-2000s (Gen Z/Alpha) group (50%), primarily speaking English or Spanish.
- Domestic travelers account for 94.7% of guests.
- Key international markets include United States (94.7%) and Canada (1.4%).
- Top languages spoken are English (66.4%) followed by Spanish (12.1%).
- A significant demographic segment is the Post-2000s (Gen Z/Alpha) group, representing 50% of guests.
Recommendations for Hosts
- Target domestic marketing efforts towards travelers from New York and Boston.
- Tailor amenities and listing descriptions to appeal to the dominant Post-2000s (Gen Z/Alpha) demographic (e.g., highlight fast WiFi, smart home features, local guides).
- Highlight unique local experiences or amenities relevant to the primary guest profile.
- Consider seasonal promotions aligned with peak travel times for key origin markets.
Nearby Short-Term Rental Market Comparison
How does the Cavendish Airbnb market stack up against its neighbors? Compare key performance metrics like average monthly revenue, ADR, and occupancy rates in surrounding areas to understand the broader regional STR landscape.
| Market | Active Properties | Monthly Revenue | Daily Rate | Avg. Occupancy |
|---|---|---|---|---|
| Middletown Springs | 13 | $6,843 | $507.55 | 32% |
| Pomfret | 15 | $6,549 | $502.74 | 45% |
| Fort Ann | 35 | $6,238 | $790.41 | 37% |
| Hanover | 33 | $5,826 | $1189.51 | 41% |
| North Andover | 12 | $5,625 | $440.84 | 45% |
| Town of Ancram | 22 | $5,616 | $512.55 | 38% |
| Wellesley | 22 | $5,310 | $520.90 | 50% |
| Town of Schodack | 11 | $5,158 | $555.89 | 29% |
| Town of Stillwater | 55 | $5,153 | $564.54 | 42% |
| Barnstead | 36 | $5,090 | $477.12 | 42% |