Burlington Airbnb Market Analysis 2026: Short Term Rental Data & Vacation Rental Statistics in Vermont, United States
Is Airbnb profitable in Burlington in 2026? Explore comprehensive Airbnb analytics for Burlington, Vermont, United States to uncover income potential. This 2026 STR market report for Burlington, based on AirROI data from February 2025 to January 2026, reveals key trends in the market of 331 active listings.
Whether you're considering an Airbnb investment in Burlington, optimizing your existing vacation rental, or exploring rental arbitrage opportunities, understanding the Burlington Airbnb data is crucial. Understanding the local regulations is key to maximizing your short term rental income potential. Let's dive into the specifics.
Key Burlington Airbnb Performance Metrics Overview
Monthly Airbnb Revenue Variations & Income Potential in Burlington (2026)
Understanding the monthly revenue variations for Airbnb listings in Burlington is key to maximizing your short term rental income potential. Seasonality significantly impacts earnings. Our analysis, based on data from the past 12 months, shows that the peak revenue month for STRs in Burlington is typically August, while January often presents the lowest earnings, highlighting opportunities for strategic pricing adjustments during shoulder and low seasons. Explore the typical Airbnb income in Burlington across different performance tiers:
- Best-in-class properties (Top 10%) achieve $8,009+ monthly, often utilizing dynamic pricing and superior guest experiences.
- Strong performing properties (Top 25%) earn $5,300 or more, indicating effective management and desirable locations/amenities.
- Typical properties (Median) generate around $3,364 per month, representing the average market performance.
- Entry-level properties (Bottom 25%) see earnings around $1,896, often with potential for optimization.
Average Monthly Airbnb Earnings Trend in Burlington
Burlington Airbnb Occupancy Rate Trends (2026)
Maximize your bookings by understanding the Burlington STR occupancy trends. Seasonal demand shifts significantly influence how often properties are booked. Typically, Augustsees the highest demand (peak season occupancy), while January experiences the lowest (low season). Effective strategies, like adjusting minimum stays or offering promotions, can boost occupancy during slower periods. Here's how different property tiers perform in Burlington:
- Best-in-class properties (Top 10%) achieve 85%+ occupancy, indicating high desirability and potentially optimized availability.
- Strong performing properties (Top 25%) maintain 71% or higher occupancy, suggesting good market fit and guest satisfaction.
- Typical properties (Median) have an occupancy rate around 52%.
- Entry-level properties (Bottom 25%) average 32% occupancy, potentially facing higher vacancy.
Average Monthly Occupancy Rate Trend in Burlington
Average Daily Rate (ADR) Airbnb Trends in Burlington (2026)
Effective short term rental pricing strategy in Burlington involves understanding monthly ADR fluctuations. The Average Daily Rate (ADR) for Airbnb in Burlington typically peaks in October and dips lowest during March. Leveraging Airbnb dynamic pricing tools or strategies based on this seasonality can significantly boost revenue. Here's a look at the typical nightly rates achieved:
- Best-in-class properties (Top 10%) command rates of $524+ per night, often due to premium features or locations.
- Strong performing properties (Top 25%) achieve nightly rates of $325 or more.
- Typical properties (Median) charge around $213 per night.
- Entry-level properties (Bottom 25%) earn around $139 per night.
Average Daily Rate (ADR) Trend by Month in Burlington
Get Live Burlington Market Intelligence 👇

Explore Real-time Analytics
Airbnb Seasonality Analysis & Trends in Burlington (2026)
Peak Season (August, October, July)
- Revenue averages $6,132 per month
- Occupancy rates average 66.5%
- Daily rates average $290
Shoulder Season
- Revenue averages $3,895 per month
- Occupancy maintains around 48.6%
- Daily rates hold near $272
Low Season (January, February, March)
- Revenue drops to average $2,606 per month
- Occupancy decreases to average 42.0%
- Daily rates adjust to average $250
Seasonality Insights for Burlington
- The Airbnb seasonality in Burlington shows highly seasonal trends requiring careful strategy. While the sections above show seasonal averages, it's also insightful to look at the extremes:
- During the high season, the absolute peak month showcases Burlington's highest earning potential, with monthly revenues capable of climbing to $6,474, occupancy reaching a high of 69.4%, and ADRs peaking at $292.
- Conversely, the slowest single month of the year, typically falling within the low season, marks the market's lowest point. In this month, revenue might dip to $2,378, occupancy could drop to 33.7%, and ADRs may adjust down to $245.
- Understanding both the seasonal averages and these monthly peaks and troughs in revenue, occupancy, and ADR is crucial for maximizing your Airbnb profit potential in Burlington.
Seasonal Strategies for Maximizing Profit
- Peak Season: Maximize revenue through premium pricing and potentially longer minimum stays. Ensure high availability.
- Low Season: Offer competitive pricing, special promotions (e.g., extended stay discounts), and flexible cancellation policies. Target off-season travelers like remote workers or budget-conscious guests.
- Shoulder Seasons: Implement dynamic pricing that balances peak and low rates. Target weekend travelers or specific events. Offer slightly more flexible terms than peak season.
- Regularly analyze your own performance against these Burlington seasonality benchmarks and adjust your pricing and availability strategy accordingly.
Best Areas for Airbnb Investment in Burlington (2026)
Exploring the top neighborhoods for short-term rentals in Burlington? This section highlights key areas, outlining why they are attractive for hosts and guests, along with notable local attractions. Consider these locations based on your target guest profile and investment strategy.
| Neighborhood / Area | Why Host Here? (Target Guests & Appeal) | Key Attractions & Landmarks |
|---|---|---|
| Downtown Burlington | The vibrant heart of Burlington, known for its waterfront access, shopping, dining, and cultural events. Ideal for tourists looking to explore the city’s attractions and enjoy local festivals. | Church Street Marketplace, Burlington Waterfront Park, ECHO Leahy Center for Lake Champlain, Frog Hollow Vermont State Craft Center, Burlington Beer Company |
| South End | An up-and-coming neighborhood with a mix of art studios, breweries, and local shops. Popular among younger crowds and those looking for a trendy atmosphere with a community feel. | Burlington Arts District, Zero Gravity Craft Brewery, The Farmhouse Tap & Grill, The Daily Planet, Arts Riot |
| University of Vermont Area | Home to the University of Vermont, this area attracts students, families, and visitors to campus events. It has a youthful vibe and plenty of amenities close by. | University of Vermont, Burlington City Arts, The Champlain College, Gardens at the Intervale, Burlington Farmers Market |
| Colchester | Located just north of Burlington, Colchester offers a quieter suburban experience while still being close to the city. Great for families and those looking for a peaceful retreat. | Colchester Causeway, Airport Park, Malletts Bay, Bolton Valley Ski Area, Niquette Bay State Park |
| Winooski | A small city just next to Burlington, known for its multicultural vibe and historic mills. Winooski has become a hot spot for foodies and urban dwellers. | Winooski Falls, The Onion River, Riverwalk Trail, Winooski Farmers Market, Local eateries and breweries |
| Shelburne | Beautifully situated near the lake, Shelburne offers a scenic residential area with attractions like the Shelburne Museum. Ideal for guests looking for a blend of nature and culture. | Shelburne Museum, Shelburne Farms, Lake Champlain Chocolate, The Vermont Teddy Bear Company, Shelburne Vineyards |
| North End | A family-friendly neighborhood known for its parks and local community vibes. Popular with those who enjoy outdoor activities and family-focused amenities. | Leddy Park, North Beach Park, Oakledge Park, Intervale Center, Burlington Bike Path |
| Huntington | A bit farther from Burlington, Huntington offers beautiful nature and hiking opportunities. Perfect for guests seeking a true Vermont experience and outdoor adventure. | Camel's Hump State Park, Huntington River, Burlington Area Trails, Local hiking paths, Scenic landscapes |
Understanding Airbnb License Requirements & STR Laws in Burlington (2026)
With 20% of listings showing registration in 2026, understanding potential Airbnb license requirements is crucial in Burlington. Always verify the latest short term rental regulations and Airbnb license requirements directly with local government authorities for Burlington to ensure full compliance before hosting.
(Source: AirROI data, 2026, based on 20% licensed listings)
Top Performing Airbnb Properties in Burlington (2026)
Benchmark your potential! Explore examples of top-performing Airbnb properties in Burlingtonbased on Trailing Twelve Month (TTM) revenue. Analyze their characteristics, revenue, occupancy rate, and ADR to understand what drives success in this market.

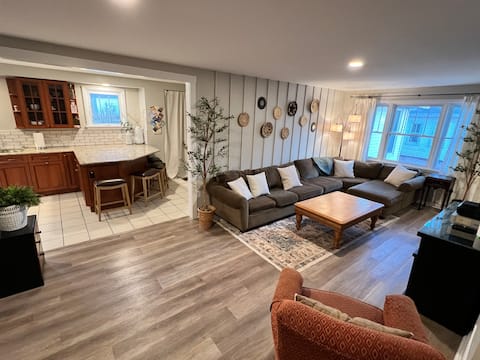
Charming Bungalow + 3 Cottages Near Park & Beaches
Entire Place • 2 bedrooms

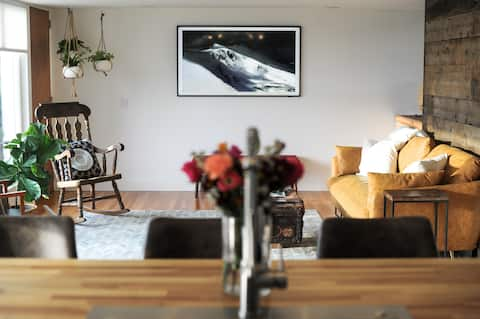
Funky downtown house in South End arts district !
Entire Place • 3 bedrooms

NEW! Cozy Family Home in Downtown Burlington
Entire Place • 5 bedrooms
Spacious 6+ bdr 2 ba, walk to breweries & downtown
Entire Place • 6 bedrooms
Déjà View: Beautiful Home with Views of the Lake
Entire Place • 4 bedrooms
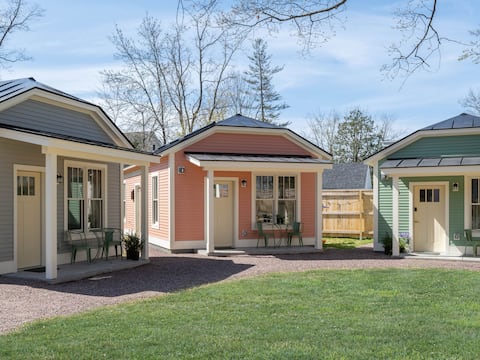
Group Getaway: 3 New Cottages
Entire Place • 3 bedrooms
Note: Performance varies based on location, size, amenities, seasonality, and management quality. Data reflects the past 12 months.
Top Performing Airbnb Hosts in Burlington (2026)
Learn from the best! This table showcases top-performing Airbnb hosts in Burlington based on the number of properties managed and estimated total revenue over the past year. Analyze their scale and performance metrics.
| Host Name | Properties | Grossing Revenue | Stay Reviews | Avg Rating |
|---|---|---|---|---|
| Rolf Sigurd | 9 | $1,015,702 | 2487 | 4.93/5.0 |
| Errin | 12 | $584,692 | 2834 | 4.80/5.0 |
| David | 5 | $339,573 | 486 | 5.00/5.0 |
| Dave | 7 | $338,463 | 1176 | 4.90/5.0 |
| Sam | 8 | $304,703 | 1585 | 4.82/5.0 |
| Sam | 1 | $207,112 | 478 | 4.88/5.0 |
| Brandon | 1 | $199,448 | 159 | 4.95/5.0 |
| Meghan | 2 | $187,136 | 510 | 4.93/5.0 |
| Abbott | 4 | $184,430 | 1007 | 4.97/5.0 |
| Gabriela | 5 | $182,954 | 318 | 4.93/5.0 |
Analyzing the strategies of top hosts, such as their property selection, pricing, and guest communication, can offer valuable lessons for optimizing your own Airbnb operations in Burlington.
Dive Deeper: Advanced Burlington STR Market Data (2026)
Ready to unlock more insights? AirROI provides access to advanced metrics and comprehensive Airbnb data for Burlington. Explore detailed analytics beyond this report to refine your investment strategy, optimize pricing, and maximize your vacation rental profits.
Explore Advanced MetricsBurlington Short-Term Rental Market Composition (2026): Property & Room Types
Room Type Distribution
Property Type Distribution
Market Composition Insights for Burlington
- The Burlington Airbnb market composition is heavily skewed towards Entire Home/Apt listings, which make up 82.2% of the 331 active rentals. This indicates strong guest preference for privacy and space.
- Looking at the property type distribution in Burlington, Apartment/Condo properties are the most common (50.5%), reflecting the local real estate landscape.
- Houses represent a significant 38.1% portion, catering likely to families or larger groups.
- The presence of 6% Hotel/Boutique listings indicates integration with traditional hospitality.
- Smaller segments like others, outdoor/unique, unique stays (combined 5.4%) offer potential for unique stay experiences.
Burlington Airbnb Room Capacity Analysis (2026): Bedroom Distribution
Distribution of Listings by Number of Bedrooms
Room Capacity Insights for Burlington
- The dominant room capacity in Burlington is 1 bedroom listings, making up 38.4% of the market. This suggests a strong demand for properties suitable for couples or solo travelers.
- Together, 1 bedroom and 2 bedrooms properties represent 62.3% of the active Airbnb listings in Burlington, indicating a high concentration in these sizes.
- A significant 21.7% of listings offer 3+ bedrooms, catering to larger groups and families seeking more space in Burlington.
Burlington Vacation Rental Guest Capacity Trends (2026)
Distribution of Listings by Guest Capacity
Guest Capacity Insights for Burlington
- The most common guest capacity trend in Burlington vacation rentals is listings accommodating 2 guests (27.8%). This suggests the primary traveler segment is likely couples or solo travelers.
- Properties designed for 2 guests and 4 guests dominate the Burlington STR market, accounting for 52.3% of listings.
- 23.0% of properties accommodate 6+ guests, serving the market segment for larger families or group travel in Burlington.
- On average, properties in Burlington are equipped to host 3.6 guests.
Burlington Airbnb Booking Patterns (2026): Available vs. Booked Days
Available Days Distribution
Booked Days Distribution
Booking Pattern Insights for Burlington
- The most common availability pattern in Burlington falls within the 181-270 days range, representing 37.2% of listings. This suggests many properties have significant open periods on their calendars.
- Approximately 59.3% of listings show high availability (181+ days open annually), indicating potential for increased bookings or specific owner usage patterns.
- For booked days, the 91-180 days range is most frequent in Burlington (35.6%), reflecting common guest stay durations or potential owner blocking patterns.
- A notable 42.6% of properties secure long booking periods (181+ days booked per year), highlighting successful long-term rental strategies or significant owner usage.
Burlington Airbnb Minimum Stay Requirements Analysis
Distribution of Listings by Minimum Night Requirement
1 Night
96 listings
29% of total
2 Nights
61 listings
18.4% of total
3 Nights
17 listings
5.1% of total
4-6 Nights
10 listings
3% of total
7-29 Nights
24 listings
7.3% of total
30+ Nights
123 listings
37.2% of total
Key Insights
- The most prevalent minimum stay requirement in Burlington is 30+ Nights, adopted by 37.2% of listings. This highlights the market's preference for longer commitments.
- A significant segment (37.2%) caters to monthly stays (30+ nights) in Burlington, pointing to opportunities in the extended-stay market.
Recommendations
- Align with the market by considering a 30+ Nights minimum stay, as 37.2% of Burlington hosts use this setting.
- If feasible, allowing 1-night stays, especially midweek or during low season, could capture last-minute bookings, as only 29% currently do.
- Explore offering discounts for stays of 30+ nights to attract the 37.2% of the market seeking extended stays.
- Adjust minimum nights based on seasonality – potentially shorter during low season and longer during peak demand periods in Burlington.
Burlington Airbnb Cancellation Policy Trends Analysis (2026)
Super Strict 60 Days
2 listings
0.6% of total
Super Strict 30 Days
1 listings
0.3% of total
Limited
7 listings
2.1% of total
Flexible
35 listings
10.6% of total
Moderate
112 listings
33.8% of total
Firm
121 listings
36.6% of total
Strict
53 listings
16% of total
Cancellation Policy Insights for Burlington
- The prevailing Airbnb cancellation policy trend in Burlington is Firm, used by 36.6% of listings.
- A majority (52.6%) of hosts in Burlington utilize Firm or Strict policies, indicating a market where hosts prioritize booking security.
Recommendations for Hosts
- Consider adopting a Firm policy to align with the 36.6% market standard in Burlington.
- Regularly review your cancellation policy against competitors and market demand shifts in Burlington.
Burlington STR Booking Lead Time Analysis (2026)
Average Booking Lead Time by Month
Booking Lead Time Insights for Burlington
- The overall average booking lead time for vacation rentals in Burlington is 52 days.
- Guests book furthest in advance for stays during May (average 85 days), likely coinciding with peak travel demand or local events.
- The shortest booking windows occur for stays in January (average 27 days), indicating more last-minute travel plans during this time.
- Seasonally, Summer (57 days avg.) sees the longest lead times, while Winter (30 days avg.) has the shortest, reflecting typical travel planning cycles.
Recommendations for Hosts
- Use the overall average lead time (52 days) as a baseline for your pricing and availability strategy in Burlington.
- For May stays, consider implementing length-of-stay discounts or slightly higher rates for bookings made less than 85 days out to capitalize on advance planning.
- Target marketing efforts for the Summer season well in advance (at least 57 days) to capture early planners.
- Monitor your own booking lead times against these Burlington averages to identify opportunities for dynamic pricing adjustments.
Popular & Essential Airbnb Amenities in Burlington (2026)
Amenity Prevalence
Amenity Insights for Burlington
- Essential amenities in Burlington that guests expect include: Smoke alarm, Wifi, Carbon monoxide alarm, Hot water, Heating. Lacking these (any) could significantly impact bookings.
- Popular amenities like Fire extinguisher, Free parking on premises, Coffee maker are common but not universal. Offering these can provide a competitive edge.
Recommendations for Hosts
- Ensure your listing includes all essential amenities for Burlington: Smoke alarm, Wifi, Carbon monoxide alarm, Hot water, Heating.
- Prioritize adding missing essentials: Smoke alarm, Wifi, Carbon monoxide alarm, Hot water, Heating.
- Consider adding popular differentiators like Fire extinguisher or Free parking on premises to increase appeal.
- Highlight unique or less common amenities you offer (e.g., hot tub, dedicated workspace, EV charger) in your listing description and photos.
- Regularly check competitor amenities in Burlington to stay competitive.
Burlington Airbnb Guest Demographics & Profile Analysis (2026)
Guest Profile Summary for Burlington
- The typical guest profile for Airbnb in Burlington consists of primarily domestic travelers (93%), often arriving from nearby New York, typically belonging to the Post-2000s (Gen Z/Alpha) group (50%), primarily speaking English or Spanish.
- Domestic travelers account for 92.8% of guests.
- Key international markets include United States (92.8%) and Canada (1.8%).
- Top languages spoken are English (66.1%) followed by Spanish (12%).
- A significant demographic segment is the Post-2000s (Gen Z/Alpha) group, representing 50% of guests.
Recommendations for Hosts
- Target domestic marketing efforts towards travelers from New York and Boston.
- Tailor amenities and listing descriptions to appeal to the dominant Post-2000s (Gen Z/Alpha) demographic (e.g., highlight fast WiFi, smart home features, local guides).
- Highlight unique local experiences or amenities relevant to the primary guest profile.
- Consider seasonal promotions aligned with peak travel times for key origin markets.
Nearby Short-Term Rental Market Comparison
How does the Burlington Airbnb market stack up against its neighbors? Compare key performance metrics like average monthly revenue, ADR, and occupancy rates in surrounding areas to understand the broader regional STR landscape.
| Market | Active Properties | Monthly Revenue | Daily Rate | Avg. Occupancy |
|---|---|---|---|---|
| Middletown Springs | 13 | $6,843 | $507.55 | 32% |
| Pomfret | 15 | $6,549 | $502.74 | 45% |
| Fort Ann | 35 | $6,238 | $790.41 | 37% |
| Hanover | 33 | $5,826 | $1189.51 | 41% |
| Mille-Isles | 89 | $5,219 | $472.25 | 38% |
| Malletts Bay | 51 | $4,842 | $444.86 | 41% |
| Town of Wilton | 103 | $4,841 | $862.83 | 38% |
| Town of Bolton | 140 | $4,533 | $693.78 | 37% |
| Putnam Station | 14 | $4,483 | $512.24 | 42% |
| Stowe | 875 | $4,424 | $529.19 | 38% |