Barnet Airbnb Market Analysis 2026: Short Term Rental Data & Vacation Rental Statistics in Vermont, United States
Is Airbnb profitable in Barnet in 2026? Explore comprehensive Airbnb analytics for Barnet, Vermont, United States to uncover income potential. This 2026 STR market report for Barnet, based on AirROI data from February 2025 to January 2026, reveals key trends in the niche market of 22 active listings.
Whether you're considering an Airbnb investment in Barnet, optimizing your existing vacation rental, or exploring rental arbitrage opportunities, understanding the Barnet Airbnb data is crucial. Leveraging the low regulation environment is key to maximizing your short term rental income potential. Let's dive into the specifics.
Key Barnet Airbnb Performance Metrics Overview
Monthly Airbnb Revenue Variations & Income Potential in Barnet (2026)
Understanding the monthly revenue variations for Airbnb listings in Barnet is key to maximizing your short term rental income potential. Seasonality significantly impacts earnings. Our analysis, based on data from the past 12 months, shows that the peak revenue month for STRs in Barnet is typically August, while March often presents the lowest earnings, highlighting opportunities for strategic pricing adjustments during shoulder and low seasons. Explore the typical Airbnb income in Barnet across different performance tiers:
- Best-in-class properties (Top 10%) achieve $5,817+ monthly, often utilizing dynamic pricing and superior guest experiences.
- Strong performing properties (Top 25%) earn $3,631 or more, indicating effective management and desirable locations/amenities.
- Typical properties (Median) generate around $1,770 per month, representing the average market performance.
- Entry-level properties (Bottom 25%) see earnings around $891, often with potential for optimization.
Average Monthly Airbnb Earnings Trend in Barnet
Barnet Airbnb Occupancy Rate Trends (2026)
Maximize your bookings by understanding the Barnet STR occupancy trends. Seasonal demand shifts significantly influence how often properties are booked. Typically, Octobersees the highest demand (peak season occupancy), while January experiences the lowest (low season). Effective strategies, like adjusting minimum stays or offering promotions, can boost occupancy during slower periods. Here's how different property tiers perform in Barnet:
- Best-in-class properties (Top 10%) achieve 63%+ occupancy, indicating high desirability and potentially optimized availability.
- Strong performing properties (Top 25%) maintain 51% or higher occupancy, suggesting good market fit and guest satisfaction.
- Typical properties (Median) have an occupancy rate around 33%.
- Entry-level properties (Bottom 25%) average 19% occupancy, potentially facing higher vacancy.
Average Monthly Occupancy Rate Trend in Barnet
Average Daily Rate (ADR) Airbnb Trends in Barnet (2026)
Effective short term rental pricing strategy in Barnet involves understanding monthly ADR fluctuations. The Average Daily Rate (ADR) for Airbnb in Barnet typically peaks in June and dips lowest during January. Leveraging Airbnb dynamic pricing tools or strategies based on this seasonality can significantly boost revenue. Here's a look at the typical nightly rates achieved:
- Best-in-class properties (Top 10%) command rates of $583+ per night, often due to premium features or locations.
- Strong performing properties (Top 25%) achieve nightly rates of $290 or more.
- Typical properties (Median) charge around $181 per night.
- Entry-level properties (Bottom 25%) earn around $127 per night.
Average Daily Rate (ADR) Trend by Month in Barnet
Get Live Barnet Market Intelligence 👇

Explore Real-time Analytics
Airbnb Seasonality Analysis & Trends in Barnet (2026)
Peak Season (August, October, July)
- Revenue averages $3,865 per month
- Occupancy rates average 47.8%
- Daily rates average $251
Shoulder Season
- Revenue averages $2,686 per month
- Occupancy maintains around 36.6%
- Daily rates hold near $241
Low Season (January, February, March)
- Revenue drops to average $1,579 per month
- Occupancy decreases to average 25.7%
- Daily rates adjust to average $240
Seasonality Insights for Barnet
- The Airbnb seasonality in Barnet shows highly seasonal trends requiring careful strategy. While the sections above show seasonal averages, it's also insightful to look at the extremes:
- During the high season, the absolute peak month showcases Barnet's highest earning potential, with monthly revenues capable of climbing to $3,988, occupancy reaching a high of 52.3%, and ADRs peaking at $259.
- Conversely, the slowest single month of the year, typically falling within the low season, marks the market's lowest point. In this month, revenue might dip to $1,415, occupancy could drop to 21.0%, and ADRs may adjust down to $223.
- Understanding both the seasonal averages and these monthly peaks and troughs in revenue, occupancy, and ADR is crucial for maximizing your Airbnb profit potential in Barnet.
Seasonal Strategies for Maximizing Profit
- Peak Season: Maximize revenue through premium pricing and potentially longer minimum stays. Ensure high availability.
- Low Season: Offer competitive pricing, special promotions (e.g., extended stay discounts), and flexible cancellation policies. Target off-season travelers like remote workers or budget-conscious guests.
- Shoulder Seasons: Implement dynamic pricing that balances peak and low rates. Target weekend travelers or specific events. Offer slightly more flexible terms than peak season.
- Regularly analyze your own performance against these Barnet seasonality benchmarks and adjust your pricing and availability strategy accordingly.
Best Areas for Airbnb Investment in Barnet (2026)
Exploring the top neighborhoods for short-term rentals in Barnet? This section highlights key areas, outlining why they are attractive for hosts and guests, along with notable local attractions. Consider these locations based on your target guest profile and investment strategy.
| Neighborhood / Area | Why Host Here? (Target Guests & Appeal) | Key Attractions & Landmarks |
|---|---|---|
| Stowe | Known as the ski capital of Vermont, Stowe attracts winter sports enthusiasts and summer visitors seeking outdoor activities. Its charming village and scenic views make it a popular destination year-round. | Stowe Mountain Resort, Ben & Jerry's Factory, Stowe Recreation Path, Smugglers' Notch State Park, Trapp Family Lodge |
| Woodstock | This picturesque town offers a quintessential New England experience with its charming village green and historical sites. It's a great spot for those seeking a peaceful retreat and access to nature. | Billings Farm & Museum, Woodstock Vermont History Center, Marsh-Billings-Rockefeller National Historical Park, Ottauquechee River, Woodstock Farmers Market |
| Manchester | A vibrant town known for its shopping outlets and beautiful mountain views. It's a popular stop for travelers exploring southern Vermont. | Hildene, The Lincoln Family Home, Southern Vermont Art Center, Manchester Designer Outlets, Equinox Preservation Trust, Lye Brook Falls |
| Grafton | A small, charming village that offers a quiet escape with beautiful landscapes and historical buildings. Grafton is perfect for those looking for a rural getaway. | Grafton Village Cheese, Grafton Nature Museum, The Village of Grafton, Grafton Trails & Outdoor Center, Pine Ridge Golf Club |
| Brattleboro | This lively town is known for its arts scene and cultural events, making it appealing to visitors looking for entertainment and local experiences. | Brattleboro Museum & Art Center, The Latchis Theatre, Wantastiquet Mountain, Holton Home, The Estey Organ Museum |
| Newport | Situated on the shores of Lake Memphremagog, Newport offers a mix of outdoor activities and small-town charm, ideal for visitors seeking water-based recreation and local events. | Lake Memphremagog, Newport Historic District, North Country Chamber of Commerce, Newport State Airport, Prouty Beach |
| Shelburne | A charming town just south of Burlington, Shelburne is known for its wineries and the Shelburne Museum, appealing to art and culture enthusiasts. | Shelburne Museum, Shelburne Vineyards, Shelburne Farms, Button Bay State Park, Lake Champlain |
| Quechee | Home to the spectacular Quechee Gorge, this area attracts outdoor lovers and those wanting a mix of natural beauty and local attractions. | Quechee Gorge, Quechee State Park, Vermont Institute of Natural Science, Simon Pearce glassblowing, Kelvin Smith's Restaurant |
Understanding Airbnb License Requirements & STR Laws in Barnet (2026)
While Barnet, Vermont, United States currently shows low STR regulations, specific Airbnb license requirements might still exist or change. Always verify the latest short term rental regulations and Airbnb license requirements directly with local government authorities for Barnet to ensure full compliance before hosting.
(Source: AirROI data, 2026, finding no licensed listings among those analyzed)
Top Performing Airbnb Properties in Barnet (2026)
Benchmark your potential! Explore examples of top-performing Airbnb properties in Barnetbased on Trailing Twelve Month (TTM) revenue. Analyze their characteristics, revenue, occupancy rate, and ADR to understand what drives success in this market.

The Stonehill lakeside cottage
Entire Place • 4 bedrooms
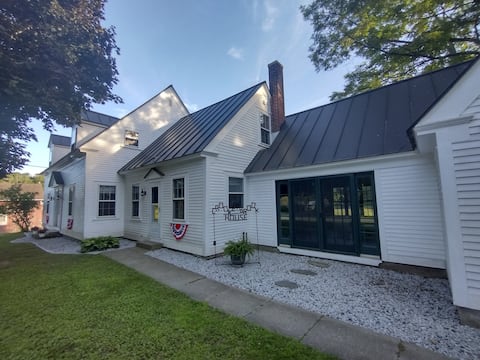
Crooked Brook House Vt
Entire Place • 4 bedrooms
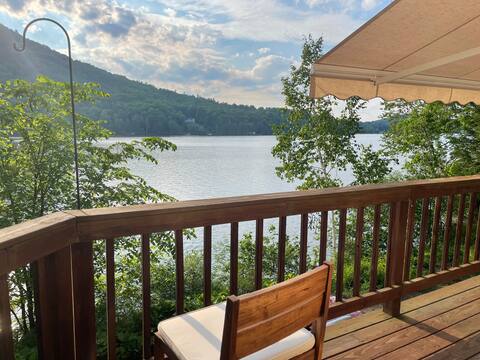
Lakefront 3 Bedroom Cottage at end of Private Lane
Entire Place • 3 bedrooms

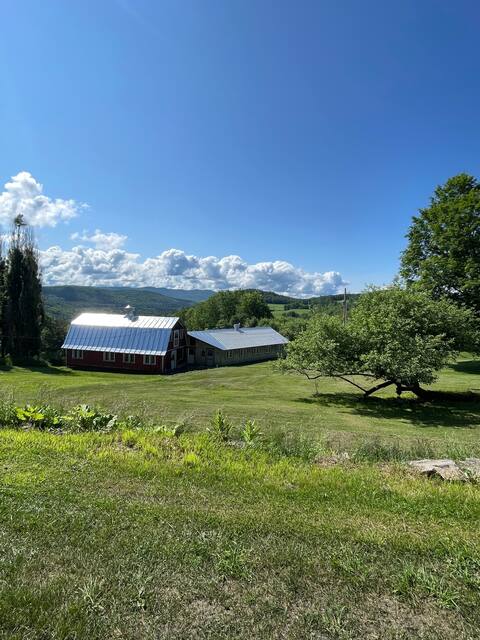
Idyllic Vermont Farmhouse: Mtn Views on 200 Acres!
Entire Place • 3 bedrooms
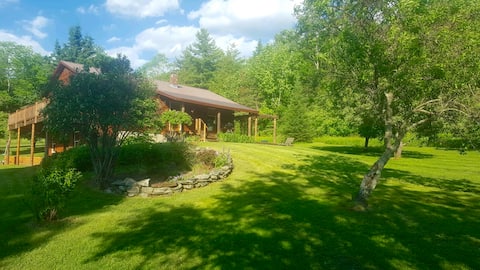
Hillside Getaway Cabin with Views
Entire Place • 2 bedrooms
Peaceful barn retreat with views
Entire Place • 2 bedrooms
Note: Performance varies based on location, size, amenities, seasonality, and management quality. Data reflects the past 12 months.
Top Performing Airbnb Hosts in Barnet (2026)
Learn from the best! This table showcases top-performing Airbnb hosts in Barnet based on the number of properties managed and estimated total revenue over the past year. Analyze their scale and performance metrics.
| Host Name | Properties | Grossing Revenue | Stay Reviews | Avg Rating |
|---|---|---|---|---|
| Social Inns | 1 | $67,242 | 4 | 5.00/5.0 |
| Jane & Mike | 5 | $66,728 | 346 | 4.94/5.0 |
| Heather | 1 | $58,364 | 21 | 5.00/5.0 |
| Helen | 1 | $52,632 | 19 | 5.00/5.0 |
| Evolve | 1 | $51,761 | 17 | 4.94/5.0 |
| Patricia Elizabeth | 1 | $38,536 | 140 | 4.99/5.0 |
| Emily | 1 | $37,624 | 18 | 5.00/5.0 |
| Rose | 1 | $27,338 | 93 | 4.87/5.0 |
| Tony | 1 | $26,345 | 5 | 5.00/5.0 |
| Monica | 1 | $24,294 | 181 | 4.92/5.0 |
Analyzing the strategies of top hosts, such as their property selection, pricing, and guest communication, can offer valuable lessons for optimizing your own Airbnb operations in Barnet.
Dive Deeper: Advanced Barnet STR Market Data (2026)
Ready to unlock more insights? AirROI provides access to advanced metrics and comprehensive Airbnb data for Barnet. Explore detailed analytics beyond this report to refine your investment strategy, optimize pricing, and maximize your vacation rental profits.
Explore Advanced MetricsBarnet Short-Term Rental Market Composition (2026): Property & Room Types
Room Type Distribution
Property Type Distribution
Market Composition Insights for Barnet
- The Barnet Airbnb market composition is heavily skewed towards Entire Home/Apt listings, which make up 100% of the 22 active rentals. This indicates strong guest preference for privacy and space.
- Looking at the property type distribution in Barnet, House properties are the most common (36.4%), reflecting the local real estate landscape.
- Houses represent a significant 36.4% portion, catering likely to families or larger groups.
- Smaller segments like hotel/boutique, unique stays (combined 9.0%) offer potential for unique stay experiences.
Barnet Airbnb Room Capacity Analysis (2026): Bedroom Distribution
Distribution of Listings by Number of Bedrooms
Room Capacity Insights for Barnet
- The dominant room capacity in Barnet is 1 bedroom listings, making up 40.9% of the market. This suggests a strong demand for properties suitable for couples or solo travelers.
- Together, 1 bedroom and 2 bedrooms properties represent 68.2% of the active Airbnb listings in Barnet, indicating a high concentration in these sizes.
- A significant 27.3% of listings offer 3+ bedrooms, catering to larger groups and families seeking more space in Barnet.
Barnet Vacation Rental Guest Capacity Trends (2026)
Distribution of Listings by Guest Capacity
Guest Capacity Insights for Barnet
- The most common guest capacity trend in Barnet vacation rentals is listings accommodating 4 guests (40.9%). This suggests the primary traveler segment is likely small families or groups.
- Properties designed for 4 guests and 3 guests dominate the Barnet STR market, accounting for 59.1% of listings.
- 27.3% of properties accommodate 6+ guests, serving the market segment for larger families or group travel in Barnet.
- On average, properties in Barnet are equipped to host 4.5 guests.
Barnet Airbnb Booking Patterns (2026): Available vs. Booked Days
Available Days Distribution
Booked Days Distribution
Booking Pattern Insights for Barnet
- The most common availability pattern in Barnet falls within the 271-366 days range, representing 50% of listings. This suggests many properties have significant open periods on their calendars.
- Approximately 95.5% of listings show high availability (181+ days open annually), indicating potential for increased bookings or specific owner usage patterns.
- For booked days, the 91-180 days range is most frequent in Barnet (40.9%), reflecting common guest stay durations or potential owner blocking patterns.
- A notable 9.1% of properties secure long booking periods (181+ days booked per year), highlighting successful long-term rental strategies or significant owner usage.
Barnet Airbnb Minimum Stay Requirements Analysis
Distribution of Listings by Minimum Night Requirement
1 Night
7 listings
31.8% of total
2 Nights
6 listings
27.3% of total
3 Nights
1 listings
4.5% of total
4-6 Nights
4 listings
18.2% of total
7-29 Nights
2 listings
9.1% of total
30+ Nights
2 listings
9.1% of total
Key Insights
- The most prevalent minimum stay requirement in Barnet is 1 Night, adopted by 31.8% of listings. This highlights the market's preference for shorter, flexible bookings.
Recommendations
- Align with the market by considering a 1 Night minimum stay, as 31.8% of Barnet hosts use this setting.
- Explore offering discounts for stays of 30+ nights to attract the 9.1% of the market seeking extended stays.
- Adjust minimum nights based on seasonality – potentially shorter during low season and longer during peak demand periods in Barnet.
Barnet Airbnb Cancellation Policy Trends Analysis (2026)
Super Strict 60 Days
1 listings
4.5% of total
Flexible
4 listings
18.2% of total
Moderate
8 listings
36.4% of total
Firm
8 listings
36.4% of total
Strict
1 listings
4.5% of total
Cancellation Policy Insights for Barnet
- The prevailing Airbnb cancellation policy trend in Barnet is Moderate, used by 36.4% of listings.
- There's a relatively balanced mix between guest-friendly (54.6%) and stricter (40.9%) policies, offering choices for different guest needs.
- Strict cancellation policies are quite rare (4.5%), potentially making listings with this policy less competitive unless justified by high demand or property type.
Recommendations for Hosts
- Consider adopting a Moderate policy to align with the 36.4% market standard in Barnet.
- Using a Strict policy might deter some guests, as only 4.5% of listings use it. Evaluate if potential revenue protection outweighs possible lower booking rates.
- Regularly review your cancellation policy against competitors and market demand shifts in Barnet.
Barnet STR Booking Lead Time Analysis (2026)
Average Booking Lead Time by Month
Booking Lead Time Insights for Barnet
- The overall average booking lead time for vacation rentals in Barnet is 56 days.
- Guests book furthest in advance for stays during July (average 74 days), likely coinciding with peak travel demand or local events.
- The shortest booking windows occur for stays in January (average 17 days), indicating more last-minute travel plans during this time.
- Seasonally, Summer (65 days avg.) sees the longest lead times, while Winter (28 days avg.) has the shortest, reflecting typical travel planning cycles.
Recommendations for Hosts
- Use the overall average lead time (56 days) as a baseline for your pricing and availability strategy in Barnet.
- For July stays, consider implementing length-of-stay discounts or slightly higher rates for bookings made less than 74 days out to capitalize on advance planning.
- Target marketing efforts for the Summer season well in advance (at least 65 days) to capture early planners.
- Monitor your own booking lead times against these Barnet averages to identify opportunities for dynamic pricing adjustments.
Popular & Essential Airbnb Amenities in Barnet (2026)
Amenity Prevalence
Amenity Insights for Barnet
- Essential amenities in Barnet that guests expect include: Hot water, Free parking on premises. Lacking these (any) could significantly impact bookings.
- Popular amenities like Smoke alarm, Dishes and silverware, Wifi are common but not universal. Offering these can provide a competitive edge.
- Warning: Wifi is not universally provided but is considered essential globally. Ensure reliable Wifi is offered.
Recommendations for Hosts
- Ensure your listing includes all essential amenities for Barnet: Hot water, Free parking on premises.
- Prioritize adding missing essentials: Hot water, Free parking on premises.
- Consider adding popular differentiators like Smoke alarm or Dishes and silverware to increase appeal.
- Highlight unique or less common amenities you offer (e.g., hot tub, dedicated workspace, EV charger) in your listing description and photos.
- Regularly check competitor amenities in Barnet to stay competitive.
Barnet Airbnb Guest Demographics & Profile Analysis (2026)
Guest Profile Summary for Barnet
- The typical guest profile for Airbnb in Barnet consists of primarily domestic travelers (87%), often arriving from nearby Boston, typically belonging to the Post-2000s (Gen Z/Alpha) group (50%), primarily speaking English or French.
- Domestic travelers account for 87.0% of guests.
- Key international markets include United States (87%) and Canada (7.9%).
- Top languages spoken are English (60.2%) followed by French (14.1%).
- A significant demographic segment is the Post-2000s (Gen Z/Alpha) group, representing 50% of guests.
Recommendations for Hosts
- Target domestic marketing efforts towards travelers from Boston and New York.
- Tailor amenities and listing descriptions to appeal to the dominant Post-2000s (Gen Z/Alpha) demographic (e.g., highlight fast WiFi, smart home features, local guides).
- Highlight unique local experiences or amenities relevant to the primary guest profile.
- Consider seasonal promotions aligned with peak travel times for key origin markets.
Nearby Short-Term Rental Market Comparison
How does the Barnet Airbnb market stack up against its neighbors? Compare key performance metrics like average monthly revenue, ADR, and occupancy rates in surrounding areas to understand the broader regional STR landscape.
| Market | Active Properties | Monthly Revenue | Daily Rate | Avg. Occupancy |
|---|---|---|---|---|
| Middletown Springs | 13 | $6,843 | $507.55 | 32% |
| Pomfret | 15 | $6,549 | $502.74 | 45% |
| Fort Ann | 35 | $6,238 | $790.41 | 37% |
| Hanover | 33 | $5,826 | $1189.51 | 41% |
| Barnstead | 36 | $5,090 | $477.12 | 42% |
| Goffstown | 13 | $5,066 | $343.72 | 53% |
| Malletts Bay | 51 | $4,842 | $444.86 | 41% |
| Town of Wilton | 103 | $4,841 | $862.83 | 38% |
| Jefferson | 28 | $4,793 | $474.72 | 40% |
| Wilmot | 11 | $4,667 | $334.67 | 51% |