Arlington Airbnb Market Analysis 2026: Short Term Rental Data & Vacation Rental Statistics in Vermont, United States
Is Airbnb profitable in Arlington in 2026? Explore comprehensive Airbnb analytics for Arlington, Vermont, United States to uncover income potential. This 2026 STR market report for Arlington, based on AirROI data from February 2025 to January 2026, reveals key trends in the niche market of 25 active listings.
Whether you're considering an Airbnb investment in Arlington, optimizing your existing vacation rental, or exploring rental arbitrage opportunities, understanding the Arlington Airbnb data is crucial. Understanding the local regulations is key to maximizing your short term rental income potential. Let's dive into the specifics.
Key Arlington Airbnb Performance Metrics Overview
Monthly Airbnb Revenue Variations & Income Potential in Arlington (2026)
Understanding the monthly revenue variations for Airbnb listings in Arlington is key to maximizing your short term rental income potential. Seasonality significantly impacts earnings. Our analysis, based on data from the past 12 months, shows that the peak revenue month for STRs in Arlington is typically August, while April often presents the lowest earnings, highlighting opportunities for strategic pricing adjustments during shoulder and low seasons. Explore the typical Airbnb income in Arlington across different performance tiers:
- Best-in-class properties (Top 10%) achieve $6,971+ monthly, often utilizing dynamic pricing and superior guest experiences.
- Strong performing properties (Top 25%) earn $4,434 or more, indicating effective management and desirable locations/amenities.
- Typical properties (Median) generate around $2,515 per month, representing the average market performance.
- Entry-level properties (Bottom 25%) see earnings around $1,238, often with potential for optimization.
Average Monthly Airbnb Earnings Trend in Arlington
Arlington Airbnb Occupancy Rate Trends (2026)
Maximize your bookings by understanding the Arlington STR occupancy trends. Seasonal demand shifts significantly influence how often properties are booked. Typically, Augustsees the highest demand (peak season occupancy), while April experiences the lowest (low season). Effective strategies, like adjusting minimum stays or offering promotions, can boost occupancy during slower periods. Here's how different property tiers perform in Arlington:
- Best-in-class properties (Top 10%) achieve 74%+ occupancy, indicating high desirability and potentially optimized availability.
- Strong performing properties (Top 25%) maintain 56% or higher occupancy, suggesting good market fit and guest satisfaction.
- Typical properties (Median) have an occupancy rate around 34%.
- Entry-level properties (Bottom 25%) average 20% occupancy, potentially facing higher vacancy.
Average Monthly Occupancy Rate Trend in Arlington
Average Daily Rate (ADR) Airbnb Trends in Arlington (2026)
Effective short term rental pricing strategy in Arlington involves understanding monthly ADR fluctuations. The Average Daily Rate (ADR) for Airbnb in Arlington typically peaks in December and dips lowest during April. Leveraging Airbnb dynamic pricing tools or strategies based on this seasonality can significantly boost revenue. Here's a look at the typical nightly rates achieved:
- Best-in-class properties (Top 10%) command rates of $456+ per night, often due to premium features or locations.
- Strong performing properties (Top 25%) achieve nightly rates of $329 or more.
- Typical properties (Median) charge around $222 per night.
- Entry-level properties (Bottom 25%) earn around $144 per night.
Average Daily Rate (ADR) Trend by Month in Arlington
Get Live Arlington Market Intelligence 👇

Explore Real-time Analytics
Airbnb Seasonality Analysis & Trends in Arlington (2026)
Peak Season (August, December, July)
- Revenue averages $4,470 per month
- Occupancy rates average 46.6%
- Daily rates average $284
Shoulder Season
- Revenue averages $3,188 per month
- Occupancy maintains around 41.1%
- Daily rates hold near $273
Low Season (January, March, April)
- Revenue drops to average $2,357 per month
- Occupancy decreases to average 28.8%
- Daily rates adjust to average $262
Seasonality Insights for Arlington
- The Airbnb seasonality in Arlington shows highly seasonal trends requiring careful strategy. While the sections above show seasonal averages, it's also insightful to look at the extremes:
- During the high season, the absolute peak month showcases Arlington's highest earning potential, with monthly revenues capable of climbing to $4,670, occupancy reaching a high of 55.8%, and ADRs peaking at $318.
- Conversely, the slowest single month of the year, typically falling within the low season, marks the market's lowest point. In this month, revenue might dip to $2,090, occupancy could drop to 26.7%, and ADRs may adjust down to $247.
- Understanding both the seasonal averages and these monthly peaks and troughs in revenue, occupancy, and ADR is crucial for maximizing your Airbnb profit potential in Arlington.
Seasonal Strategies for Maximizing Profit
- Peak Season: Maximize revenue through premium pricing and potentially longer minimum stays. Ensure high availability.
- Low Season: Offer competitive pricing, special promotions (e.g., extended stay discounts), and flexible cancellation policies. Target off-season travelers like remote workers or budget-conscious guests.
- Shoulder Seasons: Implement dynamic pricing that balances peak and low rates. Target weekend travelers or specific events. Offer slightly more flexible terms than peak season.
- Regularly analyze your own performance against these Arlington seasonality benchmarks and adjust your pricing and availability strategy accordingly.
Best Areas for Airbnb Investment in Arlington (2026)
Exploring the top neighborhoods for short-term rentals in Arlington? This section highlights key areas, outlining why they are attractive for hosts and guests, along with notable local attractions. Consider these locations based on your target guest profile and investment strategy.
| Neighborhood / Area | Why Host Here? (Target Guests & Appeal) | Key Attractions & Landmarks |
|---|---|---|
| Downtown Arlington | A vibrant area with plenty of restaurants, shops, and cultural experiences. Ideal for tourists who want to explore local attractions and enjoy the community vibe. | Arlington Arts Center, Virginia Gardens, Bike Trails, Ballston Common Mall, The Drugstore, Taziki's Mediterranean Cafe |
| Sherlington | A charming neighborhood with a blend of shops, dining, and theaters. Popular among locals and tourists for its unique offerings and easy access to local transportation. | Signature Theatre, Shirlington Dog Park, Patterson Park, The Village at Shirlington, The Arlington Theatre |
| Clarendon | Known for its trendy atmosphere, Clarendon offers a mix of nightlife and dining options. It's a hotspot for young professionals and visitors looking for a vibrant local scene. | Clarendon Central Park, Market Common, The Food Truck Court, Boutiques and Bars, Towers Park |
| Ballston | A bustling neighborhood with a mix of high-density housing and commercial establishments. Great for business travelers and leisure visitors alike, with easy access to metro stations. | Ballston Quarter, Parks and Recreation Facilities, The District Taco, The Continental, Calvary Baptist Church |
| Old Town | Historic charm with beautiful architecture and waterfront views. Attracts visitors interested in history, shopping, and dining in a scenic environment. | Old Town Historic District, Potomac River, King Street, Alexandria's Waterfront, Carlyle House Historic Park |
| Metro Accessible Areas | Proximity to Metro stations makes it convenient for visitors to explore DC and surrounding areas. Ideal for those who want easy access to transportation. | Washington, DC, National Mall, Smithsonian Museums, Lincoln Memorial, Easement and Parks along the Metro |
| Nature & Parks | Arlington's proximity to parks and outdoor spaces is a draw for nature lovers and families. Great for hosting guests looking for recreational activities. | Arlington National Cemetery, Iwo Jima Memorial, Roosevelt Island, Potomac Overlook Regional Park, Four Mile Run |
| Cultural Spots | With many museums and cultural institutions, this area appeals to guests interested in art, history, and education. A unique aspect for attracting renting travelers. | The Air Force Memorial, The National 9/11 Memorial, The National Museum of the Marine Corps, Sculpture Walk, The Arlington Historical Museum |
Understanding Airbnb License Requirements & STR Laws in Arlington (2026)
With 16% of listings showing registration in 2026, understanding potential Airbnb license requirements is crucial in Arlington. Always verify the latest short term rental regulations and Airbnb license requirements directly with local government authorities for Arlington to ensure full compliance before hosting.
(Source: AirROI data, 2026, based on 16% licensed listings)
Top Performing Airbnb Properties in Arlington (2026)
Benchmark your potential! Explore examples of top-performing Airbnb properties in Arlingtonbased on Trailing Twelve Month (TTM) revenue. Analyze their characteristics, revenue, occupancy rate, and ADR to understand what drives success in this market.
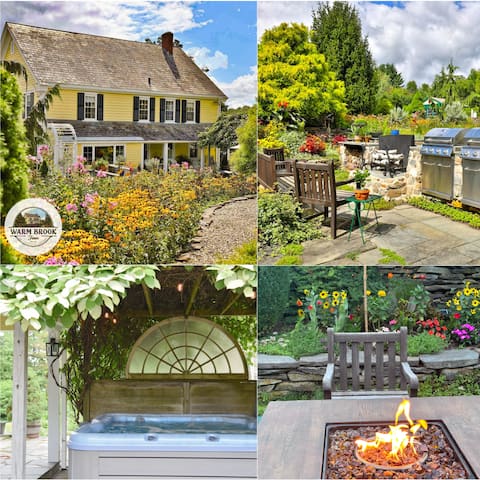
Warm Brook Farm+Entertainers Dream+Hot Tub+Ski VT
Entire Place • 4 bedrooms

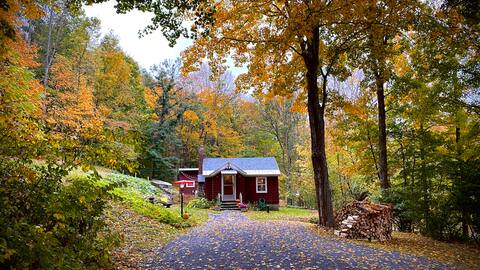
Vermont Historic Farmhouse Ski/Hike/River
Entire Place • 3 bedrooms

The Riverside Treehouse
Entire Place • 3 bedrooms

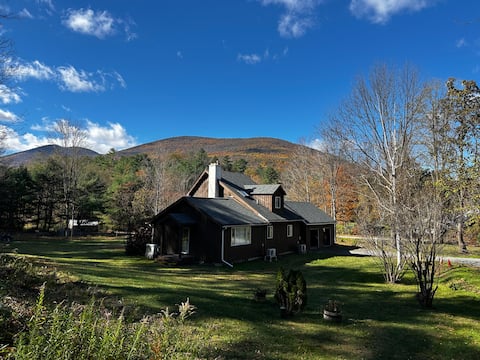
Pet Friendly - VT MT House on 52 acres w/Hot Tub!
Entire Place • 3 bedrooms
The Sheep Shack - a cozy Vermont cabin
Entire Place • 2 bedrooms
Southern Vermont Cottage
Entire Place • 3 bedrooms
Note: Performance varies based on location, size, amenities, seasonality, and management quality. Data reflects the past 12 months.
Top Performing Airbnb Hosts in Arlington (2026)
Learn from the best! This table showcases top-performing Airbnb hosts in Arlington based on the number of properties managed and estimated total revenue over the past year. Analyze their scale and performance metrics.
| Host Name | Properties | Grossing Revenue | Stay Reviews | Avg Rating |
|---|---|---|---|---|
| Trevor | 1 | $100,558 | 115 | 5.00/5.0 |
| Sierra | 2 | $61,325 | 20 | 4.72/5.0 |
| Larissa | 1 | $60,835 | 62 | 4.92/5.0 |
| Sam | 1 | $49,619 | 11 | 4.55/5.0 |
| Sara | 1 | $44,628 | 82 | 4.96/5.0 |
| Jess | 1 | $42,803 | 128 | 4.94/5.0 |
| John | 1 | $42,020 | 121 | 4.94/5.0 |
| Scott | 1 | $40,496 | 24 | 5.00/5.0 |
| Andrew | 1 | $34,806 | 34 | 4.97/5.0 |
| Ryan | 1 | $33,118 | 45 | 5.00/5.0 |
Analyzing the strategies of top hosts, such as their property selection, pricing, and guest communication, can offer valuable lessons for optimizing your own Airbnb operations in Arlington.
Dive Deeper: Advanced Arlington STR Market Data (2026)
Ready to unlock more insights? AirROI provides access to advanced metrics and comprehensive Airbnb data for Arlington. Explore detailed analytics beyond this report to refine your investment strategy, optimize pricing, and maximize your vacation rental profits.
Explore Advanced MetricsArlington Short-Term Rental Market Composition (2026): Property & Room Types
Room Type Distribution
Property Type Distribution
Market Composition Insights for Arlington
- The Arlington Airbnb market composition is heavily skewed towards Entire Home/Apt listings, which make up 88% of the 25 active rentals. This indicates strong guest preference for privacy and space.
- Looking at the property type distribution in Arlington, House properties are the most common (60%), reflecting the local real estate landscape.
- Houses represent a significant 60% portion, catering likely to families or larger groups.
- The presence of 16% Hotel/Boutique listings indicates integration with traditional hospitality.
Arlington Airbnb Room Capacity Analysis (2026): Bedroom Distribution
Distribution of Listings by Number of Bedrooms
Room Capacity Insights for Arlington
- The dominant room capacity in Arlington is 3 bedrooms listings, making up 40% of the market. This suggests a strong demand for properties suitable for families or small groups.
- Together, 3 bedrooms and 1 bedroom properties represent 64.0% of the active Airbnb listings in Arlington, indicating a high concentration in these sizes.
- A significant 48.0% of listings offer 3+ bedrooms, catering to larger groups and families seeking more space in Arlington.
Arlington Vacation Rental Guest Capacity Trends (2026)
Distribution of Listings by Guest Capacity
Guest Capacity Insights for Arlington
- The most common guest capacity trend in Arlington vacation rentals is listings accommodating 8+ guests (24%). This suggests the primary traveler segment is likely larger groups.
- Properties designed for 8+ guests and 4 guests dominate the Arlington STR market, accounting for 48.0% of listings.
- 44.0% of properties accommodate 6+ guests, serving the market segment for larger families or group travel in Arlington.
- On average, properties in Arlington are equipped to host 4.6 guests.
Arlington Airbnb Booking Patterns (2026): Available vs. Booked Days
Available Days Distribution
Booked Days Distribution
Booking Pattern Insights for Arlington
- The most common availability pattern in Arlington falls within the 271-366 days range, representing 40% of listings. This suggests many properties have significant open periods on their calendars.
- Approximately 76.0% of listings show high availability (181+ days open annually), indicating potential for increased bookings or specific owner usage patterns.
- For booked days, the 91-180 days range is most frequent in Arlington (36%), reflecting common guest stay durations or potential owner blocking patterns.
- A notable 28.0% of properties secure long booking periods (181+ days booked per year), highlighting successful long-term rental strategies or significant owner usage.
Arlington Airbnb Minimum Stay Requirements Analysis
Distribution of Listings by Minimum Night Requirement
1 Night
2 listings
8% of total
2 Nights
17 listings
68% of total
4-6 Nights
1 listings
4% of total
30+ Nights
5 listings
20% of total
Key Insights
- The most prevalent minimum stay requirement in Arlington is 2 Nights, adopted by 68% of listings. This highlights the market's preference for shorter, flexible bookings.
- A strong majority (76.0%) of the Arlington Airbnb data shows acceptance of very short stays (1-2 nights), indicating a dynamic, high-turnover market.
- A significant segment (20%) caters to monthly stays (30+ nights) in Arlington, pointing to opportunities in the extended-stay market.
Recommendations
- Align with the market by considering a 2 Nights minimum stay, as 68% of Arlington hosts use this setting.
- If feasible, allowing 1-night stays, especially midweek or during low season, could capture last-minute bookings, as only 8% currently do.
- A 2-night minimum appears standard (68%). Consider this for weekends or peak periods.
- Explore offering discounts for stays of 30+ nights to attract the 20% of the market seeking extended stays.
- Adjust minimum nights based on seasonality – potentially shorter during low season and longer during peak demand periods in Arlington.
Arlington Airbnb Cancellation Policy Trends Analysis (2026)
Super Strict 30 Days
1 listings
4% of total
Flexible
7 listings
28% of total
Moderate
8 listings
32% of total
Firm
6 listings
24% of total
Strict
3 listings
12% of total
Cancellation Policy Insights for Arlington
- The prevailing Airbnb cancellation policy trend in Arlington is Moderate, used by 32% of listings.
- There's a relatively balanced mix between guest-friendly (60.0%) and stricter (36.0%) policies, offering choices for different guest needs.
Recommendations for Hosts
- Consider adopting a Moderate policy to align with the 32% market standard in Arlington.
- Using a Strict policy might deter some guests, as only 12% of listings use it. Evaluate if potential revenue protection outweighs possible lower booking rates.
- Regularly review your cancellation policy against competitors and market demand shifts in Arlington.
Arlington STR Booking Lead Time Analysis (2026)
Average Booking Lead Time by Month
Booking Lead Time Insights for Arlington
- The overall average booking lead time for vacation rentals in Arlington is 62 days.
- Guests book furthest in advance for stays during August (average 89 days), likely coinciding with peak travel demand or local events.
- The shortest booking windows occur for stays in March (average 27 days), indicating more last-minute travel plans during this time.
- Seasonally, Summer (75 days avg.) sees the longest lead times, while Winter (41 days avg.) has the shortest, reflecting typical travel planning cycles.
Recommendations for Hosts
- Use the overall average lead time (62 days) as a baseline for your pricing and availability strategy in Arlington.
- For August stays, consider implementing length-of-stay discounts or slightly higher rates for bookings made less than 89 days out to capitalize on advance planning.
- Target marketing efforts for the Summer season well in advance (at least 75 days) to capture early planners.
- Monitor your own booking lead times against these Arlington averages to identify opportunities for dynamic pricing adjustments.
Popular & Essential Airbnb Amenities in Arlington (2026)
Amenity Prevalence
Amenity Insights for Arlington
- Essential amenities in Arlington that guests expect include: Carbon monoxide alarm, Heating, Free parking on premises, Smoke alarm, Hot water, Coffee maker, Kitchen, Fire extinguisher, Wifi, Refrigerator. Lacking these (any) could significantly impact bookings.
Recommendations for Hosts
- Ensure your listing includes all essential amenities for Arlington: Carbon monoxide alarm, Heating, Free parking on premises, Smoke alarm, Hot water, Coffee maker, Kitchen, Fire extinguisher, Wifi, Refrigerator.
- Prioritize adding missing essentials: Kitchen, Fire extinguisher, Wifi, Refrigerator.
- Highlight unique or less common amenities you offer (e.g., hot tub, dedicated workspace, EV charger) in your listing description and photos.
- Regularly check competitor amenities in Arlington to stay competitive.
Arlington Airbnb Guest Demographics & Profile Analysis (2026)
Guest Profile Summary for Arlington
- The typical guest profile for Airbnb in Arlington consists of primarily domestic travelers (97%), often arriving from nearby New York, typically belonging to the Post-2000s (Gen Z/Alpha) group (50%), primarily speaking English or French.
- Domestic travelers account for 96.8% of guests.
- Key international markets include United States (96.8%) and DC (1.4%).
- Top languages spoken are English (66.1%) followed by French (9.9%).
- A significant demographic segment is the Post-2000s (Gen Z/Alpha) group, representing 50% of guests.
Recommendations for Hosts
- Target domestic marketing efforts towards travelers from New York and Boston.
- Tailor amenities and listing descriptions to appeal to the dominant Post-2000s (Gen Z/Alpha) demographic (e.g., highlight fast WiFi, smart home features, local guides).
- Highlight unique local experiences or amenities relevant to the primary guest profile.
- Consider seasonal promotions aligned with peak travel times for key origin markets.
Nearby Short-Term Rental Market Comparison
How does the Arlington Airbnb market stack up against its neighbors? Compare key performance metrics like average monthly revenue, ADR, and occupancy rates in surrounding areas to understand the broader regional STR landscape.
| Market | Active Properties | Monthly Revenue | Daily Rate | Avg. Occupancy |
|---|---|---|---|---|
| Middletown Springs | 13 | $6,843 | $507.55 | 32% |
| Pomfret | 15 | $6,549 | $502.74 | 45% |
| Fort Ann | 35 | $6,238 | $790.41 | 37% |
| Hanover | 33 | $5,826 | $1189.51 | 41% |
| Town of Ancram | 22 | $5,616 | $512.55 | 38% |
| Town of Schodack | 11 | $5,158 | $555.89 | 29% |
| Town of Stillwater | 55 | $5,153 | $564.54 | 42% |
| Monterey | 41 | $5,089 | $470.60 | 44% |
| Malletts Bay | 51 | $4,842 | $444.86 | 41% |
| Town of Wilton | 103 | $4,841 | $862.83 | 38% |