Virgin Airbnb Market Analysis 2026: Short Term Rental Data & Vacation Rental Statistics in Utah, United States
Is Airbnb profitable in Virgin in 2026? Explore comprehensive Airbnb analytics for Virgin, Utah, United States to uncover income potential. This 2026 STR market report for Virgin, based on AirROI data from February 2025 to January 2026, reveals key trends in the niche market of 112 active listings.
Whether you're considering an Airbnb investment in Virgin, optimizing your existing vacation rental, or exploring rental arbitrage opportunities, understanding the Virgin Airbnb data is crucial. Leveraging the low regulation environment is key to maximizing your short term rental income potential. Let's dive into the specifics.
Key Virgin Airbnb Performance Metrics Overview
Monthly Airbnb Revenue Variations & Income Potential in Virgin (2026)
Understanding the monthly revenue variations for Airbnb listings in Virgin is key to maximizing your short term rental income potential. Seasonality significantly impacts earnings. Our analysis, based on data from the past 12 months, shows that the peak revenue month for STRs in Virgin is typically October, while January often presents the lowest earnings, highlighting opportunities for strategic pricing adjustments during shoulder and low seasons. Explore the typical Airbnb income in Virgin across different performance tiers:
- Best-in-class properties (Top 10%) achieve $7,795+ monthly, often utilizing dynamic pricing and superior guest experiences.
- Strong performing properties (Top 25%) earn $4,318 or more, indicating effective management and desirable locations/amenities.
- Typical properties (Median) generate around $2,728 per month, representing the average market performance.
- Entry-level properties (Bottom 25%) see earnings around $1,632, often with potential for optimization.
Average Monthly Airbnb Earnings Trend in Virgin
Virgin Airbnb Occupancy Rate Trends (2026)
Maximize your bookings by understanding the Virgin STR occupancy trends. Seasonal demand shifts significantly influence how often properties are booked. Typically, Maysees the highest demand (peak season occupancy), while January experiences the lowest (low season). Effective strategies, like adjusting minimum stays or offering promotions, can boost occupancy during slower periods. Here's how different property tiers perform in Virgin:
- Best-in-class properties (Top 10%) achieve 76%+ occupancy, indicating high desirability and potentially optimized availability.
- Strong performing properties (Top 25%) maintain 60% or higher occupancy, suggesting good market fit and guest satisfaction.
- Typical properties (Median) have an occupancy rate around 40%.
- Entry-level properties (Bottom 25%) average 21% occupancy, potentially facing higher vacancy.
Average Monthly Occupancy Rate Trend in Virgin
Average Daily Rate (ADR) Airbnb Trends in Virgin (2026)
Effective short term rental pricing strategy in Virgin involves understanding monthly ADR fluctuations. The Average Daily Rate (ADR) for Airbnb in Virgin typically peaks in October and dips lowest during February. Leveraging Airbnb dynamic pricing tools or strategies based on this seasonality can significantly boost revenue. Here's a look at the typical nightly rates achieved:
- Best-in-class properties (Top 10%) command rates of $533+ per night, often due to premium features or locations.
- Strong performing properties (Top 25%) achieve nightly rates of $353 or more.
- Typical properties (Median) charge around $238 per night.
- Entry-level properties (Bottom 25%) earn around $155 per night.
Average Daily Rate (ADR) Trend by Month in Virgin
Get Live Virgin Market Intelligence 👇

Explore Real-time Analytics
Airbnb Seasonality Analysis & Trends in Virgin (2026)
Peak Season (October, May, April)
- Revenue averages $4,955 per month
- Occupancy rates average 55.1%
- Daily rates average $302
Shoulder Season
- Revenue averages $3,799 per month
- Occupancy maintains around 41.3%
- Daily rates hold near $288
Low Season (January, February, December)
- Revenue drops to average $2,357 per month
- Occupancy decreases to average 28.7%
- Daily rates adjust to average $267
Seasonality Insights for Virgin
- The Airbnb seasonality in Virgin shows highly seasonal trends requiring careful strategy. While the sections above show seasonal averages, it's also insightful to look at the extremes:
- During the high season, the absolute peak month showcases Virgin's highest earning potential, with monthly revenues capable of climbing to $5,184, occupancy reaching a high of 56.2%, and ADRs peaking at $333.
- Conversely, the slowest single month of the year, typically falling within the low season, marks the market's lowest point. In this month, revenue might dip to $1,881, occupancy could drop to 23.6%, and ADRs may adjust down to $246.
- Understanding both the seasonal averages and these monthly peaks and troughs in revenue, occupancy, and ADR is crucial for maximizing your Airbnb profit potential in Virgin.
Seasonal Strategies for Maximizing Profit
- Peak Season: Maximize revenue through premium pricing and potentially longer minimum stays. Ensure high availability.
- Low Season: Offer competitive pricing, special promotions (e.g., extended stay discounts), and flexible cancellation policies. Target off-season travelers like remote workers or budget-conscious guests.
- Shoulder Seasons: Implement dynamic pricing that balances peak and low rates. Target weekend travelers or specific events. Offer slightly more flexible terms than peak season.
- Regularly analyze your own performance against these Virgin seasonality benchmarks and adjust your pricing and availability strategy accordingly.
Best Areas for Airbnb Investment in Virgin (2026)
Exploring the top neighborhoods for short-term rentals in Virgin? This section highlights key areas, outlining why they are attractive for hosts and guests, along with notable local attractions. Consider these locations based on your target guest profile and investment strategy.
| Neighborhood / Area | Why Host Here? (Target Guests & Appeal) | Key Attractions & Landmarks |
|---|---|---|
| Zion National Park | One of the most popular national parks in the United States, offering breathtaking landscapes and outdoor activities like hiking. Great for attracting nature lovers and adventure seekers year-round. | Angels Landing, The Narrows, Zion Canyon Scenic Drive, Zion-Mount Carmel Highway, Emerald Pools |
| Springdale | The gateway town to Zion National Park, popular with tourists seeking accommodations close to the park. Offers a variety of restaurants, shops, and tour services. | Zion Canyon Visitor Center, Springdale's scenic views, Local art galleries, Restaurants featuring local cuisine, Shuttle services to Zion |
| St. George | A growing city with a warm climate and plenty of recreational opportunities. Popular with families and retirees, offering a mix of urban and outdoor lifestyles. | Snow Canyon State Park, Red Cliffs Desert Reserve, St. George Utah Temple, Tuacahn Amphitheatre, Sand Hollow State Park |
| La Verkin | A small town near Zion National Park, perfect for visitors looking for a quieter, more local experience. Access to hiking, biking, and the great outdoors. | La Verkin Creek, Hiking trails nearby, Scenic nature views, Quiet residential neighborhoods, Local dining options |
| Hurricane | Known for its proximity to multiple national parks and outdoor recreation areas. Attracts visitors looking for adventure sports and family-friendly activities. | Sand Hollow Reservoir, Quail Creek State Park, Hurricane Valley Heritage Park, Mountain biking trails, Local festivals |
| Toquerville | A small town that offers a peaceful atmosphere while still being close to nature attractions. Ideal for those looking to escape the hustle and bustle. | Toquerville Falls, Scenic views of the surrounding mountains, Nature trails, Quiet leisure activities, Rural charm |
| Virgin | A quaint community offering easy access to nearby attractions including Zion National Park. Attracts visitors seeking a rural retreat with natural beauty. | Virgin River, Scenic drives, Local parks, Outdoor activities, Close to Zion National Park |
| Rockville | A picturesque town located near Zion National Park, known for its charming atmosphere and beautiful landscapes. Appeals to visitors looking for tranquility and nature. | Zion National Park's east side, Historic buildings, Local art and culture, Hiking trails, River access |
Understanding Airbnb License Requirements & STR Laws in Virgin (2026)
While Virgin, Utah, United States currently shows low STR regulations, specific Airbnb license requirements might still exist or change. Always verify the latest short term rental regulations and Airbnb license requirements directly with local government authorities for Virgin to ensure full compliance before hosting.
(Source: AirROI data, 2026, finding no licensed listings among those analyzed)
Top Performing Airbnb Properties in Virgin (2026)
Benchmark your potential! Explore examples of top-performing Airbnb properties in Virginbased on Trailing Twelve Month (TTM) revenue. Analyze their characteristics, revenue, occupancy rate, and ADR to understand what drives success in this market.
Zion Farmhouse | Virgin River, Private Pool, Zion
Entire Place • 5 bedrooms
Zion Villa True North: Actually Located in Zion NP
Entire Place • 5 bedrooms

Zion's Edge, Kolob, Private Pool/Hot Tub - Views!
Entire Place • 5 bedrooms
Zion Luxe, Entire home
Entire Place • 4 bedrooms
Extraordinary Home Near Zion with Pool & Hot Tub
Entire Place • 5 bedrooms
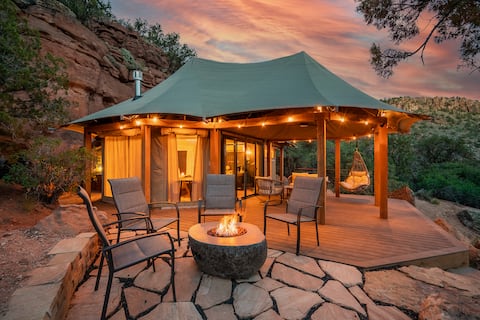
Star Seeker Luxury Camp
Entire Place • 1 bedroom
Note: Performance varies based on location, size, amenities, seasonality, and management quality. Data reflects the past 12 months.
Top Performing Airbnb Hosts in Virgin (2026)
Learn from the best! This table showcases top-performing Airbnb hosts in Virgin based on the number of properties managed and estimated total revenue over the past year. Analyze their scale and performance metrics.
| Host Name | Properties | Grossing Revenue | Stay Reviews | Avg Rating |
|---|---|---|---|---|
| Zion White Bison | 32 | $600,858 | 368 | 4.93/5.0 |
| Angelea | 6 | $270,630 | 775 | 4.89/5.0 |
| Bygnal | 4 | $265,285 | 164 | 4.99/5.0 |
| Robert | 4 | $199,964 | 262 | 4.99/5.0 |
| Jennifer | 5 | $198,187 | 278 | 4.98/5.0 |
| Southern Utah Luxury | 1 | $178,740 | 11 | 5.00/5.0 |
| Hank | 1 | $177,382 | 207 | 5.00/5.0 |
| Cameron | 4 | $174,449 | 1738 | 4.93/5.0 |
| Zion | 4 | $165,486 | 660 | 4.93/5.0 |
| Trish | 1 | $165,408 | 44 | 5.00/5.0 |
Analyzing the strategies of top hosts, such as their property selection, pricing, and guest communication, can offer valuable lessons for optimizing your own Airbnb operations in Virgin.
Dive Deeper: Advanced Virgin STR Market Data (2026)
Ready to unlock more insights? AirROI provides access to advanced metrics and comprehensive Airbnb data for Virgin. Explore detailed analytics beyond this report to refine your investment strategy, optimize pricing, and maximize your vacation rental profits.
Explore Advanced MetricsVirgin Short-Term Rental Market Composition (2026): Property & Room Types
Room Type Distribution
Property Type Distribution
Market Composition Insights for Virgin
- The Virgin Airbnb market composition is heavily skewed towards Entire Home/Apt listings, which make up 95.5% of the 112 active rentals. This indicates strong guest preference for privacy and space.
- Looking at the property type distribution in Virgin, House properties are the most common (33%), reflecting the local real estate landscape.
- Houses represent a significant 33% portion, catering likely to families or larger groups.
- Smaller segments like hotel/boutique, unique stays (combined 7.2%) offer potential for unique stay experiences.
Virgin Airbnb Room Capacity Analysis (2026): Bedroom Distribution
Distribution of Listings by Number of Bedrooms
Room Capacity Insights for Virgin
- The dominant room capacity in Virgin is 1 bedroom listings, making up 72.3% of the market. This suggests a strong demand for properties suitable for couples or solo travelers.
- Together, 1 bedroom and 2 bedrooms properties represent 84.8% of the active Airbnb listings in Virgin, indicating a high concentration in these sizes.
- With over half the market (72.3%) consisting of studios or 1-bedroom units, Virgin is particularly well-suited for individuals or couples.
Virgin Vacation Rental Guest Capacity Trends (2026)
Distribution of Listings by Guest Capacity
Guest Capacity Insights for Virgin
- The most common guest capacity trend in Virgin vacation rentals is listings accommodating 4 guests (33%). This suggests the primary traveler segment is likely small families or groups.
- Properties designed for 4 guests and 2 guests dominate the Virgin STR market, accounting for 58.9% of listings.
- 26.8% of properties accommodate 6+ guests, serving the market segment for larger families or group travel in Virgin.
- On average, properties in Virgin are equipped to host 4.1 guests.
Virgin Airbnb Booking Patterns (2026): Available vs. Booked Days
Available Days Distribution
Booked Days Distribution
Booking Pattern Insights for Virgin
- The most common availability pattern in Virgin falls within the 271-366 days range, representing 41.1% of listings. This suggests many properties have significant open periods on their calendars.
- Approximately 76.8% of listings show high availability (181+ days open annually), indicating potential for increased bookings or specific owner usage patterns.
- For booked days, the 91-180 days range is most frequent in Virgin (37.5%), reflecting common guest stay durations or potential owner blocking patterns.
- A notable 23.2% of properties secure long booking periods (181+ days booked per year), highlighting successful long-term rental strategies or significant owner usage.
Virgin Airbnb Minimum Stay Requirements Analysis
Distribution of Listings by Minimum Night Requirement
1 Night
56 listings
50% of total
2 Nights
16 listings
14.3% of total
4-6 Nights
1 listings
0.9% of total
30+ Nights
39 listings
34.8% of total
Key Insights
- The most prevalent minimum stay requirement in Virgin is 1 Night, adopted by 50% of listings. This highlights the market's preference for shorter, flexible bookings.
- A strong majority (64.3%) of the Virgin Airbnb data shows acceptance of very short stays (1-2 nights), indicating a dynamic, high-turnover market.
- A significant segment (34.8%) caters to monthly stays (30+ nights) in Virgin, pointing to opportunities in the extended-stay market.
Recommendations
- Align with the market by considering a 1 Night minimum stay, as 50% of Virgin hosts use this setting.
- Explore offering discounts for stays of 30+ nights to attract the 34.8% of the market seeking extended stays.
- Adjust minimum nights based on seasonality – potentially shorter during low season and longer during peak demand periods in Virgin.
Virgin Airbnb Cancellation Policy Trends Analysis (2026)
Limited
1 listings
0.9% of total
Super Strict 30 Days
32 listings
28.6% of total
Flexible
15 listings
13.4% of total
Moderate
35 listings
31.3% of total
Firm
19 listings
17% of total
Strict
10 listings
8.9% of total
Cancellation Policy Insights for Virgin
- The prevailing Airbnb cancellation policy trend in Virgin is Moderate, used by 31.3% of listings.
- There's a relatively balanced mix between guest-friendly (44.7%) and stricter (25.9%) policies, offering choices for different guest needs.
- Strict cancellation policies are quite rare (8.9%), potentially making listings with this policy less competitive unless justified by high demand or property type.
Recommendations for Hosts
- Consider adopting a Moderate policy to align with the 31.3% market standard in Virgin.
- Using a Strict policy might deter some guests, as only 8.9% of listings use it. Evaluate if potential revenue protection outweighs possible lower booking rates.
- Regularly review your cancellation policy against competitors and market demand shifts in Virgin.
Virgin STR Booking Lead Time Analysis (2026)
Average Booking Lead Time by Month
Booking Lead Time Insights for Virgin
- The overall average booking lead time for vacation rentals in Virgin is 72 days.
- Guests book furthest in advance for stays during September (average 99 days), likely coinciding with peak travel demand or local events.
- The shortest booking windows occur for stays in January (average 31 days), indicating more last-minute travel plans during this time.
- Seasonally, Fall (85 days avg.) sees the longest lead times, while Winter (40 days avg.) has the shortest, reflecting typical travel planning cycles.
Recommendations for Hosts
- Use the overall average lead time (72 days) as a baseline for your pricing and availability strategy in Virgin.
- For September stays, consider implementing length-of-stay discounts or slightly higher rates for bookings made less than 99 days out to capitalize on advance planning.
- Target marketing efforts for the Fall season well in advance (at least 85 days) to capture early planners.
- Monitor your own booking lead times against these Virgin averages to identify opportunities for dynamic pricing adjustments.
Popular & Essential Airbnb Amenities in Virgin (2026)
Amenity Prevalence
Amenity Insights for Virgin
- Popular amenities like Fire extinguisher, Essentials, Wifi are common but not universal. Offering these can provide a competitive edge.
- Warning: Wifi is not universally provided but is considered essential globally. Ensure reliable Wifi is offered.
Recommendations for Hosts
- Consider adding popular differentiators like Fire extinguisher or Essentials to increase appeal.
- Highlight unique or less common amenities you offer (e.g., hot tub, dedicated workspace, EV charger) in your listing description and photos.
- Regularly check competitor amenities in Virgin to stay competitive.
Virgin Airbnb Guest Demographics & Profile Analysis (2026)
Guest Profile Summary for Virgin
- The typical guest profile for Airbnb in Virgin consists of primarily domestic travelers (91%), often arriving from nearby Las Vegas, typically belonging to the Post-2000s (Gen Z/Alpha) group (50%), primarily speaking English or Spanish.
- Domestic travelers account for 90.6% of guests.
- Key international markets include United States (90.6%) and Canada (2.2%).
- Top languages spoken are English (64%) followed by Spanish (10.4%).
- A significant demographic segment is the Post-2000s (Gen Z/Alpha) group, representing 50% of guests.
Recommendations for Hosts
- Target domestic marketing efforts towards travelers from Las Vegas and New York.
- Tailor amenities and listing descriptions to appeal to the dominant Post-2000s (Gen Z/Alpha) demographic (e.g., highlight fast WiFi, smart home features, local guides).
- Highlight unique local experiences or amenities relevant to the primary guest profile.
- Consider seasonal promotions aligned with peak travel times for key origin markets.
Nearby Short-Term Rental Market Comparison
How does the Virgin Airbnb market stack up against its neighbors? Compare key performance metrics like average monthly revenue, ADR, and occupancy rates in surrounding areas to understand the broader regional STR landscape.
| Market | Active Properties | Monthly Revenue | Daily Rate | Avg. Occupancy |
|---|---|---|---|---|
| Springdale | 135 | $5,417 | $457.31 | 46% |
| Rockville | 22 | $4,535 | $488.30 | 33% |
| Hurricane | 730 | $3,797 | $329.21 | 45% |
| Santa Clara | 279 | $3,789 | $427.47 | 36% |
| Orderville | 256 | $3,275 | $321.28 | 38% |
| Alton | 45 | $3,237 | $279.82 | 45% |
| Washington | 727 | $3,087 | $298.55 | 40% |
| La Verkin | 191 | $2,946 | $206.59 | 51% |
| Mesquite | 138 | $2,891 | $250.63 | 46% |
| Duck Creek Village | 237 | $2,869 | $293.13 | 36% |