Santa Clara Airbnb Market Analysis 2026: Short Term Rental Data & Vacation Rental Statistics in Utah, United States
Is Airbnb profitable in Santa Clara in 2026? Explore comprehensive Airbnb analytics for Santa Clara, Utah, United States to uncover income potential. This 2026 STR market report for Santa Clara, based on AirROI data from February 2025 to January 2026, reveals key trends in the market of 279 active listings.
Whether you're considering an Airbnb investment in Santa Clara, optimizing your existing vacation rental, or exploring rental arbitrage opportunities, understanding the Santa Clara Airbnb data is crucial. Leveraging the low regulation environment is key to maximizing your short term rental income potential. Let's dive into the specifics.
Key Santa Clara Airbnb Performance Metrics Overview
Monthly Airbnb Revenue Variations & Income Potential in Santa Clara (2026)
Understanding the monthly revenue variations for Airbnb listings in Santa Clara is key to maximizing your short term rental income potential. Seasonality significantly impacts earnings. Our analysis, based on data from the past 12 months, shows that the peak revenue month for STRs in Santa Clara is typically October, while January often presents the lowest earnings, highlighting opportunities for strategic pricing adjustments during shoulder and low seasons. Explore the typical Airbnb income in Santa Clara across different performance tiers:
- Best-in-class properties (Top 10%) achieve $8,772+ monthly, often utilizing dynamic pricing and superior guest experiences.
- Strong performing properties (Top 25%) earn $6,051 or more, indicating effective management and desirable locations/amenities.
- Typical properties (Median) generate around $3,750 per month, representing the average market performance.
- Entry-level properties (Bottom 25%) see earnings around $2,118, often with potential for optimization.
Average Monthly Airbnb Earnings Trend in Santa Clara
Santa Clara Airbnb Occupancy Rate Trends (2026)
Maximize your bookings by understanding the Santa Clara STR occupancy trends. Seasonal demand shifts significantly influence how often properties are booked. Typically, Aprilsees the highest demand (peak season occupancy), while January experiences the lowest (low season). Effective strategies, like adjusting minimum stays or offering promotions, can boost occupancy during slower periods. Here's how different property tiers perform in Santa Clara:
- Best-in-class properties (Top 10%) achieve 68%+ occupancy, indicating high desirability and potentially optimized availability.
- Strong performing properties (Top 25%) maintain 54% or higher occupancy, suggesting good market fit and guest satisfaction.
- Typical properties (Median) have an occupancy rate around 36%.
- Entry-level properties (Bottom 25%) average 20% occupancy, potentially facing higher vacancy.
Average Monthly Occupancy Rate Trend in Santa Clara
Average Daily Rate (ADR) Airbnb Trends in Santa Clara (2026)
Effective short term rental pricing strategy in Santa Clara involves understanding monthly ADR fluctuations. The Average Daily Rate (ADR) for Airbnb in Santa Clara typically peaks in October and dips lowest during February. Leveraging Airbnb dynamic pricing tools or strategies based on this seasonality can significantly boost revenue. Here's a look at the typical nightly rates achieved:
- Best-in-class properties (Top 10%) command rates of $680+ per night, often due to premium features or locations.
- Strong performing properties (Top 25%) achieve nightly rates of $525 or more.
- Typical properties (Median) charge around $361 per night.
- Entry-level properties (Bottom 25%) earn around $245 per night.
Average Daily Rate (ADR) Trend by Month in Santa Clara
Get Live Santa Clara Market Intelligence 👇

Explore Real-time Analytics
Airbnb Seasonality Analysis & Trends in Santa Clara (2026)
Peak Season (October, June, April)
- Revenue averages $5,926 per month
- Occupancy rates average 47.3%
- Daily rates average $449
Shoulder Season
- Revenue averages $4,736 per month
- Occupancy maintains around 37.9%
- Daily rates hold near $422
Low Season (January, February, December)
- Revenue drops to average $3,393 per month
- Occupancy decreases to average 28.5%
- Daily rates adjust to average $428
Seasonality Insights for Santa Clara
- The Airbnb seasonality in Santa Clara shows moderate seasonality with distinct peak and low periods. While the sections above show seasonal averages, it's also insightful to look at the extremes:
- During the high season, the absolute peak month showcases Santa Clara's highest earning potential, with monthly revenues capable of climbing to $6,352, occupancy reaching a high of 51.4%, and ADRs peaking at $507.
- Conversely, the slowest single month of the year, typically falling within the low season, marks the market's lowest point. In this month, revenue might dip to $3,067, occupancy could drop to 23.0%, and ADRs may adjust down to $374.
- Understanding both the seasonal averages and these monthly peaks and troughs in revenue, occupancy, and ADR is crucial for maximizing your Airbnb profit potential in Santa Clara.
Seasonal Strategies for Maximizing Profit
- Peak Season: Maximize revenue through premium pricing and potentially longer minimum stays. Ensure high availability.
- Low Season: Offer competitive pricing, special promotions (e.g., extended stay discounts), and flexible cancellation policies. Target off-season travelers like remote workers or budget-conscious guests.
- Shoulder Seasons: Implement dynamic pricing that balances peak and low rates. Target weekend travelers or specific events. Offer slightly more flexible terms than peak season.
- Regularly analyze your own performance against these Santa Clara seasonality benchmarks and adjust your pricing and availability strategy accordingly.
Best Areas for Airbnb Investment in Santa Clara (2026)
Exploring the top neighborhoods for short-term rentals in Santa Clara? This section highlights key areas, outlining why they are attractive for hosts and guests, along with notable local attractions. Consider these locations based on your target guest profile and investment strategy.
| Neighborhood / Area | Why Host Here? (Target Guests & Appeal) | Key Attractions & Landmarks |
|---|---|---|
| Zion National Park | Proximity to one of the most visited national parks in the United States makes this area a significant attraction for nature lovers and hikers. Ideal for outdoor enthusiasts looking to explore stunning landscapes and adventure activities. | Angels Landing, The Narrows, Zion Canyon Scenic Drive, Zion Nature Center, Canyon Overlook Trail |
| Snow Canyon State Park | A beautiful state park known for its stunning red rock formations and lush desert landscape. Great for travelers interested in outdoor activities such as hiking, biking, and photography. | Snow Canyon Hiking Trails, Petroglyphs, Sand Dunes, St. George's Historic District, Petrified Dunes |
| St. George | The largest city in the region, St. George offers a mix of outdoor activities, shopping, and cultural experiences. A central hub for tourists visiting southern Utah. | St. George Historic District, Red Cliffs Desert Reserve, Tuacahn Amphitheatre, St. George Dinosaur Discovery Site |
| Bear Lake | Known for its stunning turquoise waters, Bear Lake is a prime location for summer vacations, watersports, and family gatherings. It attracts beachgoers and nature lovers alike. | Bear Lake State Park, Raspberry Days Festival, Garden City, Bear Lake Marina, Ideal Beach Resort |
| Lake Powell | A famous reservoir known for its stunning sapphire waters and thousands of side canyons. Offers opportunities for boating, fishing, and exploring unique geological formations. | Antelope Canyon, Horseshoe Bend, Rainbow Bridge, Lake Powell Resort, Glen Canyon Dam |
| Hurricane | Close to both Zion National Park and Sand Hollow State Park, making it a convenient location for those who want to explore these attractions while enjoying a quieter community. | Sand Hollow State Park, Hurricane Mountain, Hurricane Valley, Golf Courses, Local Shops & Restaurants |
| Washington | A growing city with easy access to outdoor recreation and local amenities. Offers a family-friendly atmosphere and is near major attractions in the area. | Green Springs Golf Course, Local Parks, Pine View Reservoir, Concerts in the Park, Nearby Dining |
| Toquerville | A tranquil area near Zion National Park, perfect for those seeking a peaceful getaway. Offers beautiful views and outdoor activities such as hiking and biking. | Toquerville Falls, Nearby Zion National Park, Scenic Viewpoints, Local Hiking Trails, Access to ATV Trails |
Understanding Airbnb License Requirements & STR Laws in Santa Clara (2026)
While Santa Clara, Utah, United States currently shows low STR regulations, specific Airbnb license requirements might still exist or change. Always verify the latest short term rental regulations and Airbnb license requirements directly with local government authorities for Santa Clara to ensure full compliance before hosting.
(Source: AirROI data, 2026, based on 0% licensed listings)
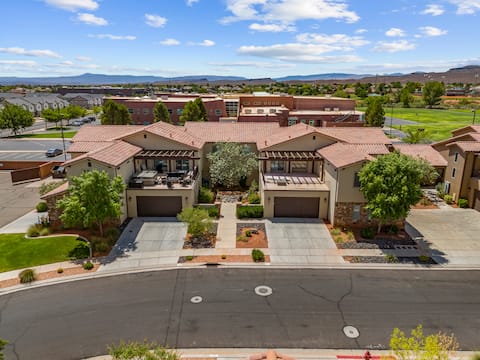
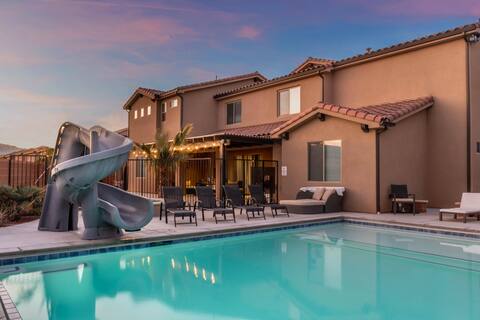
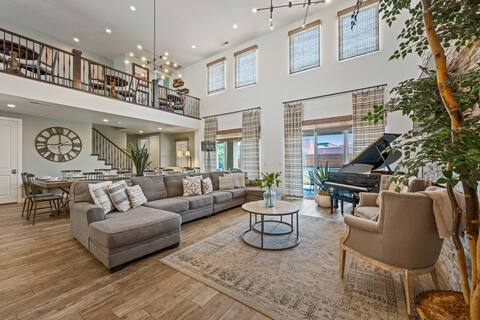
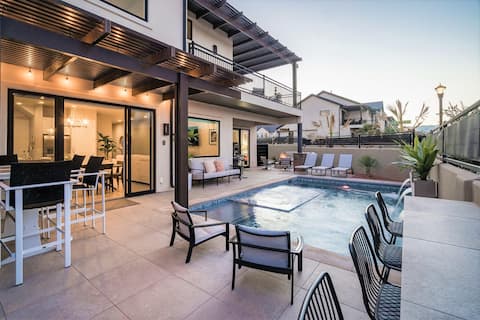
Top Performing Airbnb Properties in Santa Clara (2026)
Benchmark your potential! Explore examples of top-performing Airbnb properties in Santa Clarabased on Trailing Twelve Month (TTM) revenue. Analyze their characteristics, revenue, occupancy rate, and ADR to understand what drives success in this market.
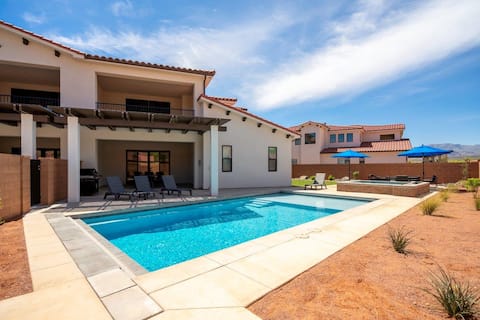
Grand Elite Retreat: 2 Side by Side Homes
Entire Place • 16 bedrooms
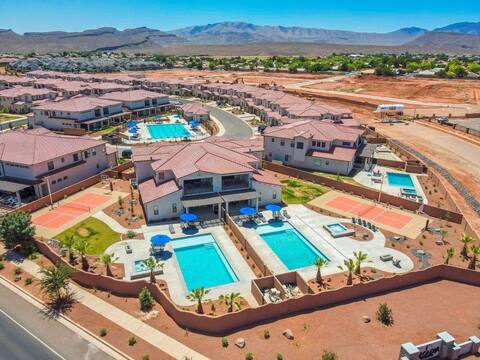
PVZ 98| Sleeps 43 * Pool & Hot Tub! * Sports Court
Entire Place • 9 bedrooms
Elite Retreat #87: Private Pool + Waterpark
Entire Place • 7 bedrooms
30-31| 2 large homes * Sleeps 50! * Private Pools
Entire Place • 10 bedrooms
Two Pools, Hot Tubs, Arcades, Pool Tables, Sleeps
Entire Place • 10 bedrooms
Arcadia 68/69 | Two Private Pools + Two Private
Entire Place • 10 bedrooms
Note: Performance varies based on location, size, amenities, seasonality, and management quality. Data reflects the past 12 months.
Top Performing Airbnb Hosts in Santa Clara (2026)
Learn from the best! This table showcases top-performing Airbnb hosts in Santa Clara based on the number of properties managed and estimated total revenue over the past year. Analyze their scale and performance metrics.
| Host Name | Properties | Grossing Revenue | Stay Reviews | Avg Rating |
|---|---|---|---|---|
| Red Sands | 47 | $2,386,726 | 1273 | 4.85/5.0 |
| Arcadia Resort | 60 | $2,361,339 | 277 | 4.90/5.0 |
| Red Rock | 36 | $2,261,190 | 460 | 4.87/5.0 |
| Utahs Best Vacation Rentals | 27 | $2,009,970 | 619 | 4.74/5.0 |
| Jake | 5 | $206,040 | 123 | 4.93/5.0 |
| Stephanie | 1 | $151,025 | 14 | 4.86/5.0 |
| May And Don | 3 | $97,916 | 225 | 4.90/5.0 |
| Dana Holladay | 1 | $94,502 | 468 | 4.96/5.0 |
| Bonnie | 1 | $94,085 | 118 | 5.00/5.0 |
| Mandi | 1 | $90,786 | 30 | 4.93/5.0 |
Analyzing the strategies of top hosts, such as their property selection, pricing, and guest communication, can offer valuable lessons for optimizing your own Airbnb operations in Santa Clara.
Dive Deeper: Advanced Santa Clara STR Market Data (2026)
Ready to unlock more insights? AirROI provides access to advanced metrics and comprehensive Airbnb data for Santa Clara. Explore detailed analytics beyond this report to refine your investment strategy, optimize pricing, and maximize your vacation rental profits.
Explore Advanced MetricsSanta Clara Short-Term Rental Market Composition (2026): Property & Room Types
Room Type Distribution
Property Type Distribution
Market Composition Insights for Santa Clara
- The Santa Clara Airbnb market composition is heavily skewed towards Entire Home/Apt listings, which make up 95.7% of the 279 active rentals. This indicates strong guest preference for privacy and space.
- Looking at the property type distribution in Santa Clara, House properties are the most common (93.5%), reflecting the local real estate landscape.
- Houses represent a significant 93.5% portion, catering likely to families or larger groups.
- Smaller segments like apartment/condo (combined 1.4%) offer potential for unique stay experiences.
Santa Clara Airbnb Room Capacity Analysis (2026): Bedroom Distribution
Distribution of Listings by Number of Bedrooms
Room Capacity Insights for Santa Clara
- The dominant room capacity in Santa Clara is 5+ bedrooms listings, making up 52% of the market. This suggests a strong demand for properties suitable for families or small groups.
- Together, 5+ bedrooms and 3 bedrooms properties represent 78.9% of the active Airbnb listings in Santa Clara, indicating a high concentration in these sizes.
- A significant 91.4% of listings offer 3+ bedrooms, catering to larger groups and families seeking more space in Santa Clara.
Santa Clara Vacation Rental Guest Capacity Trends (2026)
Distribution of Listings by Guest Capacity
Guest Capacity Insights for Santa Clara
- The most common guest capacity trend in Santa Clara vacation rentals is listings accommodating 8+ guests (89.6%). This suggests the primary traveler segment is likely larger groups.
- Properties designed for 8+ guests and 4 guests dominate the Santa Clara STR market, accounting for 93.2% of listings.
- 92.5% of properties accommodate 6+ guests, serving the market segment for larger families or group travel in Santa Clara.
- On average, properties in Santa Clara are equipped to host 7.6 guests.
Santa Clara Airbnb Booking Patterns (2026): Available vs. Booked Days
Available Days Distribution
Booked Days Distribution
Booking Pattern Insights for Santa Clara
- The most common availability pattern in Santa Clara falls within the 181-270 days range, representing 43.4% of listings. This suggests many properties have significant open periods on their calendars.
- Approximately 85.7% of listings show high availability (181+ days open annually), indicating potential for increased bookings or specific owner usage patterns.
- For booked days, the 91-180 days range is most frequent in Santa Clara (45.2%), reflecting common guest stay durations or potential owner blocking patterns.
- A notable 14.7% of properties secure long booking periods (181+ days booked per year), highlighting successful long-term rental strategies or significant owner usage.
Santa Clara Airbnb Minimum Stay Requirements Analysis
Distribution of Listings by Minimum Night Requirement
1 Night
27 listings
9.7% of total
2 Nights
149 listings
53.4% of total
3 Nights
10 listings
3.6% of total
7-29 Nights
1 listings
0.4% of total
30+ Nights
92 listings
33% of total
Key Insights
- The most prevalent minimum stay requirement in Santa Clara is 2 Nights, adopted by 53.4% of listings. This highlights the market's preference for shorter, flexible bookings.
- A strong majority (63.1%) of the Santa Clara Airbnb data shows acceptance of very short stays (1-2 nights), indicating a dynamic, high-turnover market.
- A significant segment (33%) caters to monthly stays (30+ nights) in Santa Clara, pointing to opportunities in the extended-stay market.
Recommendations
- Align with the market by considering a 2 Nights minimum stay, as 53.4% of Santa Clara hosts use this setting.
- If feasible, allowing 1-night stays, especially midweek or during low season, could capture last-minute bookings, as only 9.7% currently do.
- A 2-night minimum appears standard (53.4%). Consider this for weekends or peak periods.
- Explore offering discounts for stays of 30+ nights to attract the 33% of the market seeking extended stays.
- Adjust minimum nights based on seasonality – potentially shorter during low season and longer during peak demand periods in Santa Clara.
Santa Clara Airbnb Cancellation Policy Trends Analysis (2026)
Super Strict 30 Days
33 listings
11.8% of total
Super Strict 60 Days
2 listings
0.7% of total
Limited
13 listings
4.7% of total
Flexible
24 listings
8.6% of total
Moderate
20 listings
7.2% of total
Firm
158 listings
56.6% of total
Strict
29 listings
10.4% of total
Cancellation Policy Insights for Santa Clara
- The prevailing Airbnb cancellation policy trend in Santa Clara is Firm, used by 56.6% of listings.
- A majority (67.0%) of hosts in Santa Clara utilize Firm or Strict policies, indicating a market where hosts prioritize booking security.
Recommendations for Hosts
- Consider adopting a Firm policy to align with the 56.6% market standard in Santa Clara.
- Using a Strict policy might deter some guests, as only 10.4% of listings use it. Evaluate if potential revenue protection outweighs possible lower booking rates.
- Regularly review your cancellation policy against competitors and market demand shifts in Santa Clara.
Santa Clara STR Booking Lead Time Analysis (2026)
Average Booking Lead Time by Month
Booking Lead Time Insights for Santa Clara
- The overall average booking lead time for vacation rentals in Santa Clara is 77 days.
- Guests book furthest in advance for stays during November (average 108 days), likely coinciding with peak travel demand or local events.
- The shortest booking windows occur for stays in January (average 47 days), indicating more last-minute travel plans during this time.
- Seasonally, Fall (95 days avg.) sees the longest lead times, while Winter (59 days avg.) has the shortest, reflecting typical travel planning cycles.
Recommendations for Hosts
- Use the overall average lead time (77 days) as a baseline for your pricing and availability strategy in Santa Clara.
- For November stays, consider implementing length-of-stay discounts or slightly higher rates for bookings made less than 108 days out to capitalize on advance planning.
- Target marketing efforts for the Fall season well in advance (at least 95 days) to capture early planners.
- Monitor your own booking lead times against these Santa Clara averages to identify opportunities for dynamic pricing adjustments.
Popular & Essential Airbnb Amenities in Santa Clara (2026)
Amenity Prevalence
Amenity Insights for Santa Clara
- Essential amenities in Santa Clara that guests expect include: Air conditioning, Free parking on premises, Wifi, Smoke alarm, TV, Heating, Washer, Essentials, Kitchen, Shampoo. Lacking these (any) could significantly impact bookings.
Recommendations for Hosts
- Ensure your listing includes all essential amenities for Santa Clara: Air conditioning, Free parking on premises, Wifi, Smoke alarm, TV, Heating, Washer, Essentials, Kitchen, Shampoo.
- Prioritize adding missing essentials: Smoke alarm, TV, Heating, Washer, Essentials, Kitchen, Shampoo.
- Highlight unique or less common amenities you offer (e.g., hot tub, dedicated workspace, EV charger) in your listing description and photos.
- Regularly check competitor amenities in Santa Clara to stay competitive.
Santa Clara Airbnb Guest Demographics & Profile Analysis (2026)
Guest Profile Summary for Santa Clara
- The typical guest profile for Airbnb in Santa Clara consists of primarily domestic travelers (98%), often arriving from nearby Salt Lake City, typically belonging to the Post-2000s (Gen Z/Alpha) group (50%), primarily speaking English or Spanish.
- Domestic travelers account for 97.8% of guests.
- Key international markets include United States (97.8%) and Canada (0.7%).
- Top languages spoken are English (72.5%) followed by Spanish (16.8%).
- A significant demographic segment is the Post-2000s (Gen Z/Alpha) group, representing 50% of guests.
Recommendations for Hosts
- Target domestic marketing efforts towards travelers from Salt Lake City and Las Vegas.
- Tailor amenities and listing descriptions to appeal to the dominant Post-2000s (Gen Z/Alpha) demographic (e.g., highlight fast WiFi, smart home features, local guides).
- Highlight unique local experiences or amenities relevant to the primary guest profile.
- Consider seasonal promotions aligned with peak travel times for key origin markets.
Nearby Short-Term Rental Market Comparison
How does the Santa Clara Airbnb market stack up against its neighbors? Compare key performance metrics like average monthly revenue, ADR, and occupancy rates in surrounding areas to understand the broader regional STR landscape.
| Market | Active Properties | Monthly Revenue | Daily Rate | Avg. Occupancy |
|---|---|---|---|---|
| Springdale | 135 | $5,417 | $457.31 | 46% |
| Rockville | 22 | $4,535 | $488.30 | 33% |
| Hurricane | 730 | $3,797 | $329.21 | 45% |
| Orderville | 256 | $3,275 | $321.28 | 38% |
| Alton | 45 | $3,237 | $279.82 | 45% |
| Washington | 727 | $3,087 | $298.55 | 40% |
| Virgin | 112 | $2,969 | $294.50 | 39% |
| La Verkin | 191 | $2,946 | $206.59 | 51% |
| Mesquite | 138 | $2,891 | $250.63 | 46% |
| Duck Creek Village | 237 | $2,869 | $293.13 | 36% |