Salt Lake City Airbnb Market Analysis 2026: Short Term Rental Data & Vacation Rental Statistics in Utah, United States
Is Airbnb profitable in Salt Lake City in 2026? Explore comprehensive Airbnb analytics for Salt Lake City, Utah, United States to uncover income potential. This 2026 STR market report for Salt Lake City, based on AirROI data from February 2025 to January 2026, reveals key trends in the bustling market of 1,752 active listings.
Whether you're considering an Airbnb investment in Salt Lake City, optimizing your existing vacation rental, or exploring rental arbitrage opportunities, understanding the Salt Lake City Airbnb data is crucial. Leveraging the low regulation environment is key to maximizing your short term rental income potential. Let's dive into the specifics.
Key Salt Lake City Airbnb Performance Metrics Overview
Monthly Airbnb Revenue Variations & Income Potential in Salt Lake City (2026)
Understanding the monthly revenue variations for Airbnb listings in Salt Lake City is key to maximizing your short term rental income potential. Seasonality significantly impacts earnings. Our analysis, based on data from the past 12 months, shows that the peak revenue month for STRs in Salt Lake City is typically March, while November often presents the lowest earnings, highlighting opportunities for strategic pricing adjustments during shoulder and low seasons. Explore the typical Airbnb income in Salt Lake City across different performance tiers:
- Best-in-class properties (Top 10%) achieve $5,212+ monthly, often utilizing dynamic pricing and superior guest experiences.
- Strong performing properties (Top 25%) earn $3,634 or more, indicating effective management and desirable locations/amenities.
- Typical properties (Median) generate around $2,394 per month, representing the average market performance.
- Entry-level properties (Bottom 25%) see earnings around $1,381, often with potential for optimization.
Average Monthly Airbnb Earnings Trend in Salt Lake City
Salt Lake City Airbnb Occupancy Rate Trends (2026)
Maximize your bookings by understanding the Salt Lake City STR occupancy trends. Seasonal demand shifts significantly influence how often properties are booked. Typically, Marchsees the highest demand (peak season occupancy), while January experiences the lowest (low season). Effective strategies, like adjusting minimum stays or offering promotions, can boost occupancy during slower periods. Here's how different property tiers perform in Salt Lake City:
- Best-in-class properties (Top 10%) achieve 86%+ occupancy, indicating high desirability and potentially optimized availability.
- Strong performing properties (Top 25%) maintain 75% or higher occupancy, suggesting good market fit and guest satisfaction.
- Typical properties (Median) have an occupancy rate around 57%.
- Entry-level properties (Bottom 25%) average 35% occupancy, potentially facing higher vacancy.
Average Monthly Occupancy Rate Trend in Salt Lake City
Average Daily Rate (ADR) Airbnb Trends in Salt Lake City (2026)
Effective short term rental pricing strategy in Salt Lake City involves understanding monthly ADR fluctuations. The Average Daily Rate (ADR) for Airbnb in Salt Lake City typically peaks in December and dips lowest during April. Leveraging Airbnb dynamic pricing tools or strategies based on this seasonality can significantly boost revenue. Here's a look at the typical nightly rates achieved:
- Best-in-class properties (Top 10%) command rates of $278+ per night, often due to premium features or locations.
- Strong performing properties (Top 25%) achieve nightly rates of $192 or more.
- Typical properties (Median) charge around $132 per night.
- Entry-level properties (Bottom 25%) earn around $95 per night.
Average Daily Rate (ADR) Trend by Month in Salt Lake City
Get Live Salt Lake City Market Intelligence 👇

Explore Real-time Analytics
Airbnb Seasonality Analysis & Trends in Salt Lake City (2026)
Peak Season (March, February, July)
- Revenue averages $3,181 per month
- Occupancy rates average 63.1%
- Daily rates average $156
Shoulder Season
- Revenue averages $2,799 per month
- Occupancy maintains around 53.7%
- Daily rates hold near $164
Low Season (January, April, November)
- Revenue drops to average $2,342 per month
- Occupancy decreases to average 47.1%
- Daily rates adjust to average $163
Seasonality Insights for Salt Lake City
- The Airbnb seasonality in Salt Lake City shows moderate seasonality with distinct peak and low periods. While the sections above show seasonal averages, it's also insightful to look at the extremes:
- During the high season, the absolute peak month showcases Salt Lake City's highest earning potential, with monthly revenues capable of climbing to $3,398, occupancy reaching a high of 67.5%, and ADRs peaking at $178.
- Conversely, the slowest single month of the year, typically falling within the low season, marks the market's lowest point. In this month, revenue might dip to $2,236, occupancy could drop to 42.7%, and ADRs may adjust down to $147.
- Understanding both the seasonal averages and these monthly peaks and troughs in revenue, occupancy, and ADR is crucial for maximizing your Airbnb profit potential in Salt Lake City.
Seasonal Strategies for Maximizing Profit
- Peak Season: Maximize revenue through premium pricing and potentially longer minimum stays. Ensure high availability.
- Low Season: Offer competitive pricing, special promotions (e.g., extended stay discounts), and flexible cancellation policies. Target off-season travelers like remote workers or budget-conscious guests.
- Shoulder Seasons: Implement dynamic pricing that balances peak and low rates. Target weekend travelers or specific events. Offer slightly more flexible terms than peak season.
- Regularly analyze your own performance against these Salt Lake City seasonality benchmarks and adjust your pricing and availability strategy accordingly.
Best Areas for Airbnb Investment in Salt Lake City (2026)
Exploring the top neighborhoods for short-term rentals in Salt Lake City? This section highlights key areas, outlining why they are attractive for hosts and guests, along with notable local attractions. Consider these locations based on your target guest profile and investment strategy.
| Neighborhood / Area | Why Host Here? (Target Guests & Appeal) | Key Attractions & Landmarks |
|---|---|---|
| Downtown Salt Lake City | Vibrant urban center with a mix of cultural attractions, dining, and nightlife. Perfect for guests looking to experience the city's dynamic lifestyle and accessibility to business districts. | Salt Lake City Public Library, The Leonardo Museum, City Creek Center, Vivint Arena, Salt Palace Convention Center |
| Sugar House | Hip and historic neighborhood known for its eclectic shops, dining options, and parks. Popular with younger crowds and families seeking a lively and inviting atmosphere. | Sugar House Park, Historic Sugar House Street, Shopping at The Shops at Sugar House Commons, Parks and green spaces, Trendy cafes and restaurants |
| Liberty Park | One of Salt Lake City's largest parks, ideal for families and outdoor enthusiasts. Close to the Natural History Museum and the Tracy Aviary, making it appealing for nature lovers. | Liberty Park, Natural History Museum of Utah, Tracy Aviary, Salt Lake City Cemetery, Outdoor picnic areas |
| University District | Home to the University of Utah, attracting students, faculty, and visitors. The area has a youthful vibe and offers numerous educational and recreational opportunities. | University of Utah, Hogle Zoo, Red Butte Garden, The Natural History Museum of Utah, Student-friendly eateries |
| Millcreek | A suburban neighborhood with quick access to outdoor activities in the surrounding mountains. Great for guests interested in hiking and skiing, with a family-friendly atmosphere. | Millcreek Canyon, Local hiking trails, Parks and recreation areas, Proximity to ski resorts, Community events |
| Eagle Mountain | Growing area known for its affordability and family atmosphere. Attracting families and those seeking a quieter lifestyle while still having access to Salt Lake City amenities. | Nearby state parks, Outdoor recreational activities, Community parks, Family-friendly shopping and dining |
| Cottonwood Heights | Offers scenic mountain views and is close to ski resorts, making it an attractive option for winter sports enthusiasts and those looking for a retreat near nature. | Big Cottonwood Canyon, Ski resorts, Hiking trails, Parks and recreation, Community events |
| West Valley City | A large suburb of Salt Lake City with diverse attractions, restaurants, and parks. Ideal for guests who want a local experience away from the city hustle. | RSL Soccer Stadium, The Utah Cultural Celebration Center, West Valley City Parks, Diverse dining options, Shopping centers |
Understanding Airbnb License Requirements & STR Laws in Salt Lake City (2026)
While Salt Lake City, Utah, United States currently shows low STR regulations, specific Airbnb license requirements might still exist or change. Always verify the latest short term rental regulations and Airbnb license requirements directly with local government authorities for Salt Lake City to ensure full compliance before hosting.
(Source: AirROI data, 2026, based on 0% licensed listings)
Top Performing Airbnb Properties in Salt Lake City (2026)
Benchmark your potential! Explore examples of top-performing Airbnb properties in Salt Lake Citybased on Trailing Twelve Month (TTM) revenue. Analyze their characteristics, revenue, occupancy rate, and ADR to understand what drives success in this market.

Beautiful Tudor on Yalecrest, Hot Tub, University
Entire Place • 5 bedrooms
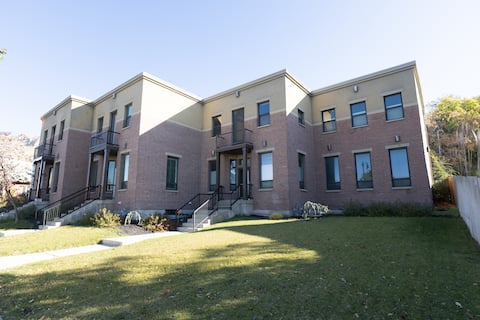
Two Spacious Row Homes Near Downtown SLC!
Entire Place • 7 bedrooms
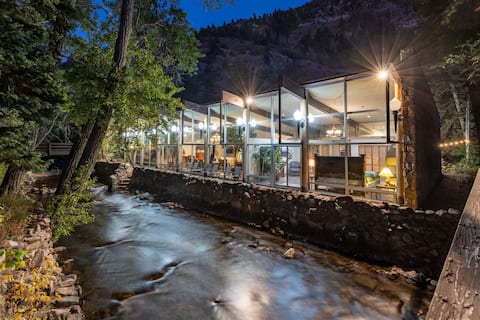
Historic Lodge located on Big Cottonwood River.
Entire Place • 4 bedrooms
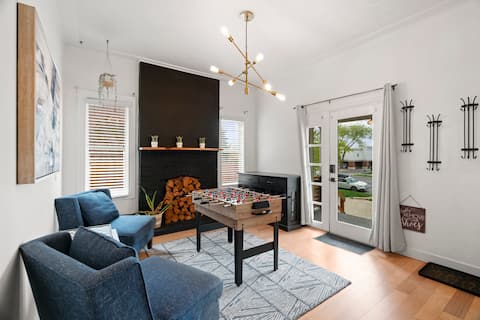
Timeless & Timber | 5B/5b, Fire Pit, Yard * Dogs *
Entire Place • 5 bedrooms
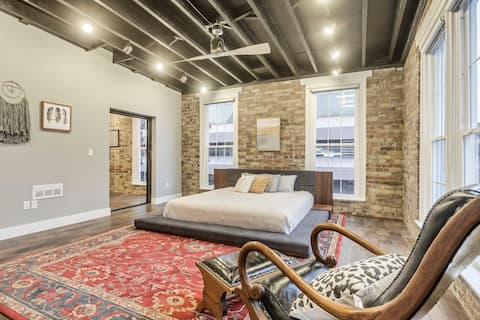
SLC Penthouse near Convention Center & downtown
Entire Place • 5 bedrooms
Modern Mountain City Retreat
Entire Place • 5 bedrooms
Note: Performance varies based on location, size, amenities, seasonality, and management quality. Data reflects the past 12 months.
Top Performing Airbnb Hosts in Salt Lake City (2026)
Learn from the best! This table showcases top-performing Airbnb hosts in Salt Lake City based on the number of properties managed and estimated total revenue over the past year. Analyze their scale and performance metrics.
| Host Name | Properties | Grossing Revenue | Stay Reviews | Avg Rating |
|---|---|---|---|---|
| GrandRoad | 68 | $2,876,323 | 4937 | 4.94/5.0 |
| Robert | 24 | $1,034,840 | 2562 | 4.90/5.0 |
| Mariah & Hailie | 21 | $651,137 | 1858 | 4.83/5.0 |
| Bentley | 16 | $596,387 | 605 | 4.76/5.0 |
| Airdream | 26 | $519,153 | 1803 | 4.87/5.0 |
| Courtney | 8 | $510,953 | 1650 | 4.80/5.0 |
| Lake City | 11 | $479,275 | 1493 | 4.85/5.0 |
| Mariah & Hailie | 10 | $413,993 | 556 | 4.83/5.0 |
| NYC Stays | 9 | $408,513 | 843 | 4.83/5.0 |
| Conmigo Vacation Rentals | 10 | $402,507 | 577 | 4.73/5.0 |
Analyzing the strategies of top hosts, such as their property selection, pricing, and guest communication, can offer valuable lessons for optimizing your own Airbnb operations in Salt Lake City.
Dive Deeper: Advanced Salt Lake City STR Market Data (2026)
Ready to unlock more insights? AirROI provides access to advanced metrics and comprehensive Airbnb data for Salt Lake City. Explore detailed analytics beyond this report to refine your investment strategy, optimize pricing, and maximize your vacation rental profits.
Explore Advanced MetricsSalt Lake City Short-Term Rental Market Composition (2026): Property & Room Types
Room Type Distribution
Property Type Distribution
Market Composition Insights for Salt Lake City
- The Salt Lake City Airbnb market composition is heavily skewed towards Entire Home/Apt listings, which make up 90.4% of the 1,752 active rentals. This indicates strong guest preference for privacy and space.
- Looking at the property type distribution in Salt Lake City, Apartment/Condo properties are the most common (45.7%), reflecting the local real estate landscape.
- Houses represent a significant 44.2% portion, catering likely to families or larger groups.
- Smaller segments like others, hotel/boutique, outdoor/unique, unique stays (combined 10.2%) offer potential for unique stay experiences.
Salt Lake City Airbnb Room Capacity Analysis (2026): Bedroom Distribution
Distribution of Listings by Number of Bedrooms
Room Capacity Insights for Salt Lake City
- The dominant room capacity in Salt Lake City is 1 bedroom listings, making up 38.5% of the market. This suggests a strong demand for properties suitable for couples or solo travelers.
- Together, 1 bedroom and 2 bedrooms properties represent 65.3% of the active Airbnb listings in Salt Lake City, indicating a high concentration in these sizes.
- A significant 21.9% of listings offer 3+ bedrooms, catering to larger groups and families seeking more space in Salt Lake City.
Salt Lake City Vacation Rental Guest Capacity Trends (2026)
Distribution of Listings by Guest Capacity
Guest Capacity Insights for Salt Lake City
- The most common guest capacity trend in Salt Lake City vacation rentals is listings accommodating 4 guests (25.7%). This suggests the primary traveler segment is likely small families or groups.
- Properties designed for 4 guests and 2 guests dominate the Salt Lake City STR market, accounting for 46.0% of listings.
- 28.3% of properties accommodate 6+ guests, serving the market segment for larger families or group travel in Salt Lake City.
- On average, properties in Salt Lake City are equipped to host 4.1 guests.
Salt Lake City Airbnb Booking Patterns (2026): Available vs. Booked Days
Available Days Distribution
Booked Days Distribution
Booking Pattern Insights for Salt Lake City
- The most common availability pattern in Salt Lake City falls within the 181-270 days range, representing 32.8% of listings. This suggests many properties have significant open periods on their calendars.
- Approximately 61.5% of listings show high availability (181+ days open annually), indicating potential for increased bookings or specific owner usage patterns.
- For booked days, the 91-180 days range is most frequent in Salt Lake City (32.7%), reflecting common guest stay durations or potential owner blocking patterns.
- A notable 39.9% of properties secure long booking periods (181+ days booked per year), highlighting successful long-term rental strategies or significant owner usage.
Salt Lake City Airbnb Minimum Stay Requirements Analysis
Distribution of Listings by Minimum Night Requirement
1 Night
463 listings
26.4% of total
2 Nights
258 listings
14.7% of total
3 Nights
102 listings
5.8% of total
4-6 Nights
86 listings
4.9% of total
7-29 Nights
230 listings
13.1% of total
30+ Nights
612 listings
35% of total
Key Insights
- The most prevalent minimum stay requirement in Salt Lake City is 30+ Nights, adopted by 35% of listings. This highlights the market's preference for longer commitments.
- A significant segment (35%) caters to monthly stays (30+ nights) in Salt Lake City, pointing to opportunities in the extended-stay market.
Recommendations
- Align with the market by considering a 30+ Nights minimum stay, as 35% of Salt Lake City hosts use this setting.
- If feasible, allowing 1-night stays, especially midweek or during low season, could capture last-minute bookings, as only 26.4% currently do.
- Explore offering discounts for stays of 30+ nights to attract the 35% of the market seeking extended stays.
- Adjust minimum nights based on seasonality – potentially shorter during low season and longer during peak demand periods in Salt Lake City.
Salt Lake City Airbnb Cancellation Policy Trends Analysis (2026)
Limited
61 listings
3.5% of total
Super Strict 30 Days
18 listings
1% of total
Super Strict 60 Days
37 listings
2.1% of total
Flexible
357 listings
20.4% of total
Moderate
432 listings
24.7% of total
Firm
613 listings
35% of total
Strict
231 listings
13.2% of total
Cancellation Policy Insights for Salt Lake City
- The prevailing Airbnb cancellation policy trend in Salt Lake City is Firm, used by 35% of listings.
- There's a relatively balanced mix between guest-friendly (45.1%) and stricter (48.2%) policies, offering choices for different guest needs.
Recommendations for Hosts
- Consider adopting a Firm policy to align with the 35% market standard in Salt Lake City.
- Using a Strict policy might deter some guests, as only 13.2% of listings use it. Evaluate if potential revenue protection outweighs possible lower booking rates.
- Regularly review your cancellation policy against competitors and market demand shifts in Salt Lake City.
Salt Lake City STR Booking Lead Time Analysis (2026)
Average Booking Lead Time by Month
Booking Lead Time Insights for Salt Lake City
- The overall average booking lead time for vacation rentals in Salt Lake City is 40 days.
- Guests book furthest in advance for stays during May (average 51 days), likely coinciding with peak travel demand or local events.
- The shortest booking windows occur for stays in November (average 32 days), indicating more last-minute travel plans during this time.
- Seasonally, Spring (45 days avg.) sees the longest lead times, while Summer (36 days avg.) has the shortest, reflecting typical travel planning cycles.
Recommendations for Hosts
- Use the overall average lead time (40 days) as a baseline for your pricing and availability strategy in Salt Lake City.
- For May stays, consider implementing length-of-stay discounts or slightly higher rates for bookings made less than 51 days out to capitalize on advance planning.
- Target marketing efforts for the Spring season well in advance (at least 45 days) to capture early planners.
- Monitor your own booking lead times against these Salt Lake City averages to identify opportunities for dynamic pricing adjustments.
Popular & Essential Airbnb Amenities in Salt Lake City (2026)
Amenity Prevalence
Amenity Insights for Salt Lake City
- Essential amenities in Salt Lake City that guests expect include: Wifi, Smoke alarm, Heating, Air conditioning, Kitchen, TV. Lacking these (any) could significantly impact bookings.
- Popular amenities like Hot water, Dishes and silverware, Refrigerator are common but not universal. Offering these can provide a competitive edge.
Recommendations for Hosts
- Ensure your listing includes all essential amenities for Salt Lake City: Wifi, Smoke alarm, Heating, Air conditioning, Kitchen, TV.
- Prioritize adding missing essentials: Wifi, Smoke alarm, Heating, Air conditioning, Kitchen, TV.
- Consider adding popular differentiators like Hot water or Dishes and silverware to increase appeal.
- Highlight unique or less common amenities you offer (e.g., hot tub, dedicated workspace, EV charger) in your listing description and photos.
- Regularly check competitor amenities in Salt Lake City to stay competitive.
Salt Lake City Airbnb Guest Demographics & Profile Analysis (2026)
Guest Profile Summary for Salt Lake City
- The typical guest profile for Airbnb in Salt Lake City consists of primarily domestic travelers (92%), often arriving from nearby Salt Lake City, typically belonging to the Post-2000s (Gen Z/Alpha) group (50%), primarily speaking English or Spanish.
- Domestic travelers account for 92.4% of guests.
- Key international markets include United States (92.4%) and Canada (1.3%).
- Top languages spoken are English (65.3%) followed by Spanish (14.1%).
- A significant demographic segment is the Post-2000s (Gen Z/Alpha) group, representing 50% of guests.
Recommendations for Hosts
- Target domestic marketing efforts towards travelers from Salt Lake City and New York.
- Tailor amenities and listing descriptions to appeal to the dominant Post-2000s (Gen Z/Alpha) demographic (e.g., highlight fast WiFi, smart home features, local guides).
- Highlight unique local experiences or amenities relevant to the primary guest profile.
- Consider seasonal promotions aligned with peak travel times for key origin markets.
Nearby Short-Term Rental Market Comparison
How does the Salt Lake City Airbnb market stack up against its neighbors? Compare key performance metrics like average monthly revenue, ADR, and occupancy rates in surrounding areas to understand the broader regional STR landscape.
| Market | Active Properties | Monthly Revenue | Daily Rate | Avg. Occupancy |
|---|---|---|---|---|
| Sundance | 61 | $6,552 | $867.92 | 33% |
| Alta | 44 | $5,993 | $971.20 | 39% |
| Daniel | 25 | $5,231 | $693.40 | 34% |
| Brighton | 151 | $4,367 | $557.15 | 37% |
| Oakley | 12 | $4,163 | $875.37 | 32% |
| Park City | 4,036 | $4,087 | $626.69 | 34% |
| Coalville | 36 | $3,711 | $440.00 | 33% |
| Mapleton | 11 | $3,385 | $365.91 | 41% |
| Heber City | 220 | $3,287 | $497.35 | 34% |
| Hideout | 105 | $3,209 | $453.17 | 35% |