Saint George Airbnb Market Analysis 2026: Short Term Rental Data & Vacation Rental Statistics in Utah, United States
Is Airbnb profitable in Saint George in 2026? Explore comprehensive Airbnb analytics for Saint George, Utah, United States to uncover income potential. This 2026 STR market report for Saint George, based on AirROI data from February 2025 to January 2026, reveals key trends in the bustling market of 1,052 active listings.
Whether you're considering an Airbnb investment in Saint George, optimizing your existing vacation rental, or exploring rental arbitrage opportunities, understanding the Saint George Airbnb data is crucial. Leveraging the low regulation environment is key to maximizing your short term rental income potential. Let's dive into the specifics.
Key Saint George Airbnb Performance Metrics Overview
Monthly Airbnb Revenue Variations & Income Potential in Saint George (2026)
Understanding the monthly revenue variations for Airbnb listings in Saint George is key to maximizing your short term rental income potential. Seasonality significantly impacts earnings. Our analysis, based on data from the past 12 months, shows that the peak revenue month for STRs in Saint George is typically October, while January often presents the lowest earnings, highlighting opportunities for strategic pricing adjustments during shoulder and low seasons. Explore the typical Airbnb income in Saint George across different performance tiers:
- Best-in-class properties (Top 10%) achieve $6,490+ monthly, often utilizing dynamic pricing and superior guest experiences.
- Strong performing properties (Top 25%) earn $3,777 or more, indicating effective management and desirable locations/amenities.
- Typical properties (Median) generate around $2,425 per month, representing the average market performance.
- Entry-level properties (Bottom 25%) see earnings around $1,497, often with potential for optimization.
Average Monthly Airbnb Earnings Trend in Saint George
Saint George Airbnb Occupancy Rate Trends (2026)
Maximize your bookings by understanding the Saint George STR occupancy trends. Seasonal demand shifts significantly influence how often properties are booked. Typically, Marchsees the highest demand (peak season occupancy), while January experiences the lowest (low season). Effective strategies, like adjusting minimum stays or offering promotions, can boost occupancy during slower periods. Here's how different property tiers perform in Saint George:
- Best-in-class properties (Top 10%) achieve 73%+ occupancy, indicating high desirability and potentially optimized availability.
- Strong performing properties (Top 25%) maintain 58% or higher occupancy, suggesting good market fit and guest satisfaction.
- Typical properties (Median) have an occupancy rate around 41%.
- Entry-level properties (Bottom 25%) average 23% occupancy, potentially facing higher vacancy.
Average Monthly Occupancy Rate Trend in Saint George
Average Daily Rate (ADR) Airbnb Trends in Saint George (2026)
Effective short term rental pricing strategy in Saint George involves understanding monthly ADR fluctuations. The Average Daily Rate (ADR) for Airbnb in Saint George typically peaks in October and dips lowest during August. Leveraging Airbnb dynamic pricing tools or strategies based on this seasonality can significantly boost revenue. Here's a look at the typical nightly rates achieved:
- Best-in-class properties (Top 10%) command rates of $514+ per night, often due to premium features or locations.
- Strong performing properties (Top 25%) achieve nightly rates of $317 or more.
- Typical properties (Median) charge around $212 per night.
- Entry-level properties (Bottom 25%) earn around $139 per night.
Average Daily Rate (ADR) Trend by Month in Saint George
Get Live Saint George Market Intelligence 👇

Explore Real-time Analytics
Airbnb Seasonality Analysis & Trends in Saint George (2026)
Peak Season (October, March, April)
- Revenue averages $4,380 per month
- Occupancy rates average 52.9%
- Daily rates average $305
Shoulder Season
- Revenue averages $3,338 per month
- Occupancy maintains around 41.6%
- Daily rates hold near $275
Low Season (January, September, December)
- Revenue drops to average $2,505 per month
- Occupancy decreases to average 30.1%
- Daily rates adjust to average $292
Seasonality Insights for Saint George
- The Airbnb seasonality in Saint George shows moderate seasonality with distinct peak and low periods. While the sections above show seasonal averages, it's also insightful to look at the extremes:
- During the high season, the absolute peak month showcases Saint George's highest earning potential, with monthly revenues capable of climbing to $4,439, occupancy reaching a high of 54.9%, and ADRs peaking at $349.
- Conversely, the slowest single month of the year, typically falling within the low season, marks the market's lowest point. In this month, revenue might dip to $2,152, occupancy could drop to 27.7%, and ADRs may adjust down to $256.
- Understanding both the seasonal averages and these monthly peaks and troughs in revenue, occupancy, and ADR is crucial for maximizing your Airbnb profit potential in Saint George.
Seasonal Strategies for Maximizing Profit
- Peak Season: Maximize revenue through premium pricing and potentially longer minimum stays. Ensure high availability.
- Low Season: Offer competitive pricing, special promotions (e.g., extended stay discounts), and flexible cancellation policies. Target off-season travelers like remote workers or budget-conscious guests.
- Shoulder Seasons: Implement dynamic pricing that balances peak and low rates. Target weekend travelers or specific events. Offer slightly more flexible terms than peak season.
- Regularly analyze your own performance against these Saint George seasonality benchmarks and adjust your pricing and availability strategy accordingly.
Best Areas for Airbnb Investment in Saint George (2026)
Exploring the top neighborhoods for short-term rentals in Saint George? This section highlights key areas, outlining why they are attractive for hosts and guests, along with notable local attractions. Consider these locations based on your target guest profile and investment strategy.
| Neighborhood / Area | Why Host Here? (Target Guests & Appeal) | Key Attractions & Landmarks |
|---|---|---|
| Zion National Park | One of the most iconic national parks in the United States, known for its stunning red rock formations, canyoneering, and hiking trails. A prime location for nature lovers and outdoor enthusiasts. | Angels Landing, The Narrows, Zion Canyon Scenic Drive, Emerald Pools, Observation Point |
| Snow Canyon State Park | A beautiful state park featuring red rock cliffs, lava tubes, and diverse plant life. Attractive to outdoor recreation enthusiasts, including hikers and rock climbers. | Snow Canyon State Park trails, Lava Fields, Sand Dunes, Hidden Pinyon, St. George Musical Theatre |
| Downtown St. George | The historical and cultural heart of St. George, featuring local shops, restaurants, and events. Popular with tourists looking for local experiences and convenience. | St. George Utah Temple, Brigham Young Winter Home, Pioneer Park, St. George Art Museum, Historic downtown shopping |
| Santa Clara | A charming small town adjacent to St. George, known for its picturesque views and access to outdoor activities. Great for families and couples looking for a quieter stay. | Snow Canyon State Park access, Red Cliffs Desert Reserve, Local parks, Santa Clara River, Historic sights |
| Washington | A growing residential area with family-friendly activities and access to outdoor recreation. Ideal for travelers looking for a community-oriented vibe. | Historic Washington City, Sand Hollow State Park, Local golf courses, Pioneer Trails, Access to recreation areas |
| Hurricane | Located near Zion and other national parks, Hurricane is an affordable option for travelers to explore nearby attractions and enjoy outdoor activities. | Sand Hollow Reservoir, Zion National Park access, Hurricane Canal Trail, Local dining and shops, Sky Mountain Golf Course |
| Ivins | A small, scenic town just minutes from St. George, known for its arts community and beautiful natural surroundings, attracting creative individuals and peaceful retreat seekers. | Tuacahn Amphitheatre, Red Mountain, Art galleries, Kayenta Art Village, Ivins Reservoir |
| Golf Courses | St. George and surrounding areas boast numerous golf courses, making it popular among golf enthusiasts looking for a vacation destination that caters to their interests. | Coral Canyon Golf Club, Sky Mountain Golf Course, Dixie Red Hills Golf Club, Southgate Golf Club, St. George Golf Club |
Understanding Airbnb License Requirements & STR Laws in Saint George (2026)
While Saint George, Utah, United States currently shows low STR regulations, specific Airbnb license requirements might still exist or change. Always verify the latest short term rental regulations and Airbnb license requirements directly with local government authorities for Saint George to ensure full compliance before hosting.
(Source: AirROI data, 2026, finding no licensed listings among those analyzed)
Top Performing Airbnb Properties in Saint George (2026)
Benchmark your potential! Explore examples of top-performing Airbnb properties in Saint Georgebased on Trailing Twelve Month (TTM) revenue. Analyze their characteristics, revenue, occupancy rate, and ADR to understand what drives success in this market.
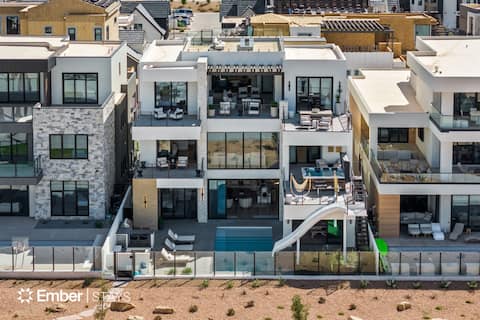
Paradise Palace at Desert Color (by Ember Stays)
Entire Place • 8 bedrooms

Deja Blue at Desert Color (by Ember Stays)
Entire Place • 8 bedrooms
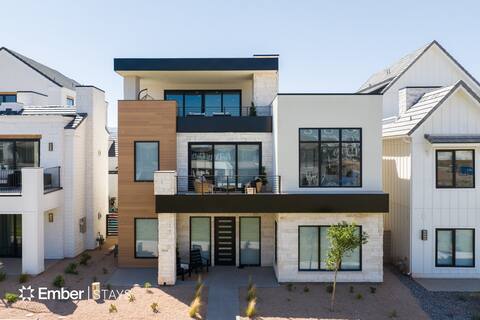
Desert Rey at Desert Color (by Ember Stays)
Entire Place • 8 bedrooms

Exclusive Pool Villa, Private Pool & Hot Tub!
Entire Place • 5 bedrooms

Modern Oasis at Desert Color (by Ember Stays)
Entire Place • 8 bedrooms

Playa Lucaya at Desert Color (by Ember Stays)
Entire Place • 8 bedrooms
Note: Performance varies based on location, size, amenities, seasonality, and management quality. Data reflects the past 12 months.
Top Performing Airbnb Hosts in Saint George (2026)
Learn from the best! This table showcases top-performing Airbnb hosts in Saint George based on the number of properties managed and estimated total revenue over the past year. Analyze their scale and performance metrics.
| Host Name | Properties | Grossing Revenue | Stay Reviews | Avg Rating |
|---|---|---|---|---|
| Red Rock | 194 | $10,042,884 | 1920 | 4.83/5.0 |
| Ember Stays | 25 | $3,891,027 | 399 | 4.96/5.0 |
| Ledges | 138 | $3,352,165 | 1190 | 4.90/5.0 |
| St George Rentals | 99 | $2,715,776 | 4420 | 4.75/5.0 |
| John | 27 | $557,304 | 2194 | 4.79/5.0 |
| May And Don | 17 | $441,569 | 1654 | 4.84/5.0 |
| St George Rentals | 12 | $391,484 | 848 | 4.79/5.0 |
| Red Sands | 18 | $338,563 | 416 | 4.72/5.0 |
| Freedom Vacation Rentals | 8 | $333,235 | 456 | 4.85/5.0 |
| Jason | 10 | $324,038 | 1800 | 4.78/5.0 |
Analyzing the strategies of top hosts, such as their property selection, pricing, and guest communication, can offer valuable lessons for optimizing your own Airbnb operations in Saint George.
Dive Deeper: Advanced Saint George STR Market Data (2026)
Ready to unlock more insights? AirROI provides access to advanced metrics and comprehensive Airbnb data for Saint George. Explore detailed analytics beyond this report to refine your investment strategy, optimize pricing, and maximize your vacation rental profits.
Explore Advanced MetricsSaint George Short-Term Rental Market Composition (2026): Property & Room Types
Room Type Distribution
Property Type Distribution
Market Composition Insights for Saint George
- The Saint George Airbnb market composition is heavily skewed towards Entire Home/Apt listings, which make up 96.1% of the 1,052 active rentals. This indicates strong guest preference for privacy and space.
- Looking at the property type distribution in Saint George, House properties are the most common (47.1%), reflecting the local real estate landscape.
- Houses represent a significant 47.1% portion, catering likely to families or larger groups.
- Smaller segments like hotel/boutique, others, outdoor/unique, unique stays (combined 5.8%) offer potential for unique stay experiences.
Saint George Airbnb Room Capacity Analysis (2026): Bedroom Distribution
Distribution of Listings by Number of Bedrooms
Room Capacity Insights for Saint George
- The dominant room capacity in Saint George is 3 bedrooms listings, making up 25% of the market. This suggests a strong demand for properties suitable for families or small groups.
- Together, 3 bedrooms and 2 bedrooms properties represent 45.2% of the active Airbnb listings in Saint George, indicating a high concentration in these sizes.
- A significant 58.8% of listings offer 3+ bedrooms, catering to larger groups and families seeking more space in Saint George.
Saint George Vacation Rental Guest Capacity Trends (2026)
Distribution of Listings by Guest Capacity
Guest Capacity Insights for Saint George
- The most common guest capacity trend in Saint George vacation rentals is listings accommodating 8+ guests (59.9%). This suggests the primary traveler segment is likely larger groups.
- Properties designed for 8+ guests and 4 guests dominate the Saint George STR market, accounting for 74.3% of listings.
- 76.6% of properties accommodate 6+ guests, serving the market segment for larger families or group travel in Saint George.
- On average, properties in Saint George are equipped to host 6.6 guests.
Saint George Airbnb Booking Patterns (2026): Available vs. Booked Days
Available Days Distribution
Booked Days Distribution
Booking Pattern Insights for Saint George
- The most common availability pattern in Saint George falls within the 181-270 days range, representing 41.3% of listings. This suggests many properties have significant open periods on their calendars.
- Approximately 78.4% of listings show high availability (181+ days open annually), indicating potential for increased bookings or specific owner usage patterns.
- For booked days, the 91-180 days range is most frequent in Saint George (41.9%), reflecting common guest stay durations or potential owner blocking patterns.
- A notable 22.7% of properties secure long booking periods (181+ days booked per year), highlighting successful long-term rental strategies or significant owner usage.
Saint George Airbnb Minimum Stay Requirements Analysis
Distribution of Listings by Minimum Night Requirement
1 Night
162 listings
15.4% of total
2 Nights
226 listings
21.5% of total
3 Nights
24 listings
2.3% of total
4-6 Nights
8 listings
0.8% of total
7-29 Nights
23 listings
2.2% of total
30+ Nights
608 listings
57.8% of total
Key Insights
- The most prevalent minimum stay requirement in Saint George is 30+ Nights, adopted by 57.8% of listings. This highlights the market's preference for longer commitments.
- A significant segment (57.8%) caters to monthly stays (30+ nights) in Saint George, pointing to opportunities in the extended-stay market.
Recommendations
- Align with the market by considering a 30+ Nights minimum stay, as 57.8% of Saint George hosts use this setting.
- If feasible, allowing 1-night stays, especially midweek or during low season, could capture last-minute bookings, as only 15.4% currently do.
- Explore offering discounts for stays of 30+ nights to attract the 57.8% of the market seeking extended stays.
- Adjust minimum nights based on seasonality – potentially shorter during low season and longer during peak demand periods in Saint George.
Saint George Airbnb Cancellation Policy Trends Analysis (2026)
Super Strict 60 Days
7 listings
0.7% of total
Limited
81 listings
7.7% of total
Super Strict 30 Days
156 listings
14.8% of total
Flexible
94 listings
8.9% of total
Moderate
321 listings
30.5% of total
Firm
332 listings
31.6% of total
Strict
60 listings
5.7% of total
Cancellation Policy Insights for Saint George
- The prevailing Airbnb cancellation policy trend in Saint George is Firm, used by 31.6% of listings.
- There's a relatively balanced mix between guest-friendly (39.4%) and stricter (37.3%) policies, offering choices for different guest needs.
- Strict cancellation policies are quite rare (5.7%), potentially making listings with this policy less competitive unless justified by high demand or property type.
Recommendations for Hosts
- Consider adopting a Firm policy to align with the 31.6% market standard in Saint George.
- Using a Strict policy might deter some guests, as only 5.7% of listings use it. Evaluate if potential revenue protection outweighs possible lower booking rates.
- Regularly review your cancellation policy against competitors and market demand shifts in Saint George.
Saint George STR Booking Lead Time Analysis (2026)
Average Booking Lead Time by Month
Booking Lead Time Insights for Saint George
- The overall average booking lead time for vacation rentals in Saint George is 60 days.
- Guests book furthest in advance for stays during October (average 88 days), likely coinciding with peak travel demand or local events.
- The shortest booking windows occur for stays in January (average 42 days), indicating more last-minute travel plans during this time.
- Seasonally, Fall (73 days avg.) sees the longest lead times, while Summer (49 days avg.) has the shortest, reflecting typical travel planning cycles.
Recommendations for Hosts
- Use the overall average lead time (60 days) as a baseline for your pricing and availability strategy in Saint George.
- For October stays, consider implementing length-of-stay discounts or slightly higher rates for bookings made less than 88 days out to capitalize on advance planning.
- Target marketing efforts for the Fall season well in advance (at least 73 days) to capture early planners.
- Monitor your own booking lead times against these Saint George averages to identify opportunities for dynamic pricing adjustments.
Popular & Essential Airbnb Amenities in Saint George (2026)
Amenity Prevalence
Amenity Insights for Saint George
- Essential amenities in Saint George that guests expect include: Air conditioning, Wifi, TV, Heating, Free parking on premises. Lacking these (any) could significantly impact bookings.
- Popular amenities like Washer, Kitchen, Essentials are common but not universal. Offering these can provide a competitive edge.
Recommendations for Hosts
- Ensure your listing includes all essential amenities for Saint George: Air conditioning, Wifi, TV, Heating, Free parking on premises.
- Prioritize adding missing essentials: Air conditioning, Wifi, TV, Heating, Free parking on premises.
- Consider adding popular differentiators like Washer or Kitchen to increase appeal.
- Highlight unique or less common amenities you offer (e.g., hot tub, dedicated workspace, EV charger) in your listing description and photos.
- Regularly check competitor amenities in Saint George to stay competitive.
Saint George Airbnb Guest Demographics & Profile Analysis (2026)
Guest Profile Summary for Saint George
- The typical guest profile for Airbnb in Saint George consists of primarily domestic travelers (97%), often arriving from nearby Salt Lake City, typically belonging to the Post-2000s (Gen Z/Alpha) group (50%), primarily speaking English or Spanish.
- Domestic travelers account for 96.5% of guests.
- Key international markets include United States (96.5%) and Canada (1.4%).
- Top languages spoken are English (70.3%) followed by Spanish (16.2%).
- A significant demographic segment is the Post-2000s (Gen Z/Alpha) group, representing 50% of guests.
Recommendations for Hosts
- Target domestic marketing efforts towards travelers from Salt Lake City and Las Vegas.
- Tailor amenities and listing descriptions to appeal to the dominant Post-2000s (Gen Z/Alpha) demographic (e.g., highlight fast WiFi, smart home features, local guides).
- Highlight unique local experiences or amenities relevant to the primary guest profile.
- Consider seasonal promotions aligned with peak travel times for key origin markets.
Nearby Short-Term Rental Market Comparison
How does the Saint George Airbnb market stack up against its neighbors? Compare key performance metrics like average monthly revenue, ADR, and occupancy rates in surrounding areas to understand the broader regional STR landscape.
| Market | Active Properties | Monthly Revenue | Daily Rate | Avg. Occupancy |
|---|---|---|---|---|
| Springdale | 135 | $5,417 | $457.31 | 46% |
| Rockville | 22 | $4,535 | $488.30 | 33% |
| Hurricane | 730 | $3,797 | $329.21 | 45% |
| Santa Clara | 279 | $3,789 | $427.47 | 36% |
| Orderville | 256 | $3,275 | $321.28 | 38% |
| Alton | 45 | $3,237 | $279.82 | 45% |
| Washington | 727 | $3,087 | $298.55 | 40% |
| Virgin | 112 | $2,969 | $294.50 | 39% |
| La Verkin | 191 | $2,946 | $206.59 | 51% |
| Mesquite | 138 | $2,891 | $250.63 | 46% |