North Salt Lake Airbnb Market Analysis 2026: Short Term Rental Data & Vacation Rental Statistics in Utah, United States
Is Airbnb profitable in North Salt Lake in 2026? Explore comprehensive Airbnb analytics for North Salt Lake, Utah, United States to uncover income potential. This 2026 STR market report for North Salt Lake, based on AirROI data from February 2025 to January 2026, reveals key trends in the niche market of 55 active listings.
Whether you're considering an Airbnb investment in North Salt Lake, optimizing your existing vacation rental, or exploring rental arbitrage opportunities, understanding the North Salt Lake Airbnb data is crucial. Leveraging the low regulation environment is key to maximizing your short term rental income potential. Let's dive into the specifics.
Key North Salt Lake Airbnb Performance Metrics Overview
Monthly Airbnb Revenue Variations & Income Potential in North Salt Lake (2026)
Understanding the monthly revenue variations for Airbnb listings in North Salt Lake is key to maximizing your short term rental income potential. Seasonality significantly impacts earnings. Our analysis, based on data from the past 12 months, shows that the peak revenue month for STRs in North Salt Lake is typically July, while April often presents the lowest earnings, highlighting opportunities for strategic pricing adjustments during shoulder and low seasons. Explore the typical Airbnb income in North Salt Lake across different performance tiers:
- Best-in-class properties (Top 10%) achieve $5,585+ monthly, often utilizing dynamic pricing and superior guest experiences.
- Strong performing properties (Top 25%) earn $3,379 or more, indicating effective management and desirable locations/amenities.
- Typical properties (Median) generate around $2,204 per month, representing the average market performance.
- Entry-level properties (Bottom 25%) see earnings around $1,247, often with potential for optimization.
Average Monthly Airbnb Earnings Trend in North Salt Lake
North Salt Lake Airbnb Occupancy Rate Trends (2026)
Maximize your bookings by understanding the North Salt Lake STR occupancy trends. Seasonal demand shifts significantly influence how often properties are booked. Typically, Julysees the highest demand (peak season occupancy), while January experiences the lowest (low season). Effective strategies, like adjusting minimum stays or offering promotions, can boost occupancy during slower periods. Here's how different property tiers perform in North Salt Lake:
- Best-in-class properties (Top 10%) achieve 83%+ occupancy, indicating high desirability and potentially optimized availability.
- Strong performing properties (Top 25%) maintain 69% or higher occupancy, suggesting good market fit and guest satisfaction.
- Typical properties (Median) have an occupancy rate around 50%.
- Entry-level properties (Bottom 25%) average 30% occupancy, potentially facing higher vacancy.
Average Monthly Occupancy Rate Trend in North Salt Lake
Average Daily Rate (ADR) Airbnb Trends in North Salt Lake (2026)
Effective short term rental pricing strategy in North Salt Lake involves understanding monthly ADR fluctuations. The Average Daily Rate (ADR) for Airbnb in North Salt Lake typically peaks in December and dips lowest during April. Leveraging Airbnb dynamic pricing tools or strategies based on this seasonality can significantly boost revenue. Here's a look at the typical nightly rates achieved:
- Best-in-class properties (Top 10%) command rates of $284+ per night, often due to premium features or locations.
- Strong performing properties (Top 25%) achieve nightly rates of $201 or more.
- Typical properties (Median) charge around $136 per night.
- Entry-level properties (Bottom 25%) earn around $94 per night.
Average Daily Rate (ADR) Trend by Month in North Salt Lake
Get Live North Salt Lake Market Intelligence 👇

Explore Real-time Analytics
Airbnb Seasonality Analysis & Trends in North Salt Lake (2026)
Peak Season (July, June, December)
- Revenue averages $3,187 per month
- Occupancy rates average 53.6%
- Daily rates average $178
Shoulder Season
- Revenue averages $2,742 per month
- Occupancy maintains around 50.6%
- Daily rates hold near $169
Low Season (January, April, May)
- Revenue drops to average $2,132 per month
- Occupancy decreases to average 43.5%
- Daily rates adjust to average $167
Seasonality Insights for North Salt Lake
- The Airbnb seasonality in North Salt Lake shows moderate seasonality with distinct peak and low periods. While the sections above show seasonal averages, it's also insightful to look at the extremes:
- During the high season, the absolute peak month showcases North Salt Lake's highest earning potential, with monthly revenues capable of climbing to $3,433, occupancy reaching a high of 63.9%, and ADRs peaking at $188.
- Conversely, the slowest single month of the year, typically falling within the low season, marks the market's lowest point. In this month, revenue might dip to $2,035, occupancy could drop to 32.8%, and ADRs may adjust down to $156.
- Understanding both the seasonal averages and these monthly peaks and troughs in revenue, occupancy, and ADR is crucial for maximizing your Airbnb profit potential in North Salt Lake.
Seasonal Strategies for Maximizing Profit
- Peak Season: Maximize revenue through premium pricing and potentially longer minimum stays. Ensure high availability.
- Low Season: Offer competitive pricing, special promotions (e.g., extended stay discounts), and flexible cancellation policies. Target off-season travelers like remote workers or budget-conscious guests.
- Shoulder Seasons: Implement dynamic pricing that balances peak and low rates. Target weekend travelers or specific events. Offer slightly more flexible terms than peak season.
- Regularly analyze your own performance against these North Salt Lake seasonality benchmarks and adjust your pricing and availability strategy accordingly.
Best Areas for Airbnb Investment in North Salt Lake (2026)
Exploring the top neighborhoods for short-term rentals in North Salt Lake? This section highlights key areas, outlining why they are attractive for hosts and guests, along with notable local attractions. Consider these locations based on your target guest profile and investment strategy.
| Neighborhood / Area | Why Host Here? (Target Guests & Appeal) | Key Attractions & Landmarks |
|---|---|---|
| Park City | Famous for its ski resorts and the Sundance Film Festival, Park City attracts visitors year-round for winter sports and summer activities. | Park City Mountain Resort, Deer Valley Resort, Historic Main Street, Sundance Film Festival, Utah Olympic Park |
| Salt Lake City Downtown | The heart of Utah's capital, offering a mix of cultural attractions, dining, and nightlife, making it appealing for both tourists and business travelers. | Temple Square, Utah Museum of Fine Arts, City Creek Center, Vivint Smart Home Arena, Salt Palace Convention Center |
| Antelope Island State Park | A unique natural attraction in the Great Salt Lake, popular for its wildlife and stunning views, it draws nature lovers and outdoor enthusiasts. | Antelope Island beaches, Buffalo sightings, Great Salt Lake views, Hiking trails, Bird watching |
| Sugar House | Known for its trendy shops, parks, and restaurants, Sugar House is a vibrant community that attracts visitors for both leisure and business. | Sugar House Park, Shopping district, The Millcreek Canyon, Historic architecture, Local breweries |
| Bondville | A small but growing area near attractions like ski resorts and hiking trails, Bondville is appealing for those looking for more rural Airbnb options. | Hiking trails, Ski resorts, Local farms, Biking paths, Peaceful scenery |
| Ogden | A city known for its outdoor recreation opportunities and close proximity to mountains and ski areas, appealing to both adventurers and families. | Ogden's Historic 25th Street, Snowbasin Resort, Ogden Botanical Gardens, Euclid Avenue, Biking and hiking trails |
| Layton | Located near Hill Air Force Base and outdoor recreation, Layton offers accessibility for business travelers and families visiting for leisure. | Hill Air Force Base, Antelope Island State Park, Layton Hills Mall, Local eateries, Recreation areas |
| Draper | A suburb of Salt Lake City with easy access to ski resorts and hiking trails, Draper is becoming increasingly popular for its family-friendly environment. | Draper Park, Mountain biking trails, Ski resorts nearby, The Loveland Living Planet Aquarium, Family-friendly activities |
Understanding Airbnb License Requirements & STR Laws in North Salt Lake (2026)
While North Salt Lake, Utah, United States currently shows low STR regulations, specific Airbnb license requirements might still exist or change. Always verify the latest short term rental regulations and Airbnb license requirements directly with local government authorities for North Salt Lake to ensure full compliance before hosting.
(Source: AirROI data, 2026, based on 2% licensed listings)
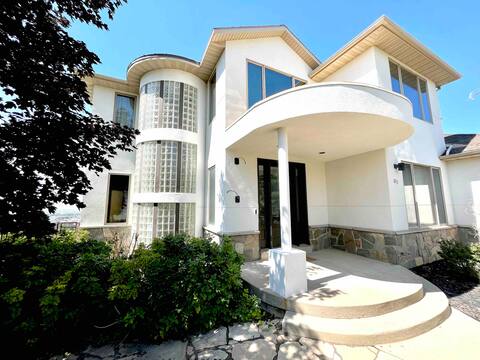
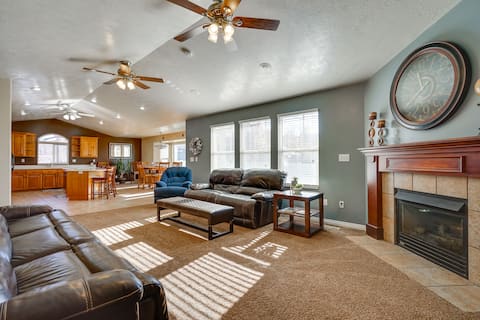
Top Performing Airbnb Properties in North Salt Lake (2026)
Benchmark your potential! Explore examples of top-performing Airbnb properties in North Salt Lakebased on Trailing Twelve Month (TTM) revenue. Analyze their characteristics, revenue, occupancy rate, and ADR to understand what drives success in this market.
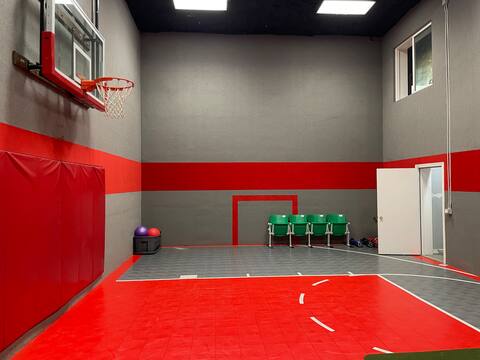
Sunsets! Indoor Sport Court, Pool Table, Hot Tub
Entire Place • 5 bedrooms

Ping pong, Arcade, Private yard w/ Mountain view!
Entire Place • 7 bedrooms
Holidays & Skiing with Mountain & Lake Views
Entire Place • 5 bedrooms

Eaglewood Golf Course area
Entire Place • 5 bedrooms

Utah Haven | 4-Bed | 12 mins to Airport/Downtown
Entire Place • 3 bedrooms
North Salt Lake Vacation Rental: 7 Mi to Downtown
Entire Place • 4 bedrooms
Note: Performance varies based on location, size, amenities, seasonality, and management quality. Data reflects the past 12 months.
Top Performing Airbnb Hosts in North Salt Lake (2026)
Learn from the best! This table showcases top-performing Airbnb hosts in North Salt Lake based on the number of properties managed and estimated total revenue over the past year. Analyze their scale and performance metrics.
| Host Name | Properties | Grossing Revenue | Stay Reviews | Avg Rating |
|---|---|---|---|---|
| Brigham | 9 | $240,740 | 252 | 4.69/5.0 |
| Ben | 1 | $98,793 | 46 | 4.96/5.0 |
| Rick | 1 | $91,649 | 71 | 4.92/5.0 |
| Evolve | 2 | $84,761 | 74 | 4.92/5.0 |
| Amy And Bryan | 1 | $80,466 | 219 | 4.85/5.0 |
| Sheila | 4 | $67,007 | 2111 | 4.94/5.0 |
| Chau | 1 | $64,413 | 73 | 4.90/5.0 |
| Whitney | 2 | $61,250 | 55 | 4.74/5.0 |
| Britney Christine | 1 | $59,791 | 212 | 4.90/5.0 |
| Nephi | 1 | $42,205 | 34 | 4.85/5.0 |
Analyzing the strategies of top hosts, such as their property selection, pricing, and guest communication, can offer valuable lessons for optimizing your own Airbnb operations in North Salt Lake.
Dive Deeper: Advanced North Salt Lake STR Market Data (2026)
Ready to unlock more insights? AirROI provides access to advanced metrics and comprehensive Airbnb data for North Salt Lake. Explore detailed analytics beyond this report to refine your investment strategy, optimize pricing, and maximize your vacation rental profits.
Explore Advanced MetricsNorth Salt Lake Short-Term Rental Market Composition (2026): Property & Room Types
Room Type Distribution
Property Type Distribution
Market Composition Insights for North Salt Lake
- The North Salt Lake Airbnb market composition is heavily skewed towards Entire Home/Apt listings, which make up 92.7% of the 55 active rentals. This indicates strong guest preference for privacy and space.
- Looking at the property type distribution in North Salt Lake, House properties are the most common (43.6%), reflecting the local real estate landscape.
- Houses represent a significant 43.6% portion, catering likely to families or larger groups.
- Smaller segments like hotel/boutique (combined 3.6%) offer potential for unique stay experiences.
North Salt Lake Airbnb Room Capacity Analysis (2026): Bedroom Distribution
Distribution of Listings by Number of Bedrooms
Room Capacity Insights for North Salt Lake
- The dominant room capacity in North Salt Lake is 2 bedrooms listings, making up 27.3% of the market. This suggests a strong demand for properties suitable for couples or solo travelers.
- Together, 2 bedrooms and 1 bedroom properties represent 49.1% of the active Airbnb listings in North Salt Lake, indicating a high concentration in these sizes.
- A significant 38.2% of listings offer 3+ bedrooms, catering to larger groups and families seeking more space in North Salt Lake.
North Salt Lake Vacation Rental Guest Capacity Trends (2026)
Distribution of Listings by Guest Capacity
Guest Capacity Insights for North Salt Lake
- The most common guest capacity trend in North Salt Lake vacation rentals is listings accommodating 8+ guests (25.5%). This suggests the primary traveler segment is likely larger groups.
- Properties designed for 8+ guests and 6 guests dominate the North Salt Lake STR market, accounting for 45.5% of listings.
- 51.0% of properties accommodate 6+ guests, serving the market segment for larger families or group travel in North Salt Lake.
- On average, properties in North Salt Lake are equipped to host 5.2 guests.
North Salt Lake Airbnb Booking Patterns (2026): Available vs. Booked Days
Available Days Distribution
Booked Days Distribution
Booking Pattern Insights for North Salt Lake
- The most common availability pattern in North Salt Lake falls within the 181-270 days range, representing 38.2% of listings. This suggests many properties have significant open periods on their calendars.
- Approximately 65.5% of listings show high availability (181+ days open annually), indicating potential for increased bookings or specific owner usage patterns.
- For booked days, the 91-180 days range is most frequent in North Salt Lake (36.4%), reflecting common guest stay durations or potential owner blocking patterns.
- A notable 38.2% of properties secure long booking periods (181+ days booked per year), highlighting successful long-term rental strategies or significant owner usage.
North Salt Lake Airbnb Minimum Stay Requirements Analysis
Distribution of Listings by Minimum Night Requirement
1 Night
26 listings
47.3% of total
2 Nights
10 listings
18.2% of total
3 Nights
5 listings
9.1% of total
4-6 Nights
1 listings
1.8% of total
7-29 Nights
4 listings
7.3% of total
30+ Nights
9 listings
16.4% of total
Key Insights
- The most prevalent minimum stay requirement in North Salt Lake is 1 Night, adopted by 47.3% of listings. This highlights the market's preference for shorter, flexible bookings.
- A strong majority (65.5%) of the North Salt Lake Airbnb data shows acceptance of very short stays (1-2 nights), indicating a dynamic, high-turnover market.
- A significant segment (16.4%) caters to monthly stays (30+ nights) in North Salt Lake, pointing to opportunities in the extended-stay market.
Recommendations
- Align with the market by considering a 1 Night minimum stay, as 47.3% of North Salt Lake hosts use this setting.
- Explore offering discounts for stays of 30+ nights to attract the 16.4% of the market seeking extended stays.
- Adjust minimum nights based on seasonality – potentially shorter during low season and longer during peak demand periods in North Salt Lake.
North Salt Lake Airbnb Cancellation Policy Trends Analysis (2026)
Super Strict 30 Days
9 listings
16.7% of total
Flexible
11 listings
20.4% of total
Moderate
13 listings
24.1% of total
Firm
12 listings
22.2% of total
Strict
9 listings
16.7% of total
Cancellation Policy Insights for North Salt Lake
- The prevailing Airbnb cancellation policy trend in North Salt Lake is Moderate, used by 24.1% of listings.
- There's a relatively balanced mix between guest-friendly (44.5%) and stricter (38.9%) policies, offering choices for different guest needs.
Recommendations for Hosts
- Consider adopting a Moderate policy to align with the 24.1% market standard in North Salt Lake.
- Regularly review your cancellation policy against competitors and market demand shifts in North Salt Lake.
North Salt Lake STR Booking Lead Time Analysis (2026)
Average Booking Lead Time by Month
Booking Lead Time Insights for North Salt Lake
- The overall average booking lead time for vacation rentals in North Salt Lake is 37 days.
- Guests book furthest in advance for stays during May (average 52 days), likely coinciding with peak travel demand or local events.
- The shortest booking windows occur for stays in March (average 27 days), indicating more last-minute travel plans during this time.
- Seasonally, Summer (41 days avg.) sees the longest lead times, while Winter (36 days avg.) has the shortest, reflecting typical travel planning cycles.
Recommendations for Hosts
- Use the overall average lead time (37 days) as a baseline for your pricing and availability strategy in North Salt Lake.
- For May stays, consider implementing length-of-stay discounts or slightly higher rates for bookings made less than 52 days out to capitalize on advance planning.
- Target marketing efforts for the Summer season well in advance (at least 41 days) to capture early planners.
- Monitor your own booking lead times against these North Salt Lake averages to identify opportunities for dynamic pricing adjustments.
Popular & Essential Airbnb Amenities in North Salt Lake (2026)
Amenity Prevalence
Amenity Insights for North Salt Lake
- Essential amenities in North Salt Lake that guests expect include: Wifi, TV, Free parking on premises, Smoke alarm, Air conditioning. Lacking these (any) could significantly impact bookings.
- Popular amenities like Kitchen, Heating, Hot water are common but not universal. Offering these can provide a competitive edge.
Recommendations for Hosts
- Ensure your listing includes all essential amenities for North Salt Lake: Wifi, TV, Free parking on premises, Smoke alarm, Air conditioning.
- Prioritize adding missing essentials: TV, Free parking on premises, Smoke alarm, Air conditioning.
- Consider adding popular differentiators like Kitchen or Heating to increase appeal.
- Highlight unique or less common amenities you offer (e.g., hot tub, dedicated workspace, EV charger) in your listing description and photos.
- Regularly check competitor amenities in North Salt Lake to stay competitive.
North Salt Lake Airbnb Guest Demographics & Profile Analysis (2026)
Guest Profile Summary for North Salt Lake
- The typical guest profile for Airbnb in North Salt Lake consists of primarily domestic travelers (95%), often arriving from nearby Boise, typically belonging to the Post-2000s (Gen Z/Alpha) group (50%), primarily speaking English or Spanish.
- Domestic travelers account for 94.9% of guests.
- Key international markets include United States (94.9%) and Canada (1.6%).
- Top languages spoken are English (69%) followed by Spanish (15.2%).
- A significant demographic segment is the Post-2000s (Gen Z/Alpha) group, representing 50% of guests.
Recommendations for Hosts
- Target domestic marketing efforts towards travelers from Boise and Los Angeles.
- Tailor amenities and listing descriptions to appeal to the dominant Post-2000s (Gen Z/Alpha) demographic (e.g., highlight fast WiFi, smart home features, local guides).
- Highlight unique local experiences or amenities relevant to the primary guest profile.
- Consider seasonal promotions aligned with peak travel times for key origin markets.
Nearby Short-Term Rental Market Comparison
How does the North Salt Lake Airbnb market stack up against its neighbors? Compare key performance metrics like average monthly revenue, ADR, and occupancy rates in surrounding areas to understand the broader regional STR landscape.
| Market | Active Properties | Monthly Revenue | Daily Rate | Avg. Occupancy |
|---|---|---|---|---|
| Sundance | 61 | $6,552 | $867.92 | 33% |
| Alta | 44 | $5,993 | $971.20 | 39% |
| Daniel | 25 | $5,231 | $693.40 | 34% |
| Brighton | 151 | $4,367 | $557.15 | 37% |
| Oakley | 12 | $4,163 | $875.37 | 32% |
| Park City | 4,036 | $4,087 | $626.69 | 34% |
| Coalville | 36 | $3,711 | $440.00 | 33% |
| Mapleton | 11 | $3,385 | $365.91 | 41% |
| Heber City | 220 | $3,287 | $497.35 | 34% |
| Hideout | 105 | $3,209 | $453.17 | 35% |