Monticello Airbnb Market Analysis 2026: Short Term Rental Data & Vacation Rental Statistics in Utah, United States
Is Airbnb profitable in Monticello in 2026? Explore comprehensive Airbnb analytics for Monticello, Utah, United States to uncover income potential. This 2026 STR market report for Monticello, based on AirROI data from February 2025 to January 2026, reveals key trends in the niche market of 80 active listings.
Whether you're considering an Airbnb investment in Monticello, optimizing your existing vacation rental, or exploring rental arbitrage opportunities, understanding the Monticello Airbnb data is crucial. Leveraging the low regulation environment is key to maximizing your short term rental income potential. Let's dive into the specifics.
Key Monticello Airbnb Performance Metrics Overview
Monthly Airbnb Revenue Variations & Income Potential in Monticello (2026)
Understanding the monthly revenue variations for Airbnb listings in Monticello is key to maximizing your short term rental income potential. Seasonality significantly impacts earnings. Our analysis, based on data from the past 12 months, shows that the peak revenue month for STRs in Monticello is typically May, while January often presents the lowest earnings, highlighting opportunities for strategic pricing adjustments during shoulder and low seasons. Explore the typical Airbnb income in Monticello across different performance tiers:
- Best-in-class properties (Top 10%) achieve $4,354+ monthly, often utilizing dynamic pricing and superior guest experiences.
- Strong performing properties (Top 25%) earn $2,913 or more, indicating effective management and desirable locations/amenities.
- Typical properties (Median) generate around $1,706 per month, representing the average market performance.
- Entry-level properties (Bottom 25%) see earnings around $709, often with potential for optimization.
Average Monthly Airbnb Earnings Trend in Monticello
Monticello Airbnb Occupancy Rate Trends (2026)
Maximize your bookings by understanding the Monticello STR occupancy trends. Seasonal demand shifts significantly influence how often properties are booked. Typically, Octobersees the highest demand (peak season occupancy), while August experiences the lowest (low season). Effective strategies, like adjusting minimum stays or offering promotions, can boost occupancy during slower periods. Here's how different property tiers perform in Monticello:
- Best-in-class properties (Top 10%) achieve 75%+ occupancy, indicating high desirability and potentially optimized availability.
- Strong performing properties (Top 25%) maintain 58% or higher occupancy, suggesting good market fit and guest satisfaction.
- Typical properties (Median) have an occupancy rate around 39%.
- Entry-level properties (Bottom 25%) average 21% occupancy, potentially facing higher vacancy.
Average Monthly Occupancy Rate Trend in Monticello
Average Daily Rate (ADR) Airbnb Trends in Monticello (2026)
Effective short term rental pricing strategy in Monticello involves understanding monthly ADR fluctuations. The Average Daily Rate (ADR) for Airbnb in Monticello typically peaks in October and dips lowest during February. Leveraging Airbnb dynamic pricing tools or strategies based on this seasonality can significantly boost revenue. Here's a look at the typical nightly rates achieved:
- Best-in-class properties (Top 10%) command rates of $267+ per night, often due to premium features or locations.
- Strong performing properties (Top 25%) achieve nightly rates of $190 or more.
- Typical properties (Median) charge around $133 per night.
- Entry-level properties (Bottom 25%) earn around $90 per night.
Average Daily Rate (ADR) Trend by Month in Monticello
Get Live Monticello Market Intelligence 👇

Explore Real-time Analytics
Airbnb Seasonality Analysis & Trends in Monticello (2026)
Peak Season (May, October, April)
- Revenue averages $2,568 per month
- Occupancy rates average 46.2%
- Daily rates average $200
Shoulder Season
- Revenue averages $2,106 per month
- Occupancy maintains around 42.8%
- Daily rates hold near $186
Low Season (January, August, December)
- Revenue drops to average $1,666 per month
- Occupancy decreases to average 31.6%
- Daily rates adjust to average $195
Seasonality Insights for Monticello
- The Airbnb seasonality in Monticello shows moderate seasonality with distinct peak and low periods. While the sections above show seasonal averages, it's also insightful to look at the extremes:
- During the high season, the absolute peak month showcases Monticello's highest earning potential, with monthly revenues capable of climbing to $2,632, occupancy reaching a high of 48.2%, and ADRs peaking at $219.
- Conversely, the slowest single month of the year, typically falling within the low season, marks the market's lowest point. In this month, revenue might dip to $1,496, occupancy could drop to 31.3%, and ADRs may adjust down to $161.
- Understanding both the seasonal averages and these monthly peaks and troughs in revenue, occupancy, and ADR is crucial for maximizing your Airbnb profit potential in Monticello.
Seasonal Strategies for Maximizing Profit
- Peak Season: Maximize revenue through premium pricing and potentially longer minimum stays. Ensure high availability.
- Low Season: Offer competitive pricing, special promotions (e.g., extended stay discounts), and flexible cancellation policies. Target off-season travelers like remote workers or budget-conscious guests.
- Shoulder Seasons: Implement dynamic pricing that balances peak and low rates. Target weekend travelers or specific events. Offer slightly more flexible terms than peak season.
- Regularly analyze your own performance against these Monticello seasonality benchmarks and adjust your pricing and availability strategy accordingly.
Best Areas for Airbnb Investment in Monticello (2026)
Exploring the top neighborhoods for short-term rentals in Monticello? This section highlights key areas, outlining why they are attractive for hosts and guests, along with notable local attractions. Consider these locations based on your target guest profile and investment strategy.
| Neighborhood / Area | Why Host Here? (Target Guests & Appeal) | Key Attractions & Landmarks |
|---|---|---|
| Bear Lake | A stunning alpine lake region famous for its turquoise waters, making it a popular summer getaway for families and outdoor enthusiasts. Ideal for water sports, fishing, and relaxation. | Bear Lake State Park, Garden City, Bear Lake Marina, Trout Creek, Bear Lake National Wildlife Refuge |
| Goosenecks State Park | A dramatic landscape with stunning views of the San Juan River's meandering path. Perfect for nature lovers and photographers looking for breathtaking vistas and natural beauty. | Goosenecks Overlook, San Juan River, Camping and hiking opportunities |
| Glen Canyon National Recreation Area | A vast area featuring breathtaking canyons and lakes, known for adventure tourism such as boating, hiking, and scenic photography, attracting many outdoor enthusiasts. | Lake Powell, Rainbow Bridge, Antelope Canyon, Hiking trails, Water sports |
| Monument Valley | An iconic representation of the American West with its majestic sandstone buttes and cultural significance to the Navajo Nation, appealing to tourists seeking unique landscapes and experiences. | Monument Valley Tribal Park, Scenic drives, Guided tours, Photography hotspots |
| Zion National Park | One of the most famous national parks in the U.S., renowned for its stunning canyons, hikes, and biodiversity. A top destination for outdoor and adventure tourism. | Angels Landing, Zion Canyon Scenic Drive, Emerald Pools, Zion Narrows, Observation Point |
| Arches National Park | Famous for its unique geological formations, particularly its natural arches. A prime location for tourism with hiking and photography opportunities. | Delicate Arch, Landscape Arch, Fiery Furnace, Park Avenue, Devil's Garden |
| Canyonlands National Park | A vast and rugged landscape offering stunning views and numerous hiking and biking trails. Ideal for adventure seekers and those looking for solitude in nature. | Island in the Sky, Needles District, Mesa Arch, Canyonland River |
| Lake Powell | A massive reservoir on the Colorado River known for its stunning blue water and surrounding red rock canyons. Popular for boating, fishing, and scenic excursions. | Boating on Lake Powell, Houseboat rentals, Rainbow Bridge, Antelope Canyon |
Understanding Airbnb License Requirements & STR Laws in Monticello (2026)
While Monticello, Utah, United States currently shows low STR regulations, specific Airbnb license requirements might still exist or change. Always verify the latest short term rental regulations and Airbnb license requirements directly with local government authorities for Monticello to ensure full compliance before hosting.
(Source: AirROI data, 2026, finding no licensed listings among those analyzed)
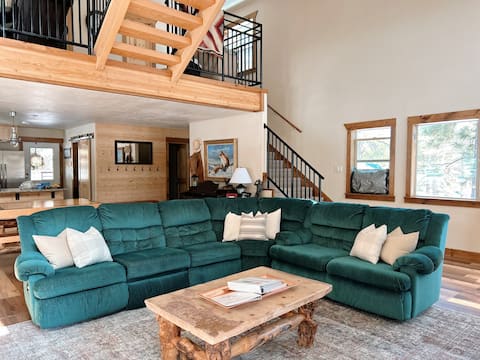
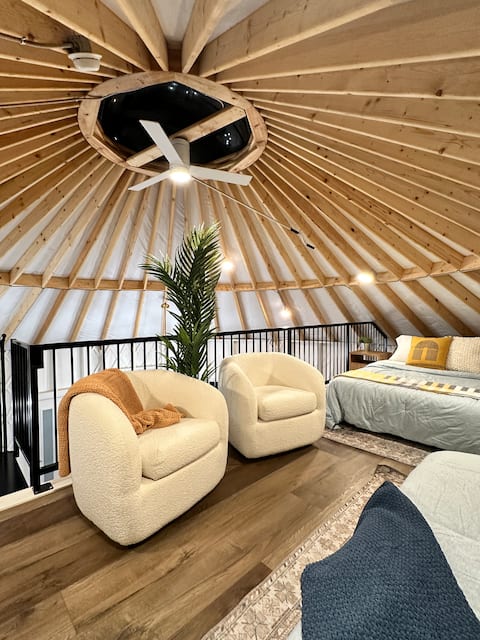
Top Performing Airbnb Properties in Monticello (2026)
Benchmark your potential! Explore examples of top-performing Airbnb properties in Monticellobased on Trailing Twelve Month (TTM) revenue. Analyze their characteristics, revenue, occupancy rate, and ADR to understand what drives success in this market.
Lil' Cascade Mountain Lodge
Entire Place • 7 bedrooms
Stunning views, National Parks, Unique Experience
Entire Place • 2 bedrooms
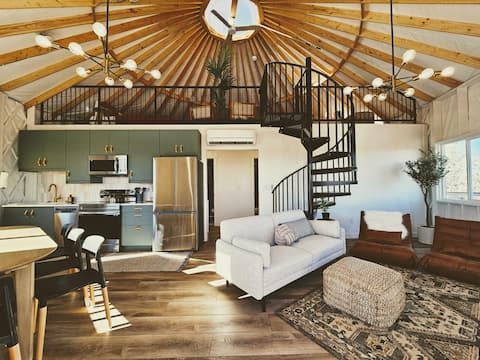
Gorgeous Yurt w/ Marvelous Views, National Parks
Entire Place • 2 bedrooms

W-W: Pinyon View Cabin - High Speed Internet!
Entire Place • 5 bedrooms

W-W: Canyon View Cabin, An Epic Family Retreat
Entire Place • 3 bedrooms

Marie's Place Cabins
Entire Place • 3 bedrooms
Note: Performance varies based on location, size, amenities, seasonality, and management quality. Data reflects the past 12 months.
Top Performing Airbnb Hosts in Monticello (2026)
Learn from the best! This table showcases top-performing Airbnb hosts in Monticello based on the number of properties managed and estimated total revenue over the past year. Analyze their scale and performance metrics.
| Host Name | Properties | Grossing Revenue | Stay Reviews | Avg Rating |
|---|---|---|---|---|
| Preston | 24 | $446,328 | 1799 | 4.83/5.0 |
| Mark | 8 | $186,791 | 506 | 4.93/5.0 |
| Kendyl | 4 | $167,618 | 631 | 4.96/5.0 |
| Erik And Keshia | 8 | $110,526 | 376 | 4.98/5.0 |
| Susanne | 1 | $81,544 | 13 | 5.00/5.0 |
| Kayla | 4 | $73,023 | 514 | 4.73/5.0 |
| Sheila | 3 | $47,637 | 503 | 4.99/5.0 |
| Sherrill & Bryan | 1 | $46,254 | 447 | 4.97/5.0 |
| Peter | 1 | $45,865 | 29 | 5.00/5.0 |
| Wendy | 1 | $44,237 | 22 | 4.73/5.0 |
Analyzing the strategies of top hosts, such as their property selection, pricing, and guest communication, can offer valuable lessons for optimizing your own Airbnb operations in Monticello.
Dive Deeper: Advanced Monticello STR Market Data (2026)
Ready to unlock more insights? AirROI provides access to advanced metrics and comprehensive Airbnb data for Monticello. Explore detailed analytics beyond this report to refine your investment strategy, optimize pricing, and maximize your vacation rental profits.
Explore Advanced MetricsMonticello Short-Term Rental Market Composition (2026): Property & Room Types
Room Type Distribution
Property Type Distribution
Market Composition Insights for Monticello
- The Monticello Airbnb market composition is heavily skewed towards Entire Home/Apt listings, which make up 78.8% of the 80 active rentals. This indicates strong guest preference for privacy and space.
- Looking at the property type distribution in Monticello, Outdoor/Unique properties are the most common (45%), reflecting the local real estate landscape.
- Houses represent a significant 30% portion, catering likely to families or larger groups.
- The presence of 8.8% Hotel/Boutique listings indicates integration with traditional hospitality.
- Smaller segments like others (combined 3.8%) offer potential for unique stay experiences.
Monticello Airbnb Room Capacity Analysis (2026): Bedroom Distribution
Distribution of Listings by Number of Bedrooms
Room Capacity Insights for Monticello
- The dominant room capacity in Monticello is 1 bedroom listings, making up 32.5% of the market. This suggests a strong demand for properties suitable for couples or solo travelers.
- Together, 1 bedroom and 2 bedrooms properties represent 48.8% of the active Airbnb listings in Monticello, indicating a high concentration in these sizes.
- A significant 30.1% of listings offer 3+ bedrooms, catering to larger groups and families seeking more space in Monticello.
Monticello Vacation Rental Guest Capacity Trends (2026)
Distribution of Listings by Guest Capacity
Guest Capacity Insights for Monticello
- The most common guest capacity trend in Monticello vacation rentals is listings accommodating 4 guests (32.5%). This suggests the primary traveler segment is likely small families or groups.
- Properties designed for 4 guests and 8+ guests dominate the Monticello STR market, accounting for 60.0% of listings.
- 36.3% of properties accommodate 6+ guests, serving the market segment for larger families or group travel in Monticello.
- On average, properties in Monticello are equipped to host 4.7 guests.
Monticello Airbnb Booking Patterns (2026): Available vs. Booked Days
Available Days Distribution
Booked Days Distribution
Booking Pattern Insights for Monticello
- The most common availability pattern in Monticello falls within the 271-366 days range, representing 43.8% of listings. This suggests many properties have significant open periods on their calendars.
- Approximately 81.3% of listings show high availability (181+ days open annually), indicating potential for increased bookings or specific owner usage patterns.
- For booked days, the 91-180 days range is most frequent in Monticello (41.3%), reflecting common guest stay durations or potential owner blocking patterns.
- A notable 18.8% of properties secure long booking periods (181+ days booked per year), highlighting successful long-term rental strategies or significant owner usage.
Monticello Airbnb Minimum Stay Requirements Analysis
Distribution of Listings by Minimum Night Requirement
1 Night
51 listings
63.7% of total
2 Nights
15 listings
18.8% of total
30+ Nights
14 listings
17.5% of total
Key Insights
- The most prevalent minimum stay requirement in Monticello is 1 Night, adopted by 63.7% of listings. This highlights the market's preference for shorter, flexible bookings.
- A strong majority (82.5%) of the Monticello Airbnb data shows acceptance of very short stays (1-2 nights), indicating a dynamic, high-turnover market.
- A significant segment (17.5%) caters to monthly stays (30+ nights) in Monticello, pointing to opportunities in the extended-stay market.
Recommendations
- Align with the market by considering a 1 Night minimum stay, as 63.7% of Monticello hosts use this setting.
- Explore offering discounts for stays of 30+ nights to attract the 17.5% of the market seeking extended stays.
- Adjust minimum nights based on seasonality – potentially shorter during low season and longer during peak demand periods in Monticello.
Monticello Airbnb Cancellation Policy Trends Analysis (2026)
Limited
5 listings
6.3% of total
Flexible
15 listings
18.8% of total
Moderate
20 listings
25% of total
Firm
15 listings
18.8% of total
Strict
25 listings
31.3% of total
Cancellation Policy Insights for Monticello
- The prevailing Airbnb cancellation policy trend in Monticello is Strict, used by 31.3% of listings.
- A majority (50.1%) of hosts in Monticello utilize Firm or Strict policies, indicating a market where hosts prioritize booking security.
Recommendations for Hosts
- Consider adopting a Strict policy to align with the 31.3% market standard in Monticello.
- With 31.3% using Strict terms, this is a viable option in Monticello, particularly for high-value properties or during peak demand periods.
- Regularly review your cancellation policy against competitors and market demand shifts in Monticello.
Monticello STR Booking Lead Time Analysis (2026)
Average Booking Lead Time by Month
Booking Lead Time Insights for Monticello
- The overall average booking lead time for vacation rentals in Monticello is 56 days.
- Guests book furthest in advance for stays during February (average 63 days), likely coinciding with peak travel demand or local events.
- The shortest booking windows occur for stays in January (average 25 days), indicating more last-minute travel plans during this time.
- Seasonally, Fall (59 days avg.) sees the longest lead times, while Winter (42 days avg.) has the shortest, reflecting typical travel planning cycles.
Recommendations for Hosts
- Use the overall average lead time (56 days) as a baseline for your pricing and availability strategy in Monticello.
- Target marketing efforts for the Fall season well in advance (at least 59 days) to capture early planners.
- Monitor your own booking lead times against these Monticello averages to identify opportunities for dynamic pricing adjustments.
Popular & Essential Airbnb Amenities in Monticello (2026)
Amenity Prevalence
Amenity Insights for Monticello
- Essential amenities in Monticello that guests expect include: Wifi. Lacking these (this) could significantly impact bookings.
- Popular amenities like Free parking on premises, Essentials, Shampoo are common but not universal. Offering these can provide a competitive edge.
Recommendations for Hosts
- Ensure your listing includes all essential amenities for Monticello: Wifi.
- Prioritize adding missing essentials: Wifi.
- Consider adding popular differentiators like Free parking on premises or Essentials to increase appeal.
- Highlight unique or less common amenities you offer (e.g., hot tub, dedicated workspace, EV charger) in your listing description and photos.
- Regularly check competitor amenities in Monticello to stay competitive.
Monticello Airbnb Guest Demographics & Profile Analysis (2026)
Guest Profile Summary for Monticello
- The typical guest profile for Airbnb in Monticello consists of primarily domestic travelers (90%), often arriving from nearby Salt Lake City, typically belonging to the Post-2000s (Gen Z/Alpha) group (50%), primarily speaking English or Spanish.
- Domestic travelers account for 90.0% of guests.
- Key international markets include United States (90%) and Germany (1.5%).
- Top languages spoken are English (65.1%) followed by Spanish (9.9%).
- A significant demographic segment is the Post-2000s (Gen Z/Alpha) group, representing 50% of guests.
Recommendations for Hosts
- Target domestic marketing efforts towards travelers from Salt Lake City and Denver.
- Tailor amenities and listing descriptions to appeal to the dominant Post-2000s (Gen Z/Alpha) demographic (e.g., highlight fast WiFi, smart home features, local guides).
- Highlight unique local experiences or amenities relevant to the primary guest profile.
- Consider seasonal promotions aligned with peak travel times for key origin markets.
Nearby Short-Term Rental Market Comparison
How does the Monticello Airbnb market stack up against its neighbors? Compare key performance metrics like average monthly revenue, ADR, and occupancy rates in surrounding areas to understand the broader regional STR landscape.
| Market | Active Properties | Monthly Revenue | Daily Rate | Avg. Occupancy |
|---|---|---|---|---|
| Placerville | 19 | $4,824 | $525.16 | 41% |
| Spanish Valley | 96 | $4,655 | $353.11 | 45% |
| Moab | 1,006 | $4,110 | $313.12 | 48% |
| Hanksville | 13 | $2,859 | $200.89 | 55% |
| Hesperus | 27 | $2,723 | $345.57 | 37% |
| San Juan County | 10 | $2,719 | $286.82 | 37% |
| Bluff | 18 | $2,663 | $230.65 | 44% |
| Columbia | 25 | $2,327 | $238.23 | 39% |
| Dolores | 88 | $2,224 | $219.81 | 43% |
| Farmington | 91 | $1,921 | $154.04 | 49% |