Moab Airbnb Market Analysis 2026: Short Term Rental Data & Vacation Rental Statistics in Utah, United States
Is Airbnb profitable in Moab in 2026? Explore comprehensive Airbnb analytics for Moab, Utah, United States to uncover income potential. This 2026 STR market report for Moab, based on AirROI data from February 2025 to January 2026, reveals key trends in the bustling market of 1,006 active listings.
Whether you're considering an Airbnb investment in Moab, optimizing your existing vacation rental, or exploring rental arbitrage opportunities, understanding the Moab Airbnb data is crucial. Leveraging the low regulation environment is key to maximizing your short term rental income potential. Let's dive into the specifics.
Key Moab Airbnb Performance Metrics Overview
Monthly Airbnb Revenue Variations & Income Potential in Moab (2026)
Understanding the monthly revenue variations for Airbnb listings in Moab is key to maximizing your short term rental income potential. Seasonality significantly impacts earnings. Our analysis, based on data from the past 12 months, shows that the peak revenue month for STRs in Moab is typically April, while January often presents the lowest earnings, highlighting opportunities for strategic pricing adjustments during shoulder and low seasons. Explore the typical Airbnb income in Moab across different performance tiers:
- Best-in-class properties (Top 10%) achieve $8,512+ monthly, often utilizing dynamic pricing and superior guest experiences.
- Strong performing properties (Top 25%) earn $6,137 or more, indicating effective management and desirable locations/amenities.
- Typical properties (Median) generate around $4,176 per month, representing the average market performance.
- Entry-level properties (Bottom 25%) see earnings around $2,328, often with potential for optimization.
Average Monthly Airbnb Earnings Trend in Moab
Moab Airbnb Occupancy Rate Trends (2026)
Maximize your bookings by understanding the Moab STR occupancy trends. Seasonal demand shifts significantly influence how often properties are booked. Typically, Aprilsees the highest demand (peak season occupancy), while January experiences the lowest (low season). Effective strategies, like adjusting minimum stays or offering promotions, can boost occupancy during slower periods. Here's how different property tiers perform in Moab:
- Best-in-class properties (Top 10%) achieve 82%+ occupancy, indicating high desirability and potentially optimized availability.
- Strong performing properties (Top 25%) maintain 67% or higher occupancy, suggesting good market fit and guest satisfaction.
- Typical properties (Median) have an occupancy rate around 49%.
- Entry-level properties (Bottom 25%) average 29% occupancy, potentially facing higher vacancy.
Average Monthly Occupancy Rate Trend in Moab
Average Daily Rate (ADR) Airbnb Trends in Moab (2026)
Effective short term rental pricing strategy in Moab involves understanding monthly ADR fluctuations. The Average Daily Rate (ADR) for Airbnb in Moab typically peaks in April and dips lowest during February. Leveraging Airbnb dynamic pricing tools or strategies based on this seasonality can significantly boost revenue. Here's a look at the typical nightly rates achieved:
- Best-in-class properties (Top 10%) command rates of $496+ per night, often due to premium features or locations.
- Strong performing properties (Top 25%) achieve nightly rates of $354 or more.
- Typical properties (Median) charge around $258 per night.
- Entry-level properties (Bottom 25%) earn around $192 per night.
Average Daily Rate (ADR) Trend by Month in Moab
Get Live Moab Market Intelligence 👇

Explore Real-time Analytics
Airbnb Seasonality Analysis & Trends in Moab (2026)
Peak Season (April, October, May)
- Revenue averages $7,260 per month
- Occupancy rates average 63.7%
- Daily rates average $373
Shoulder Season
- Revenue averages $4,742 per month
- Occupancy maintains around 49.5%
- Daily rates hold near $320
Low Season (January, February, December)
- Revenue drops to average $2,183 per month
- Occupancy decreases to average 30.2%
- Daily rates adjust to average $259
Seasonality Insights for Moab
- The Airbnb seasonality in Moab shows highly seasonal trends requiring careful strategy. While the sections above show seasonal averages, it's also insightful to look at the extremes:
- During the high season, the absolute peak month showcases Moab's highest earning potential, with monthly revenues capable of climbing to $7,643, occupancy reaching a high of 66.4%, and ADRs peaking at $386.
- Conversely, the slowest single month of the year, typically falling within the low season, marks the market's lowest point. In this month, revenue might dip to $1,861, occupancy could drop to 25.4%, and ADRs may adjust down to $245.
- Understanding both the seasonal averages and these monthly peaks and troughs in revenue, occupancy, and ADR is crucial for maximizing your Airbnb profit potential in Moab.
Seasonal Strategies for Maximizing Profit
- Peak Season: Maximize revenue through premium pricing and potentially longer minimum stays. Ensure high availability.
- Low Season: Offer competitive pricing, special promotions (e.g., extended stay discounts), and flexible cancellation policies. Target off-season travelers like remote workers or budget-conscious guests.
- Shoulder Seasons: Implement dynamic pricing that balances peak and low rates. Target weekend travelers or specific events. Offer slightly more flexible terms than peak season.
- Regularly analyze your own performance against these Moab seasonality benchmarks and adjust your pricing and availability strategy accordingly.
Best Areas for Airbnb Investment in Moab (2026)
Exploring the top neighborhoods for short-term rentals in Moab? This section highlights key areas, outlining why they are attractive for hosts and guests, along with notable local attractions. Consider these locations based on your target guest profile and investment strategy.
| Neighborhood / Area | Why Host Here? (Target Guests & Appeal) | Key Attractions & Landmarks |
|---|---|---|
| Arches National Park | A stunning national park known for its unique rock formations and hiking trails. Perfect for travelers looking to explore the beauty of the Utah landscape and engage in outdoor activities. | Delicate Arch, Landscape Arch, Devils Garden, Fiery Furnace, Windows Section |
| Downtown Moab | The heart of Moab, filled with shops, restaurants, and nightlife. Ideal for tourists wanting to experience local culture and community life while being close to adventure activities. | Moab Museum, Local shops and boutiques, Restaurant Row, Moab Brewery, The Moab Giants Dinosaur Park |
| Canyonlands National Park | Known for its breathtaking canyons and rugged landscape, this park is perfect for nature lovers and adventure seekers looking for hiking, biking, and spectacular views. | Island in the Sky, Mesa Arch, Upheaval Dome, Green River Overlook, Shafer Trail |
| Spanish Valley | A beautiful valley that offers stunning views of the mountains and red rock formations. Great for families and groups looking for a quieter place while still being close to Moab's amenities. | Moab Golf Club, Scenic viewpoints, Local wildlife, Near Arches National Park, Outdoor activities |
| Potash Road | A scenic road that leads to picturesque views and outdoor recreation opportunities, such as rock climbing and river activities. Attracts adventure enthusiasts and nature lovers. | Potash Boulders, Colorado River, Rock climbing routes, Scenic Overlooks, Wildlife viewing |
| Slickrock Bike Trail | Famous for its mountain biking trails, this area attracts biking enthusiasts from around the world, making it an ideal spot for hosting cyclists. | Slickrock Trail, Moab Mountain Biking, Scenic views, Challenging bike routes, Trailhead amenities |
| Dead Horse Point State Park | Renowned for its stunning overlooks and hiking opportunities, this park is a great draw for artists and scenery lovers looking for breathtaking landscapes. | Dead Horse Point Overlook, Mountain biking trails, Visitor Center, Hiking trails, Scenic picnicking spots |
| La Sal Mountains | Offering cooler temperatures and lush scenery, the La Sal Mountains provide a different environment for travelers and are popular for hiking and sightseeing. | La Sal Mountain Loop Road, Hiking trails, Scenic overlooks, Wildflower viewing, Camping sites |
Understanding Airbnb License Requirements & STR Laws in Moab (2026)
While Moab, Utah, United States currently shows low STR regulations, specific Airbnb license requirements might still exist or change. Always verify the latest short term rental regulations and Airbnb license requirements directly with local government authorities for Moab to ensure full compliance before hosting.
(Source: AirROI data, 2026, finding no licensed listings among those analyzed)
Top Performing Airbnb Properties in Moab (2026)
Benchmark your potential! Explore examples of top-performing Airbnb properties in Moabbased on Trailing Twelve Month (TTM) revenue. Analyze their characteristics, revenue, occupancy rate, and ADR to understand what drives success in this market.
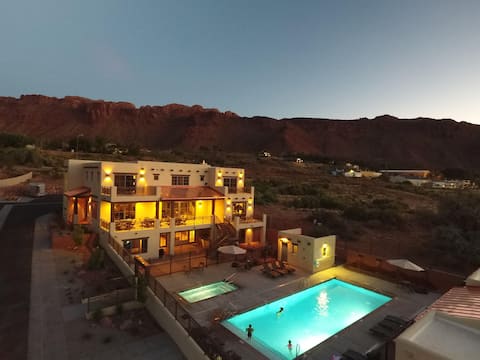
Sleeps 29, Pool/Spa/Garage/DT Location | 420/424
Entire Place • 7 bedrooms
6 BR Luxury Retreat • Hot Tubs, Bocce & Views
Entire Place • 6 bedrooms
Exclusive Retreats 6 Bedroom Suites + Private Pool
Entire Place • 6 bedrooms
Sleeps 29 | Bikes | Pool/Spa | Garage| 425/429
Entire Place • 8 bedrooms

Hideout at the Rim - Moab's Best Kept Secret
Entire Place • 5 bedrooms
Brand New Lodge in the heart of Moab, Utah
Private Room • 10 bedrooms
Note: Performance varies based on location, size, amenities, seasonality, and management quality. Data reflects the past 12 months.
Top Performing Airbnb Hosts in Moab (2026)
Learn from the best! This table showcases top-performing Airbnb hosts in Moab based on the number of properties managed and estimated total revenue over the past year. Analyze their scale and performance metrics.
| Host Name | Properties | Grossing Revenue | Stay Reviews | Avg Rating |
|---|---|---|---|---|
| Scott & Sarah | 37 | $4,835,004 | 1644 | 4.97/5.0 |
| Moab Lodging Vacation Rentals | 76 | $4,668,610 | 15410 | 4.80/5.0 |
| Cassidi | 28 | $2,563,985 | 4270 | 4.91/5.0 |
| Jacob | 40 | $2,360,246 | 1241 | 4.87/5.0 |
| Moab VRC | 42 | $2,349,618 | 1296 | 4.88/5.0 |
| Tyler @ Copper Ridge Property | 29 | $1,646,043 | 1967 | 4.84/5.0 |
| Haley @ Copper Ridge Property | 27 | $1,480,776 | 5580 | 4.85/5.0 |
| Miranda | 25 | $1,438,245 | 2549 | 4.81/5.0 |
| Evolve | 17 | $1,225,051 | 1860 | 4.78/5.0 |
| Nicole | 27 | $1,099,425 | 1117 | 4.85/5.0 |
Analyzing the strategies of top hosts, such as their property selection, pricing, and guest communication, can offer valuable lessons for optimizing your own Airbnb operations in Moab.
Dive Deeper: Advanced Moab STR Market Data (2026)
Ready to unlock more insights? AirROI provides access to advanced metrics and comprehensive Airbnb data for Moab. Explore detailed analytics beyond this report to refine your investment strategy, optimize pricing, and maximize your vacation rental profits.
Explore Advanced MetricsMoab Short-Term Rental Market Composition (2026): Property & Room Types
Room Type Distribution
Property Type Distribution
Market Composition Insights for Moab
- The Moab Airbnb market composition is heavily skewed towards Entire Home/Apt listings, which make up 92.2% of the 1,006 active rentals. This indicates strong guest preference for privacy and space.
- Looking at the property type distribution in Moab, House properties are the most common (54.6%), reflecting the local real estate landscape.
- Houses represent a significant 54.6% portion, catering likely to families or larger groups.
- Smaller segments like hotel/boutique, others, unique stays (combined 6.3%) offer potential for unique stay experiences.
Moab Airbnb Room Capacity Analysis (2026): Bedroom Distribution
Distribution of Listings by Number of Bedrooms
Room Capacity Insights for Moab
- The dominant room capacity in Moab is 3 bedrooms listings, making up 43.3% of the market. This suggests a strong demand for properties suitable for families or small groups.
- Together, 3 bedrooms and 1 bedroom properties represent 64.3% of the active Airbnb listings in Moab, indicating a high concentration in these sizes.
- A significant 53.5% of listings offer 3+ bedrooms, catering to larger groups and families seeking more space in Moab.
Moab Vacation Rental Guest Capacity Trends (2026)
Distribution of Listings by Guest Capacity
Guest Capacity Insights for Moab
- The most common guest capacity trend in Moab vacation rentals is listings accommodating 8+ guests (46%). This suggests the primary traveler segment is likely larger groups.
- Properties designed for 8+ guests and 6 guests dominate the Moab STR market, accounting for 67.2% of listings.
- 70.0% of properties accommodate 6+ guests, serving the market segment for larger families or group travel in Moab.
- On average, properties in Moab are equipped to host 6.0 guests.
Moab Airbnb Booking Patterns (2026): Available vs. Booked Days
Available Days Distribution
Booked Days Distribution
Booking Pattern Insights for Moab
- The most common availability pattern in Moab falls within the 181-270 days range, representing 38% of listings. This suggests many properties have significant open periods on their calendars.
- Approximately 61.2% of listings show high availability (181+ days open annually), indicating potential for increased bookings or specific owner usage patterns.
- For booked days, the 91-180 days range is most frequent in Moab (38.2%), reflecting common guest stay durations or potential owner blocking patterns.
- A notable 40.3% of properties secure long booking periods (181+ days booked per year), highlighting successful long-term rental strategies or significant owner usage.
Moab Airbnb Minimum Stay Requirements Analysis
Distribution of Listings by Minimum Night Requirement
1 Night
332 listings
33% of total
2 Nights
273 listings
27.1% of total
3 Nights
15 listings
1.5% of total
4-6 Nights
4 listings
0.4% of total
7-29 Nights
6 listings
0.6% of total
30+ Nights
376 listings
37.4% of total
Key Insights
- The most prevalent minimum stay requirement in Moab is 30+ Nights, adopted by 37.4% of listings. This highlights the market's preference for longer commitments.
- A strong majority (60.1%) of the Moab Airbnb data shows acceptance of very short stays (1-2 nights), indicating a dynamic, high-turnover market.
- A significant segment (37.4%) caters to monthly stays (30+ nights) in Moab, pointing to opportunities in the extended-stay market.
Recommendations
- Align with the market by considering a 30+ Nights minimum stay, as 37.4% of Moab hosts use this setting.
- Explore offering discounts for stays of 30+ nights to attract the 37.4% of the market seeking extended stays.
- Adjust minimum nights based on seasonality – potentially shorter during low season and longer during peak demand periods in Moab.
Moab Airbnb Cancellation Policy Trends Analysis (2026)
Limited
25 listings
2.5% of total
Super Strict 30 Days
24 listings
2.4% of total
Flexible
46 listings
4.6% of total
Moderate
209 listings
20.8% of total
Firm
547 listings
54.5% of total
Strict
153 listings
15.2% of total
Cancellation Policy Insights for Moab
- The prevailing Airbnb cancellation policy trend in Moab is Firm, used by 54.5% of listings.
- A majority (69.7%) of hosts in Moab utilize Firm or Strict policies, indicating a market where hosts prioritize booking security.
Recommendations for Hosts
- Consider adopting a Firm policy to align with the 54.5% market standard in Moab.
- Regularly review your cancellation policy against competitors and market demand shifts in Moab.
Moab STR Booking Lead Time Analysis (2026)
Average Booking Lead Time by Month
Booking Lead Time Insights for Moab
- The overall average booking lead time for vacation rentals in Moab is 62 days.
- Guests book furthest in advance for stays during September (average 80 days), likely coinciding with peak travel demand or local events.
- The shortest booking windows occur for stays in January (average 27 days), indicating more last-minute travel plans during this time.
- Seasonally, Fall (73 days avg.) sees the longest lead times, while Winter (35 days avg.) has the shortest, reflecting typical travel planning cycles.
Recommendations for Hosts
- Use the overall average lead time (62 days) as a baseline for your pricing and availability strategy in Moab.
- For September stays, consider implementing length-of-stay discounts or slightly higher rates for bookings made less than 80 days out to capitalize on advance planning.
- Target marketing efforts for the Fall season well in advance (at least 73 days) to capture early planners.
- Monitor your own booking lead times against these Moab averages to identify opportunities for dynamic pricing adjustments.
Popular & Essential Airbnb Amenities in Moab (2026)
Amenity Prevalence
Amenity Insights for Moab
- Essential amenities in Moab that guests expect include: Wifi, Air conditioning, Heating. Lacking these (any) could significantly impact bookings.
- Popular amenities like Free parking on premises, Essentials, Smoke alarm are common but not universal. Offering these can provide a competitive edge.
Recommendations for Hosts
- Ensure your listing includes all essential amenities for Moab: Wifi, Air conditioning, Heating.
- Prioritize adding missing essentials: Wifi, Air conditioning, Heating.
- Consider adding popular differentiators like Free parking on premises or Essentials to increase appeal.
- Highlight unique or less common amenities you offer (e.g., hot tub, dedicated workspace, EV charger) in your listing description and photos.
- Regularly check competitor amenities in Moab to stay competitive.
Moab Airbnb Guest Demographics & Profile Analysis (2026)
Guest Profile Summary for Moab
- The typical guest profile for Airbnb in Moab consists of primarily domestic travelers (94%), often arriving from nearby Salt Lake City, typically belonging to the Post-2000s (Gen Z/Alpha) group (50%), primarily speaking English or Spanish.
- Domestic travelers account for 94.1% of guests.
- Key international markets include United States (94.1%) and Canada (1.2%).
- Top languages spoken are English (69.2%) followed by Spanish (11.7%).
- A significant demographic segment is the Post-2000s (Gen Z/Alpha) group, representing 50% of guests.
Recommendations for Hosts
- Target domestic marketing efforts towards travelers from Salt Lake City and Denver.
- Tailor amenities and listing descriptions to appeal to the dominant Post-2000s (Gen Z/Alpha) demographic (e.g., highlight fast WiFi, smart home features, local guides).
- Highlight unique local experiences or amenities relevant to the primary guest profile.
- Consider seasonal promotions aligned with peak travel times for key origin markets.
Nearby Short-Term Rental Market Comparison
How does the Moab Airbnb market stack up against its neighbors? Compare key performance metrics like average monthly revenue, ADR, and occupancy rates in surrounding areas to understand the broader regional STR landscape.
| Market | Active Properties | Monthly Revenue | Daily Rate | Avg. Occupancy |
|---|---|---|---|---|
| Placerville | 19 | $4,824 | $525.16 | 41% |
| Spanish Valley | 96 | $4,655 | $353.11 | 45% |
| Hanksville | 13 | $2,859 | $200.89 | 55% |
| Hesperus | 27 | $2,723 | $345.57 | 37% |
| San Juan County | 10 | $2,719 | $286.82 | 37% |
| Bluff | 18 | $2,663 | $230.65 | 44% |
| Mesa | 28 | $2,640 | $287.97 | 34% |
| Palisade | 111 | $2,572 | $251.76 | 43% |
| Clifton | 25 | $2,561 | $201.23 | 46% |
| Columbia | 25 | $2,327 | $238.23 | 39% |