Midvale Airbnb Market Analysis 2026: Short Term Rental Data & Vacation Rental Statistics in Utah, United States
Is Airbnb profitable in Midvale in 2026? Explore comprehensive Airbnb analytics for Midvale, Utah, United States to uncover income potential. This 2026 STR market report for Midvale, based on AirROI data from February 2025 to January 2026, reveals key trends in the niche market of 101 active listings.
Whether you're considering an Airbnb investment in Midvale, optimizing your existing vacation rental, or exploring rental arbitrage opportunities, understanding the Midvale Airbnb data is crucial. Leveraging the low regulation environment is key to maximizing your short term rental income potential. Let's dive into the specifics.
Key Midvale Airbnb Performance Metrics Overview
Monthly Airbnb Revenue Variations & Income Potential in Midvale (2026)
Understanding the monthly revenue variations for Airbnb listings in Midvale is key to maximizing your short term rental income potential. Seasonality significantly impacts earnings. Our analysis, based on data from the past 12 months, shows that the peak revenue month for STRs in Midvale is typically March, while April often presents the lowest earnings, highlighting opportunities for strategic pricing adjustments during shoulder and low seasons. Explore the typical Airbnb income in Midvale across different performance tiers:
- Best-in-class properties (Top 10%) achieve $5,523+ monthly, often utilizing dynamic pricing and superior guest experiences.
- Strong performing properties (Top 25%) earn $3,667 or more, indicating effective management and desirable locations/amenities.
- Typical properties (Median) generate around $2,368 per month, representing the average market performance.
- Entry-level properties (Bottom 25%) see earnings around $1,295, often with potential for optimization.
Average Monthly Airbnb Earnings Trend in Midvale
Midvale Airbnb Occupancy Rate Trends (2026)
Maximize your bookings by understanding the Midvale STR occupancy trends. Seasonal demand shifts significantly influence how often properties are booked. Typically, Marchsees the highest demand (peak season occupancy), while November experiences the lowest (low season). Effective strategies, like adjusting minimum stays or offering promotions, can boost occupancy during slower periods. Here's how different property tiers perform in Midvale:
- Best-in-class properties (Top 10%) achieve 84%+ occupancy, indicating high desirability and potentially optimized availability.
- Strong performing properties (Top 25%) maintain 71% or higher occupancy, suggesting good market fit and guest satisfaction.
- Typical properties (Median) have an occupancy rate around 54%.
- Entry-level properties (Bottom 25%) average 34% occupancy, potentially facing higher vacancy.
Average Monthly Occupancy Rate Trend in Midvale
Average Daily Rate (ADR) Airbnb Trends in Midvale (2026)
Effective short term rental pricing strategy in Midvale involves understanding monthly ADR fluctuations. The Average Daily Rate (ADR) for Airbnb in Midvale typically peaks in December and dips lowest during April. Leveraging Airbnb dynamic pricing tools or strategies based on this seasonality can significantly boost revenue. Here's a look at the typical nightly rates achieved:
- Best-in-class properties (Top 10%) command rates of $284+ per night, often due to premium features or locations.
- Strong performing properties (Top 25%) achieve nightly rates of $200 or more.
- Typical properties (Median) charge around $129 per night.
- Entry-level properties (Bottom 25%) earn around $88 per night.
Average Daily Rate (ADR) Trend by Month in Midvale
Get Live Midvale Market Intelligence 👇

Explore Real-time Analytics
Airbnb Seasonality Analysis & Trends in Midvale (2026)
Peak Season (March, February, July)
- Revenue averages $3,179 per month
- Occupancy rates average 63.7%
- Daily rates average $149
Shoulder Season
- Revenue averages $2,795 per month
- Occupancy maintains around 49.1%
- Daily rates hold near $164
Low Season (April, May, November)
- Revenue drops to average $2,165 per month
- Occupancy decreases to average 47.5%
- Daily rates adjust to average $148
Seasonality Insights for Midvale
- The Airbnb seasonality in Midvale shows moderate seasonality with distinct peak and low periods. While the sections above show seasonal averages, it's also insightful to look at the extremes:
- During the high season, the absolute peak month showcases Midvale's highest earning potential, with monthly revenues capable of climbing to $3,353, occupancy reaching a high of 70.0%, and ADRs peaking at $187.
- Conversely, the slowest single month of the year, typically falling within the low season, marks the market's lowest point. In this month, revenue might dip to $1,894, occupancy could drop to 40.8%, and ADRs may adjust down to $133.
- Understanding both the seasonal averages and these monthly peaks and troughs in revenue, occupancy, and ADR is crucial for maximizing your Airbnb profit potential in Midvale.
Seasonal Strategies for Maximizing Profit
- Peak Season: Maximize revenue through premium pricing and potentially longer minimum stays. Ensure high availability.
- Low Season: Offer competitive pricing, special promotions (e.g., extended stay discounts), and flexible cancellation policies. Target off-season travelers like remote workers or budget-conscious guests.
- Shoulder Seasons: Implement dynamic pricing that balances peak and low rates. Target weekend travelers or specific events. Offer slightly more flexible terms than peak season.
- Regularly analyze your own performance against these Midvale seasonality benchmarks and adjust your pricing and availability strategy accordingly.
Best Areas for Airbnb Investment in Midvale (2026)
Exploring the top neighborhoods for short-term rentals in Midvale? This section highlights key areas, outlining why they are attractive for hosts and guests, along with notable local attractions. Consider these locations based on your target guest profile and investment strategy.
| Neighborhood / Area | Why Host Here? (Target Guests & Appeal) | Key Attractions & Landmarks |
|---|---|---|
| Midvale Central | The heart of Midvale with easy access to shopping, dining, and public transportation. Ideal for travelers looking for convenience and local culture. | Midvale City Park, The Midvale Historical Museum, Midvale Performing Arts Center, Shopping at Midvale Marketplace, Ninth Avenue Park |
| Wasatch Boulevard | Close to the mountains and outdoor activities, this area attracts outdoor enthusiasts looking for easy access to hiking, skiing, and nature. | Little Cottonwood Canyon, Snowbird Ski Resort, Brighton Ski Resort, Hiking Trails, Wasatch Mountain State Park |
| Bingham Junction | This vibrant area features a mix of residential and commercial properties, popular with those working in nearby business hubs and shopping areas. | Bingham Junction Park, The 9th Avenue Plaza, Restaurants and cafés, Easy access to I-15 and TRAX light rail |
| West Midvale | Offers affordable and family-friendly accommodations with proximity to schools and parks. Great for families and long-term stays. | West Midvale Park, Midvale Middle School, Dining options on 7200 South, Close to the Jordan River |
| Gardner Village | A charming historic area with unique shops and restaurants. Popular for its beautifully preserved buildings and seasonal events. | Gardner Village Shops, Pioneer Village, Seasonal festivals, Dining at local restaurants |
| East Midvale | A growing area with new developments, close to various parks and recreational areas. Appeals to both families and young professionals. | Midvale City Parks, Circle Park, Access to hiking and biking trails |
| South Jordan | Just a short drive from Midvale, it offers a more suburban feel with plenty of amenities, making it attractive for families. | The District shopping center, South Jordan Community Center, Local parks and recreation areas |
| Copperview | A cozy neighborhood that's convenient for local amenities and close to schools, perfect for those seeking a residential feel. | Copperview Recreation Center, Local parks and playgrounds, Shopping on 700 West, Quick access to I-15 |
Understanding Airbnb License Requirements & STR Laws in Midvale (2026)
While Midvale, Utah, United States currently shows low STR regulations, specific Airbnb license requirements might still exist or change. Always verify the latest short term rental regulations and Airbnb license requirements directly with local government authorities for Midvale to ensure full compliance before hosting.
(Source: AirROI data, 2026, based on 1% licensed listings)
Top Performing Airbnb Properties in Midvale (2026)
Benchmark your potential! Explore examples of top-performing Airbnb properties in Midvalebased on Trailing Twelve Month (TTM) revenue. Analyze their characteristics, revenue, occupancy rate, and ADR to understand what drives success in this market.

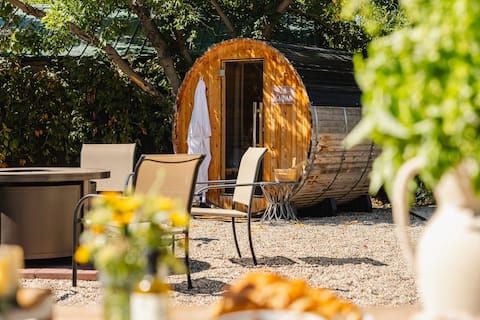
Skee Ball & Yard Games Galore!
Entire Place • 5 bedrooms
Midvale Station — Ski. Relax. Repeat.
Entire Place • 4 bedrooms
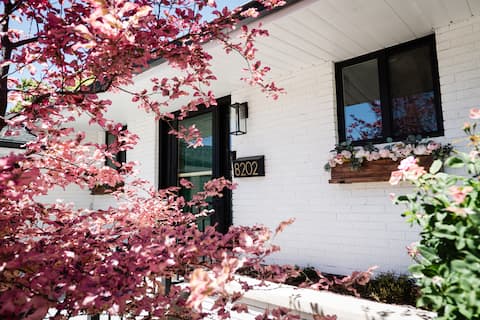
The White House on Wood
Entire Place • 5 bedrooms

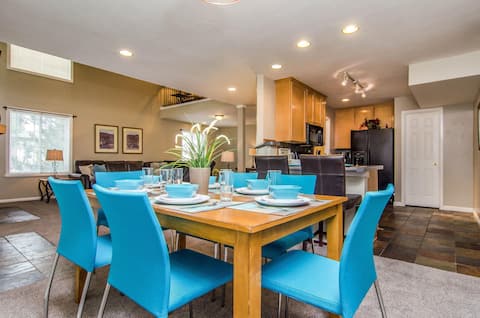
The Olive Den/Spacious Newly Remodeled /Big Groups
Entire Place • 6 bedrooms
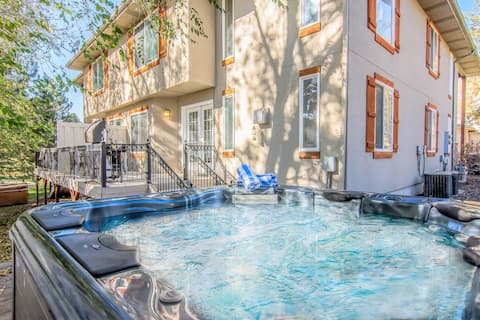
2 Homes * 2 Hot Tubs *Near Skiing *XBox * Foosball
Entire Place • 6 bedrooms
Modern Parkside Home! Hot Tub * XBox * Ping Pong
Entire Place • 3 bedrooms
Note: Performance varies based on location, size, amenities, seasonality, and management quality. Data reflects the past 12 months.
Top Performing Airbnb Hosts in Midvale (2026)
Learn from the best! This table showcases top-performing Airbnb hosts in Midvale based on the number of properties managed and estimated total revenue over the past year. Analyze their scale and performance metrics.
| Host Name | Properties | Grossing Revenue | Stay Reviews | Avg Rating |
|---|---|---|---|---|
| Utahs Best Vacation Rentals | 13 | $559,669 | 416 | 4.56/5.0 |
| Airdream | 4 | $99,698 | 171 | 4.77/5.0 |
| Brandy | 1 | $90,014 | 162 | 4.95/5.0 |
| Marc Phillips | 3 | $89,297 | 207 | 4.75/5.0 |
| Marci | 1 | $75,734 | 138 | 4.99/5.0 |
| Garrett | 1 | $70,210 | 145 | 4.92/5.0 |
| Debbie | 1 | $59,154 | 147 | 4.99/5.0 |
| Travis | 1 | $58,003 | 20 | 5.00/5.0 |
| Jd | 2 | $57,966 | 414 | 4.84/5.0 |
| Allan | 3 | $54,123 | 49 | 4.95/5.0 |
Analyzing the strategies of top hosts, such as their property selection, pricing, and guest communication, can offer valuable lessons for optimizing your own Airbnb operations in Midvale.
Dive Deeper: Advanced Midvale STR Market Data (2026)
Ready to unlock more insights? AirROI provides access to advanced metrics and comprehensive Airbnb data for Midvale. Explore detailed analytics beyond this report to refine your investment strategy, optimize pricing, and maximize your vacation rental profits.
Explore Advanced MetricsMidvale Short-Term Rental Market Composition (2026): Property & Room Types
Room Type Distribution
Property Type Distribution
Market Composition Insights for Midvale
- The Midvale Airbnb market composition is heavily skewed towards Entire Home/Apt listings, which make up 84.2% of the 101 active rentals. This indicates strong guest preference for privacy and space.
- Looking at the property type distribution in Midvale, House properties are the most common (75.2%), reflecting the local real estate landscape.
- Houses represent a significant 75.2% portion, catering likely to families or larger groups.
- Smaller segments like hotel/boutique (combined 1.0%) offer potential for unique stay experiences.
Midvale Airbnb Room Capacity Analysis (2026): Bedroom Distribution
Distribution of Listings by Number of Bedrooms
Room Capacity Insights for Midvale
- The dominant room capacity in Midvale is 2 bedrooms listings, making up 31.7% of the market. This suggests a strong demand for properties suitable for couples or solo travelers.
- Together, 2 bedrooms and 3 bedrooms properties represent 55.5% of the active Airbnb listings in Midvale, indicating a high concentration in these sizes.
- A significant 43.6% of listings offer 3+ bedrooms, catering to larger groups and families seeking more space in Midvale.
Midvale Vacation Rental Guest Capacity Trends (2026)
Distribution of Listings by Guest Capacity
Guest Capacity Insights for Midvale
- The most common guest capacity trend in Midvale vacation rentals is listings accommodating 8+ guests (33.7%). This suggests the primary traveler segment is likely larger groups.
- Properties designed for 8+ guests and 4 guests dominate the Midvale STR market, accounting for 49.5% of listings.
- 51.5% of properties accommodate 6+ guests, serving the market segment for larger families or group travel in Midvale.
- On average, properties in Midvale are equipped to host 5.1 guests.
Midvale Airbnb Booking Patterns (2026): Available vs. Booked Days
Available Days Distribution
Booked Days Distribution
Booking Pattern Insights for Midvale
- The most common availability pattern in Midvale falls within the 271-366 days range, representing 34.7% of listings. This suggests many properties have significant open periods on their calendars.
- Approximately 66.4% of listings show high availability (181+ days open annually), indicating potential for increased bookings or specific owner usage patterns.
- For booked days, the 91-180 days range is most frequent in Midvale (33.7%), reflecting common guest stay durations or potential owner blocking patterns.
- A notable 34.7% of properties secure long booking periods (181+ days booked per year), highlighting successful long-term rental strategies or significant owner usage.
Midvale Airbnb Minimum Stay Requirements Analysis
Distribution of Listings by Minimum Night Requirement
1 Night
29 listings
28.7% of total
2 Nights
15 listings
14.9% of total
3 Nights
5 listings
5% of total
4-6 Nights
3 listings
3% of total
7-29 Nights
13 listings
12.9% of total
30+ Nights
36 listings
35.6% of total
Key Insights
- The most prevalent minimum stay requirement in Midvale is 30+ Nights, adopted by 35.6% of listings. This highlights the market's preference for longer commitments.
- A significant segment (35.6%) caters to monthly stays (30+ nights) in Midvale, pointing to opportunities in the extended-stay market.
Recommendations
- Align with the market by considering a 30+ Nights minimum stay, as 35.6% of Midvale hosts use this setting.
- If feasible, allowing 1-night stays, especially midweek or during low season, could capture last-minute bookings, as only 28.7% currently do.
- Explore offering discounts for stays of 30+ nights to attract the 35.6% of the market seeking extended stays.
- Adjust minimum nights based on seasonality – potentially shorter during low season and longer during peak demand periods in Midvale.
Midvale Airbnb Cancellation Policy Trends Analysis (2026)
Super Strict 30 Days
1 listings
1% of total
Super Strict 60 Days
4 listings
4% of total
Limited
4 listings
4% of total
Flexible
15 listings
14.9% of total
Moderate
26 listings
25.7% of total
Firm
43 listings
42.6% of total
Strict
8 listings
7.9% of total
Cancellation Policy Insights for Midvale
- The prevailing Airbnb cancellation policy trend in Midvale is Firm, used by 42.6% of listings.
- A majority (50.5%) of hosts in Midvale utilize Firm or Strict policies, indicating a market where hosts prioritize booking security.
- Strict cancellation policies are quite rare (7.9%), potentially making listings with this policy less competitive unless justified by high demand or property type.
Recommendations for Hosts
- Consider adopting a Firm policy to align with the 42.6% market standard in Midvale.
- Using a Strict policy might deter some guests, as only 7.9% of listings use it. Evaluate if potential revenue protection outweighs possible lower booking rates.
- Regularly review your cancellation policy against competitors and market demand shifts in Midvale.
Midvale STR Booking Lead Time Analysis (2026)
Average Booking Lead Time by Month
Booking Lead Time Insights for Midvale
- The overall average booking lead time for vacation rentals in Midvale is 45 days.
- Guests book furthest in advance for stays during January (average 71 days), likely coinciding with peak travel demand or local events.
- The shortest booking windows occur for stays in August (average 36 days), indicating more last-minute travel plans during this time.
- Seasonally, Winter (68 days avg.) sees the longest lead times, while Summer (41 days avg.) has the shortest, reflecting typical travel planning cycles.
Recommendations for Hosts
- Use the overall average lead time (45 days) as a baseline for your pricing and availability strategy in Midvale.
- For January stays, consider implementing length-of-stay discounts or slightly higher rates for bookings made less than 71 days out to capitalize on advance planning.
- Target marketing efforts for the Winter season well in advance (at least 68 days) to capture early planners.
- Monitor your own booking lead times against these Midvale averages to identify opportunities for dynamic pricing adjustments.
Popular & Essential Airbnb Amenities in Midvale (2026)
Amenity Prevalence
Amenity Insights for Midvale
- Essential amenities in Midvale that guests expect include: Wifi, Air conditioning, Free parking on premises, Kitchen, Smoke alarm, Hot water. Lacking these (any) could significantly impact bookings.
- Popular amenities like Heating, TV, Carbon monoxide alarm are common but not universal. Offering these can provide a competitive edge.
Recommendations for Hosts
- Ensure your listing includes all essential amenities for Midvale: Wifi, Air conditioning, Free parking on premises, Kitchen, Smoke alarm, Hot water.
- Prioritize adding missing essentials: Wifi, Air conditioning, Free parking on premises, Kitchen, Smoke alarm, Hot water.
- Consider adding popular differentiators like Heating or TV to increase appeal.
- Highlight unique or less common amenities you offer (e.g., hot tub, dedicated workspace, EV charger) in your listing description and photos.
- Regularly check competitor amenities in Midvale to stay competitive.
Midvale Airbnb Guest Demographics & Profile Analysis (2026)
Guest Profile Summary for Midvale
- The typical guest profile for Airbnb in Midvale consists of primarily domestic travelers (94%), often arriving from nearby New York, typically belonging to the Post-2000s (Gen Z/Alpha) group (50%), primarily speaking English or Spanish.
- Domestic travelers account for 94.2% of guests.
- Key international markets include United States (94.2%) and Canada (2%).
- Top languages spoken are English (68%) followed by Spanish (14.6%).
- A significant demographic segment is the Post-2000s (Gen Z/Alpha) group, representing 50% of guests.
Recommendations for Hosts
- Target domestic marketing efforts towards travelers from New York and Salt Lake City.
- Tailor amenities and listing descriptions to appeal to the dominant Post-2000s (Gen Z/Alpha) demographic (e.g., highlight fast WiFi, smart home features, local guides).
- Highlight unique local experiences or amenities relevant to the primary guest profile.
- Consider seasonal promotions aligned with peak travel times for key origin markets.
Nearby Short-Term Rental Market Comparison
How does the Midvale Airbnb market stack up against its neighbors? Compare key performance metrics like average monthly revenue, ADR, and occupancy rates in surrounding areas to understand the broader regional STR landscape.
| Market | Active Properties | Monthly Revenue | Daily Rate | Avg. Occupancy |
|---|---|---|---|---|
| Sundance | 61 | $6,552 | $867.92 | 33% |
| Alta | 44 | $5,993 | $971.20 | 39% |
| Daniel | 25 | $5,231 | $693.40 | 34% |
| Brighton | 151 | $4,367 | $557.15 | 37% |
| Oakley | 12 | $4,163 | $875.37 | 32% |
| Park City | 4,036 | $4,087 | $626.69 | 34% |
| Coalville | 36 | $3,711 | $440.00 | 33% |
| Mapleton | 11 | $3,385 | $365.91 | 41% |
| Heber City | 220 | $3,287 | $497.35 | 34% |
| Hideout | 105 | $3,209 | $453.17 | 35% |