Levan Airbnb Market Analysis 2025: Short Term Rental Data & Vacation Rental Statistics in Utah, United States
Is Airbnb profitable in Levan in 2025? Explore comprehensive Airbnb analytics for Levan, Utah, United States to uncover income potential. This 2025 STR market report for Levan, based on AirROI data from November 2024 to October 2025, reveals key trends in the niche market of 18 active listings.
Whether you're considering an Airbnb investment in Levan, optimizing your existing vacation rental, or exploring rental arbitrage opportunities, understanding the Levan Airbnb data is crucial. Leveraging the low regulation environment is key to maximizing your short term rental income potential. Let's dive into the specifics.
Key Levan Airbnb Performance Metrics Overview
Monthly Airbnb Revenue Variations & Income Potential in Levan (2025)
Understanding the monthly revenue variations for Airbnb listings in Levan is key to maximizing your short term rental income potential. Seasonality significantly impacts earnings. Our analysis, based on data from the past 12 months, shows that the peak revenue month for STRs in Levan is typically April, while January often presents the lowest earnings, highlighting opportunities for strategic pricing adjustments during shoulder and low seasons. Explore the typical Airbnb income in Levan across different performance tiers:
- Best-in-class properties (Top 10%) achieve $4,640+ monthly, often utilizing dynamic pricing and superior guest experiences.
- Strong performing properties (Top 25%) earn $2,693 or more, indicating effective management and desirable locations/amenities.
- Typical properties (Median) generate around $1,547 per month, representing the average market performance.
- Entry-level properties (Bottom 25%) see earnings around $1,038, often with potential for optimization.
Average Monthly Airbnb Earnings Trend in Levan
Levan Airbnb Occupancy Rate Trends (2025)
Maximize your bookings by understanding the Levan STR occupancy trends. Seasonal demand shifts significantly influence how often properties are booked. Typically, Aprilsees the highest demand (peak season occupancy), while October experiences the lowest (low season). Effective strategies, like adjusting minimum stays or offering promotions, can boost occupancy during slower periods. Here's how different property tiers perform in Levan:
- Best-in-class properties (Top 10%) achieve 47%+ occupancy, indicating high desirability and potentially optimized availability.
- Strong performing properties (Top 25%) maintain 39% or higher occupancy, suggesting good market fit and guest satisfaction.
- Typical properties (Median) have an occupancy rate around 31%.
- Entry-level properties (Bottom 25%) average 20% occupancy, potentially facing higher vacancy.
Average Monthly Occupancy Rate Trend in Levan
Average Daily Rate (ADR) Airbnb Trends in Levan (2025)
Effective short term rental pricing strategy in Levan involves understanding monthly ADR fluctuations. The Average Daily Rate (ADR) for Airbnb in Levan typically peaks in April and dips lowest during October. Leveraging Airbnb dynamic pricing tools or strategies based on this seasonality can significantly boost revenue. Here's a look at the typical nightly rates achieved:
- Best-in-class properties (Top 10%) command rates of $492+ per night, often due to premium features or locations.
- Strong performing properties (Top 25%) achieve nightly rates of $245 or more.
- Typical properties (Median) charge around $149 per night.
- Entry-level properties (Bottom 25%) earn around $115 per night.
Average Daily Rate (ADR) Trend by Month in Levan
Get Live Levan Market Intelligence 👇

Explore Real-time Analytics
Airbnb Seasonality Analysis & Trends in Levan (2025)
Peak Season (April, August, July)
- Revenue averages $3,209 per month
- Occupancy rates average 43.3%
- Daily rates average $238
Shoulder Season
- Revenue averages $2,197 per month
- Occupancy maintains around 29.4%
- Daily rates hold near $234
Low Season (January, March, October)
- Revenue drops to average $1,037 per month
- Occupancy decreases to average 21.4%
- Daily rates adjust to average $222
Seasonality Insights for Levan
- The Airbnb seasonality in Levan shows highly seasonal trends requiring careful strategy. While the sections above show seasonal averages, it's also insightful to look at the extremes:
- During the high season, the absolute peak month showcases Levan's highest earning potential, with monthly revenues capable of climbing to $3,518, occupancy reaching a high of 56.7%, and ADRs peaking at $247.
- Conversely, the slowest single month of the year, typically falling within the low season, marks the market's lowest point. In this month, revenue might dip to $751, occupancy could drop to 13.5%, and ADRs may adjust down to $191.
- Understanding both the seasonal averages and these monthly peaks and troughs in revenue, occupancy, and ADR is crucial for maximizing your Airbnb profit potential in Levan.
Seasonal Strategies for Maximizing Profit
- Peak Season: Maximize revenue through premium pricing and potentially longer minimum stays. Ensure high availability.
- Low Season: Offer competitive pricing, special promotions (e.g., extended stay discounts), and flexible cancellation policies. Target off-season travelers like remote workers or budget-conscious guests.
- Shoulder Seasons: Implement dynamic pricing that balances peak and low rates. Target weekend travelers or specific events. Offer slightly more flexible terms than peak season.
- Regularly analyze your own performance against these Levan seasonality benchmarks and adjust your pricing and availability strategy accordingly.
Best Areas for Airbnb Investment in Levan (2025)
Exploring the top neighborhoods for short-term rentals in Levan? This section highlights key areas, outlining why they are attractive for hosts and guests, along with notable local attractions. Consider these locations based on your target guest profile and investment strategy.
| Neighborhood / Area | Why Host Here? (Target Guests & Appeal) | Key Attractions & Landmarks |
|---|---|---|
| Levan Town Center | The heart of Levan, offering easy access to local amenities and services. Ideal for visitors looking to explore the quaint charm of the town. | Levan City Park, Local Shops, Levan Historical Society |
| Sanpete Valley | Surrounded by the stunning backdrop of mountains and valleys, this area is perfect for nature lovers and outdoor enthusiasts. | Mount Nebo, Hiking Trails, Fishing Spots |
| Manti-La Sal National Forest | A short drive from Levan, this forest offers breathtaking landscapes and outdoor activities, attracting adventurers year-round. | Hiking, Camping, Wildlife Viewing |
| Salt Creek Canyon | A popular destination for those seeking solitude and natural beauty, it's excellent for camping and photography. | Canyoning, Scenic Drives, Nature Trails |
| Sevier River | Known for fishing and scenic riverside camping, this area draws visitors looking to relax by the water. | Fishing, Canoeing, Picnicking |
| Levan's Historic Sites | The area is rich in history, offering unique attractions for history buffs visiting the town. | Levan's Historic Buildings, Local Heritage Events, Museums |
| Nearby Provo | A larger city nearby with more amenities and attractions, appealing to those looking for a blend of small-town charm and urban convenience. | BYU Campus, LaVell Edwards Stadium, Provo River Trail |
| Utah County | As a diverse area with a mix of urban and rural settings, it attracts a wide range of visitors and offers various outdoor and cultural experiences. | Utah Lake, Cultural Festivals, Outdoor Recreation |
Understanding Airbnb License Requirements & STR Laws in Levan (2025)
While Levan, Utah, United States currently shows low STR regulations, specific Airbnb license requirements might still exist or change. Always verify the latest short term rental regulations and Airbnb license requirements directly with local government authorities for Levan to ensure full compliance before hosting.
(Source: AirROI data, 2025, finding no licensed listings among those analyzed)
Top Performing Airbnb Properties in Levan (2025)
Benchmark your potential! Explore examples of top-performing Airbnb properties in Levanbased on Trailing Twelve Month (TTM) revenue. Analyze their characteristics, revenue, occupancy rate, and ADR to understand what drives success in this market.

Yuba Lake Barndominium Resort
Entire Place • 5 bedrooms
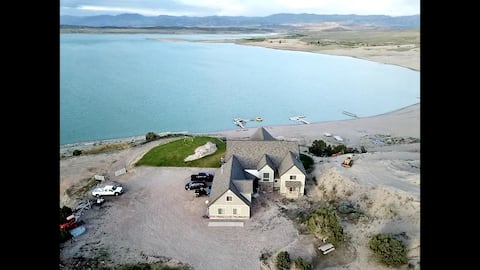
The Lake House At Yuba
Entire Place • 4 bedrooms

All 3 Beach Casitas- 3 king beds, firepit, views
Entire Place • 3 bedrooms

Beach Bungalow on private sandy beach - king bed
Entire Place • 1 bedroom
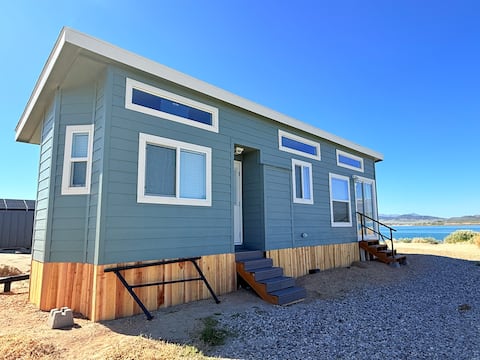
Lakeside Tiny Home-Views-Sandy Beach-Fire Pit
Entire Place • 1 bedroom
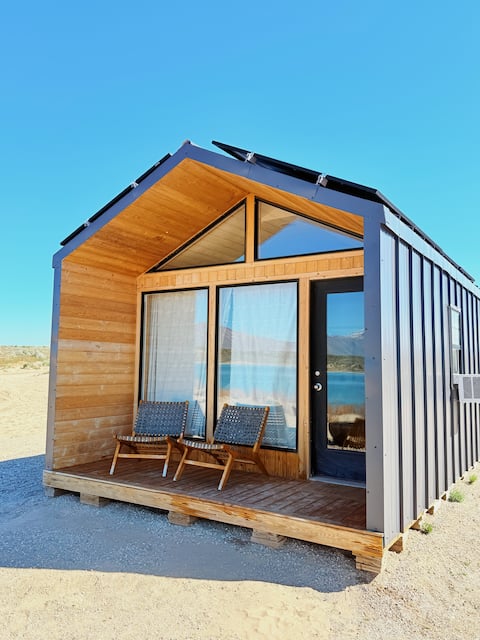
Lakeside Beach Casita- king bed, views, firepit
Entire Place • 1 bedroom
Note: Performance varies based on location, size, amenities, seasonality, and management quality. Data reflects the past 12 months.
Top Performing Airbnb Hosts in Levan (2025)
Learn from the best! This table showcases top-performing Airbnb hosts in Levan based on the number of properties managed and estimated total revenue over the past year. Analyze their scale and performance metrics.
| Host Name | Properties | Grossing Revenue | Stay Reviews | Avg Rating |
|---|---|---|---|---|
| Travis | 15 | $185,872 | 501 | 4.60/5.0 |
| Christine | 1 | $61,770 | 26 | 5.00/5.0 |
| Kyler | 1 | $34,062 | 6 | 4.67/5.0 |
| Jordan | 1 | $13,352 | 150 | 4.99/5.0 |
Analyzing the strategies of top hosts, such as their property selection, pricing, and guest communication, can offer valuable lessons for optimizing your own Airbnb operations in Levan.
Dive Deeper: Advanced Levan STR Market Data (2025)
Ready to unlock more insights? AirROI provides access to advanced metrics and comprehensive Airbnb data for Levan. Explore detailed analytics beyond this report to refine your investment strategy, optimize pricing, and maximize your vacation rental profits.
Explore Advanced MetricsLevan Short-Term Rental Market Composition (2025): Property & Room Types
Room Type Distribution
Property Type Distribution
Market Composition Insights for Levan
- The Levan Airbnb market composition is heavily skewed towards Entire Home/Apt listings, which make up 100% of the 18 active rentals. This indicates strong guest preference for privacy and space.
- Looking at the property type distribution in Levan, Outdoor/Unique properties are the most common (33.3%), reflecting the local real estate landscape.
- Houses represent a significant 33.3% portion, catering likely to families or larger groups.
Levan Airbnb Room Capacity Analysis (2025): Bedroom Distribution
Distribution of Listings by Number of Bedrooms
Room Capacity Insights for Levan
- The dominant room capacity in Levan is 1 bedroom listings, making up 72.2% of the market. This suggests a strong demand for properties suitable for couples or solo travelers.
- Together, 1 bedroom and 2 bedrooms properties represent 83.3% of the active Airbnb listings in Levan, indicating a high concentration in these sizes.
- With over half the market (72.2%) consisting of studios or 1-bedroom units, Levan is particularly well-suited for individuals or couples.
Levan Vacation Rental Guest Capacity Trends (2025)
Distribution of Listings by Guest Capacity
Guest Capacity Insights for Levan
- The most common guest capacity trend in Levan vacation rentals is listings accommodating 4 guests (44.4%). This suggests the primary traveler segment is likely small families or groups.
- Properties designed for 4 guests and 2 guests dominate the Levan STR market, accounting for 72.2% of listings.
- 22.2% of properties accommodate 6+ guests, serving the market segment for larger families or group travel in Levan.
- On average, properties in Levan are equipped to host 4.3 guests.
Levan Airbnb Booking Patterns (2025): Available vs. Booked Days
Available Days Distribution
Booked Days Distribution
Booking Pattern Insights for Levan
- The most common availability pattern in Levan falls within the 271-366 days range, representing 66.7% of listings. This suggests many properties have significant open periods on their calendars.
- Approximately 100.0% of listings show high availability (181+ days open annually), indicating potential for increased bookings or specific owner usage patterns.
- For booked days, the 31-90 days range is most frequent in Levan (44.4%), reflecting common guest stay durations or potential owner blocking patterns.
Levan Airbnb Minimum Stay Requirements Analysis
Distribution of Listings by Minimum Night Requirement
1 Night
16 listings
88.9% of total
3 Nights
1 listings
5.6% of total
30+ Nights
1 listings
5.6% of total
Key Insights
- The most prevalent minimum stay requirement in Levan is 1 Night, adopted by 88.9% of listings. This highlights the market's preference for shorter, flexible bookings.
- A strong majority (88.9%) of the Levan Airbnb data shows acceptance of very short stays (1-2 nights), indicating a dynamic, high-turnover market.
Recommendations
- Align with the market by considering a 1 Night minimum stay, as 88.9% of Levan hosts use this setting.
- Explore offering discounts for stays of 30+ nights to attract the 5.6% of the market seeking extended stays.
- Adjust minimum nights based on seasonality – potentially shorter during low season and longer during peak demand periods in Levan.
Levan Airbnb Cancellation Policy Trends Analysis (2025)
Moderate
16 listings
88.9% of total
Firm
1 listings
5.6% of total
Strict
1 listings
5.6% of total
Cancellation Policy Insights for Levan
- The prevailing Airbnb cancellation policy trend in Levan is Moderate, used by 88.9% of listings.
- The market strongly favors guest-friendly terms, with 88.9% of listings offering Flexible or Moderate policies. This suggests guests in Levan may expect booking flexibility.
- Strict cancellation policies are quite rare (5.6%), potentially making listings with this policy less competitive unless justified by high demand or property type.
Recommendations for Hosts
- Consider adopting a Moderate policy to align with the 88.9% market standard in Levan.
- Using a Strict policy might deter some guests, as only 5.6% of listings use it. Evaluate if potential revenue protection outweighs possible lower booking rates.
- Regularly review your cancellation policy against competitors and market demand shifts in Levan.
Levan STR Booking Lead Time Analysis (2025)
Average Booking Lead Time by Month
Booking Lead Time Insights for Levan
- The overall average booking lead time for vacation rentals in Levan is 70 days.
- Guests book furthest in advance for stays during April (average 214 days), likely coinciding with peak travel demand or local events.
- The shortest booking windows occur for stays in January (average 8 days), indicating more last-minute travel plans during this time.
- Seasonally, Spring (148 days avg.) sees the longest lead times, while Summer (37 days avg.) has the shortest, reflecting typical travel planning cycles.
Recommendations for Hosts
- Use the overall average lead time (70 days) as a baseline for your pricing and availability strategy in Levan.
- For April stays, consider implementing length-of-stay discounts or slightly higher rates for bookings made less than 214 days out to capitalize on advance planning.
- During January, focus on last-minute booking availability and promotions, as guests book with very short notice (8 days avg.).
- Target marketing efforts for the Spring season well in advance (at least 148 days) to capture early planners.
- Monitor your own booking lead times against these Levan averages to identify opportunities for dynamic pricing adjustments.
Popular & Essential Airbnb Amenities in Levan (2025)
Amenity Prevalence
Amenity Insights for Levan
- Essential amenities in Levan that guests expect include: Beach access, Air conditioning, Lake access, Free parking on premises, Heating. Lacking these (any) could significantly impact bookings.
- Popular amenities like Fire pit, Outdoor furniture, Waterfront are common but not universal. Offering these can provide a competitive edge.
Recommendations for Hosts
- Ensure your listing includes all essential amenities for Levan: Beach access, Air conditioning, Lake access, Free parking on premises, Heating.
- Consider adding popular differentiators like Fire pit or Outdoor furniture to increase appeal.
- Highlight unique or less common amenities you offer (e.g., hot tub, dedicated workspace, EV charger) in your listing description and photos.
- Regularly check competitor amenities in Levan to stay competitive.
Levan Airbnb Guest Demographics & Profile Analysis (2025)
Guest Profile Summary for Levan
- The typical guest profile for Airbnb in Levan consists of primarily domestic travelers (98%), often arriving from nearby Salt Lake City, typically belonging to the Post-2000s (Gen Z/Alpha) group (50%), primarily speaking English or Spanish.
- Domestic travelers account for 97.7% of guests.
- Key international markets include United States (97.7%) and Switzerland (1.1%).
- Top languages spoken are English (58.6%) followed by Spanish (19%).
- A significant demographic segment is the Post-2000s (Gen Z/Alpha) group, representing 50% of guests.
Recommendations for Hosts
- Target domestic marketing efforts towards travelers from Salt Lake City and Los Angeles.
- Tailor amenities and listing descriptions to appeal to the dominant Post-2000s (Gen Z/Alpha) demographic (e.g., highlight fast WiFi, smart home features, local guides).
- Highlight unique local experiences or amenities relevant to the primary guest profile.
- Consider seasonal promotions aligned with peak travel times for key origin markets.
Nearby Short-Term Rental Market Comparison
How does the Levan Airbnb market stack up against its neighbors? Compare key performance metrics like average monthly revenue, ADR, and occupancy rates in surrounding areas to understand the broader regional STR landscape.
| Market | Active Properties | Monthly Revenue | Daily Rate | Avg. Occupancy |
|---|---|---|---|---|
| Alta | 38 | $7,856 | $1052.66 | 40% |
| Sundance | 64 | $6,854 | $881.57 | 33% |
| Daniel | 20 | $5,398 | $658.61 | 38% |
| Brighton | 148 | $5,159 | $556.20 | 40% |
| Park City | 3,845 | $4,792 | $631.42 | 37% |
| Coalville | 33 | $4,066 | $464.44 | 33% |
| Hideout | 104 | $3,865 | $450.11 | 36% |
| Heber City | 198 | $3,864 | $497.80 | 36% |
| Francis | 12 | $3,746 | $400.29 | 39% |
| Oakley | 13 | $3,557 | $1052.36 | 29% |